
Prospects for euro area bank lending margins in an extended low-for-longer interest rate environment
Prospects for euro area bank lending margins in an extended low-for-longer interest rate environment
Published as part of the Financial Stability Review, November 2020.
In the wake of the pandemic, the economic outlook has deteriorated, the recovery is uncertain and interest rates are expected to remain at historical lows for even longer. The persistently low interest rate environment can both support and dampen the profitability and resilience of euro area banks. This special feature examines some aspects of how the low-for-even-longer interest rate environment may affect bank lending margins, and in turn banks’ ability to lend to the real economy and overall financial stability. It analyses euro area banks from 2000 onwards and finds evidence that margins fall more in response to declines in nominal short-term rates when these are low to begin with. The compression of margins reflects the sluggish response to further policy rate cuts of deposit rates as they approach the zero lower bound. Moreover, the analysis indicates that bank margins and overall profitability are influenced by both the level of real rates and, more materially, the level of inflation expectations embedded in nominal rates, which reflects the fact that bank profits are partly akin to seigniorage. Should a large share of deposit rates continue exhibiting persistent downward rigidity in the absence of a rebound in inflation expectations, the outlook for net interest margins will remain weak, adding to the bank balance sheet stress induced by the pandemic, notwithstanding the mitigating effect of low interest rates on bank provisions.
1 Introduction
The low interest rate environment has featured heavily in debates on prospects for the euro area banking system, which faces persistently weak profitability.[1] In particular, there has been an ongoing debate about the extent to which low and negative interest rates may, over time, become a drag on bank profitability and a cause of higher risk-taking by banks – possibly increasing risks to euro area financial stability. The debate reflects the fact that while euro area banks’ return on equity has increased from its trough of less than -3% in 2011-12, it has struggled to rise above 6% on average, which is below estimates of the cost of equity and low in comparison to other jurisdictions. At the same time, as set out in previous issues of the FSR, in recent years there have been growing signs of increased risk-taking, such as expanding mortgage lending and consumer credit at weaker terms and conditions in some countries. That said, overall bank risk-taking was not judged to be particularly elevated, especially given the better capitalisation of banks since the crises earlier in the decade.
In the wake of the pandemic, the low interest rate environment is expected to persist even longer, driven by lower real interest rates. Very low nominal interest rates have been a feature of the economic environment across advanced economies since 2009. They reflect a decline in equilibrium interest rates, i.e. the real short-term interest rates which would prevail if economies operated at their productive capacity (see Chart B.1), as well as policy rate cuts and additional measures introduced by central banks to stabilise macroeconomic activity and safeguard their price stability objectives in the course of the last decade. In parallel, longer-term interest rates have also declined to such an extent that, as at late September 2020, risk-free rates with a maturity as long as 20 years were below zero (see Chart B.1, right panel). Some financial market participants now only see short-term money market rates becoming positive again from 2030, around five years later than anticipated in late 2019 (see Chart B.1, left panel, right-hand graph).
Chart B.1
The phenomenon of very low real and nominal interest rates – a feature since 2009 – is set to persist in the wake of the pandemic

Sources: Left panel: Federal Reserve Bank of New York, real equilibrium interest rates based on Holston, K., Laubach, T. and Williams, J.C., “Measuring the natural rate of interest: International trends and determinants”, Journal of International Economics, Volume 108, Issue S1, 2017 pp. 59-75. Right panel: Refinitiv, Euro MTS Ltd, Fitch Ratings and ECB calculations.
Notes: Left panel: EA: euro area. Right panel: latest refers to 30 October 2020, pre-COVID to 21 February 2020 and end-2019 to 27 December 2019; yield curves are based on AAA-rated euro area sovereign bonds. EONIA: euro overnight index average.
This special feature examines some aspects of how the new context may affect banks’ net interest income. The first section focuses specifically on the impact of the real versus the nominal component of interest rates on net interest margins, returns and loan loss provisions. It also investigates whether the adverse impact of falling interest rates on net interest margins worsens when nominal short-term rates are negative and when low rates persist for an extended period. Taken together, these findings shed light on the potential impact of the low-for-longer interest rate environment on banks’ profitability. Of course, these effects can vary by bank, and by business line or portfolio (see Box A). Given the finding of non-linearity around negative interest rates, the second section discusses the prospects for overcoming the zero lower bound on customer deposit rates.
2 The role of real and nominal rates in bank intermediation
The real rate component of interest rates may affect bank profitability separately from changes in inflation expectations. Nominal interest rates consist of two components: the real interest rate and compensation for the loss of purchasing power over the life of a contract, which reflects the prevailing inflation expectations.[2] An increase in real rates, especially long-term interest rates, tends to mirror a strengthening in the expected growth of the real economy. Alternatively, it may capture changes in the creditworthiness of bank borrowers, which tends to worsen if real debt servicing costs increase and result in higher credit risk premia embedded in bank lending rates. By contrast, an increase in inflation expectations may lead to higher margins because part of banks’ funding (i.e. deposits held for transaction purposes) is remunerated at zero rates, or at rates that only partly reflect prevailing financial market conditions, while lending rates include a premium for higher expected inflation.
The current interest rate configuration appears largely to reflect lower real rates, in the context of secular stagnation and now the impact of the pandemic.[3] The economic literature identifies a number of structural factors exerting downward pressure on real interest rates. Of these, demographic developments, a slower pace of technological innovation, rising inequality and regulatory changes which create additional demand for safe and liquid assets have been highlighted in the debate. The pandemic has led to weaker aggregate demand and consumer and business confidence indicators. In turn, this has weighed on bank profits via lower intermediation volumes and deteriorated borrower creditworthiness, as reflected in costs associated with loan losses. Moreover, productivity may also be persistently lower, serving to reduce real interest rates further.
An updated analysis of euro area banks confirms that higher nominal short-term interest rates and a steeper yield curve support banks’ net interest margins (see column (1) of Table B.1).[4] The core element of bank intermediation is the ability to “borrow short” and “lend long” ‒ in other words, banks fund longer-term assets (e.g. mortgages) with shorter-term liabilities (e.g. customer deposit accounts, some of which offer transaction services and are not remunerated). They take a margin from the difference in interest rates typically implied by this maturity transformation.[5] Even outside of a low interest rate environment, these intermediation margins increase when interest rates are higher. This is because the rates that banks earn on the longer-term assets rise, while the part of banks’ funding costs formed by deposits generally tends to respond less.[6]
Table B.1
The estimated impact of nominal and real rates on bank profitability

Source: ECB calculations.
Notes: The sample covers yearly data over the period 2000-18 for 3,629 banks located in 18 euro area countries, with a total of 45,430 observations. *, ** and *** denote significance at the 10%, 5% and 1% levels. Clustered standard errors, with clustering at the level of individual banks, are reported in parentheses. Columns (1) and (2) focus on the net interest margin (NIM), defined as net interest income as a proportion of total interest-earning assets, column (3) focuses on the real NIM (i.e. the nominal NIM minus the current inflation rate), and columns (4) and (5) cover overall profitability measured by the return on equity (ROE) and the return on assets (ROA) respectively. Country-specific and bank-specific controls included (but not shown) are: real GDP growth, bank equity over total assets, liquid assets over total assets and deposits over total assets. The real short-term interest rate is defined as the difference between the three-month overnight index swap (our measure of the short-term nominal rate) and the current Consumer Price Index inflation rate. The real long-term interest rate is the difference between the nominal ten-year domestic sovereign bond yield and long-term inflation expectations obtained from inflation-linked swaps again at the ten-year horizon. Fixed-effect panel estimates are presented (i.e. all specifications include bank fixed effects).
Notably, higher nominal interest rates driven by variation in inflation expectations are found to be particularly important for margins.[7] The explicit distinction between changes in nominal interest rates due to variation in real rates and changes driven by higher inflation expectations is a key feature of this analysis. Higher interest rates when driven by higher inflation expectations are found to lead to a significant increase in net interest margins. Generally, this suggests that part of bank profitability is akin to seigniorage. That is to say, banks earn returns from having access to non-interest-bearing funding (customer deposits), while their assets generate returns which compensate for the anticipated loss of purchasing power due to inflation. Interestingly, higher current inflation rates can only marginally boost nominal profitability, presumably because unanticipated changes in inflation cannot be incorporated into the pricing of financial contracts. The above effect is also visible when expressing margins in real terms and also carries over to overall profitability (for both return on assets (ROA) and return on equity (ROE)).
When higher rates reflect real factors, the impact on profitability is found to be more mixed. Higher real long-term interest rates for a given level of inflation expectations tend to be associated with slightly lower net interest income.[8] Higher real short-term rates support banks’ margins, reflecting the limited sensitivity of remuneration on transaction deposits to market conditions.
Chart B.2
Lower short-term rates appear to squeeze margins more when they are negative
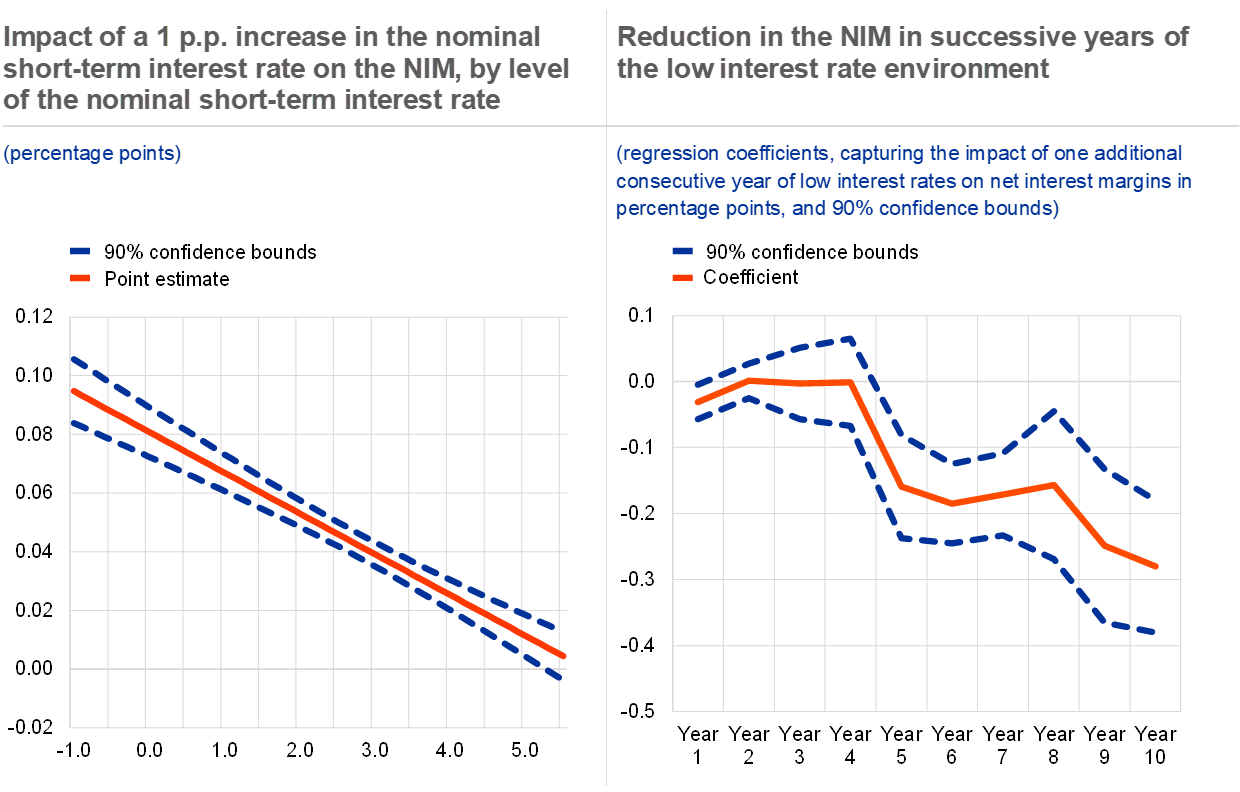
Source: ECB calculations.
Notes: Left panel: based on specification (3) of Table B.1. 10% confidence bands are displayed. Right panel: the depicted impact of an additional year of the low interest rate environment is conditional on all control variables included in column (2) of Table B.1, in order to capture the effect of persistence holding everything else equal.
Lower nominal short-term interest rates squeeze margins more when short-term rates are low. The results from including a quadratic term of the nominal short-term interest rate in the specification show that low starting values for interest rates result in nominal short-term rates having a steeper impact on banks’ net interest margins (see Chart B.2, left panel).[9] Adding an interaction term between the short-term interest rates and a dummy for the period over which negative interest rates on excess reserves held in the ECB’s deposit facility have been applicable reveals that the impact of nominal short-term interest rates on the net interest margin increases by a factor of 10 when short-term rates are negative compared with a positive starting point. This is also consistent with there being a zero lower bound on the interest rates for retail deposits.
The impact of low interest rates on bank profitability may change over time, but in principle the effect of longevity can operate in both directions. On the one hand, banks’ intermediation capacity can be damaged by long-lasting low profitability; on the other hand, banks may only start adjusting their business model to match the environment (e.g. by passing on negative interest rates to depositors) if they expect this environment to last. Time dummies to incorporate the persistence of low interest rate periods[10] over the years reveal a notable deterioration in the NIM in the fifth year, followed by a stabilisation (see Chart B.2, right panel). The results above do not control for possible transition effects, which may originate from the gradual repricing of assets and liabilities and may be expected to temporarily mitigate the adverse impact of lower rates on bank margins. Controlling for that, which would require detailed information on the financial duration of both assets and liabilities, could lead to a less benign assessment of the role of persistently low rates.
3 Prospects for the pass-through of negative interest rates to deposit rates
Since 2014 euro area banks have only gradually moved to charging negative interest rates on customer deposits. The stock of retail deposits priced at negative rates has gradually increased over the last six years, reaching about one-third of all corporate deposits while remaining considerably more contained for household deposits. Despite this, deposits stuck at the zero lower bound now represent the bulk of total retail deposits (for instance, the share of retail deposits with a rate between 0% and 0.05% has been hovering at around two-thirds since 2017). The share of household deposits priced at negative rates is negligible for longer term deposits, while the corresponding share for overnight deposits has started increasing more recently, reaching 7% as at September 2020. Negative rates in this segment are observed only in some euro area countries (Germany, Italy, Cyprus, the Netherlands, Finland and Belgium). Corporate deposits are subject to negative rates in both the longer-term and the overnight segments, the latter being by far the most relevant category. Nonetheless, the shape of the cross-bank distribution of the rates applied to corporate deposits shows a progressive and visible compression of the mass at zero (see Chart B.3, upper panel).
A number of structural features of the economy may explain the relevance and persistence of the zero lower bound on deposit rates. As mentioned above, the leeway to charge negative rates is considerably smaller for deposits made by households. For corporate deposits, existing analyses illustrate that negative rates are more likely to be passed through by stronger banks.[11] Moreover, banks charging negative rates on NFC overnight deposits tend to be those dealing with larger clients (see Chart B.3, lower panel). This is consistent with the hypothesis that the size of the deposit and the complexity of the available payment services largely determine the transaction costs that firms would face if they had to turn these deposits which are mostly used to manage their liquidity and payments into cash. Accordingly, banks operating with smaller clients or in countries dominated by smaller firms may have only limited headroom to overcome the zero lower bound on these deposits.
Chart B.3
The distribution of NFC deposit rates
Evolution of the distribution of NFC deposit rates, across banks
(percentage points)

Sources: ECB (individual balance sheet item and MFI interest rate statistics) and ECB calculations.
Notes: Upper panel: time series of box plots representing the distribution of deposit rates across banks in euro area countries. For each period, the box plots represent the 5th, 25th, 50th, 75th and 95th percentile of the distribution. Quarterly frequency; based on the distribution in the last month of each quarter considered. Lower panel: bank-level scatter plots of rates on new business deposits (y-axis), average across all categories weighted by the corresponding outstanding amounts, and share of new loans to NFCs above €1 million (x-axis). The x-axis is a proxy that indicates whether the banks deal with large clients. Observations with negative rates are highlighted by darker shaded points. Each panel reports data for the corresponding month only.
Deposit rates versus share of large loans to NFCs
(x-axis: percentage of total NFC loans; y-axis: percentage points)

Looking ahead, banks in the euro area may find it increasingly difficult to continue charging negative rates on a significant share of their deposits. Market rates are expected to remain at historically low levels for a long time, largely due to developments in the structural factors underpinning the low-rate environment. Consequently, the sluggishness by which banks charge negative deposit rates more extensively will have a continuing impact on their margins and profitability. While euro area banks can mitigate the costs associated with the zero lower bound by relying more heavily on other sources of funding such as central banks or financial markets, this strategy may also be subject to constraints. Retail deposits, which represent the largest single item in banks’ funding structure (44% of total funding in July 2020, in line with the traditional role of maturity transformation), matter for the formation of not only net interest income but also net fee and commission income, as payments and other deposit-related services generate a large volume of fees.
4 Conclusion
The impact of the low real and nominal interest rate environment on euro area banks’ profitability prospects needs to be considered in the new economic context. Prior to the pandemic, there was already a debate as to whether the balance between supportive and dampening effects of low interest rates on euro area bank profitability was changing. The main supportive effects come from the positive impact of low interest rates on the economic outlook, decreasing loan losses due to improved borrower creditworthiness, and increasing intermediation volumes. The dampening effects studied in this special feature, reflect the negative impact of low rates on net interest margins. Expectations are now for historically low rates to remain for even longer, still driven largely by real interest rates.
The findings in this special feature suggest that the longer interest rates remain low, and in the absence of a rebound in inflation expectations, the more of a drag on euro area bank net interest margins they can become. This has relevance for the current context, where the extended persistence of the low interest rate environment comes on the back of a decade of low rates and has been accompanied by a large swathe of benchmark rates below zero. The findings of this analysis of euro area banks’ past performance suggest that these conditions are consistent with pressure on net interest margins and net interest incomes. This is especially likely if the pass-through of negative interest rates continues to remain sluggish. While low rates should help keep the cost of risk lower than otherwise, an increasing drag from squeezed margins is, other things being equal, a significant challenge to bank profitability.
Box A A portfolio perspective on bank profitability using (post-)pandemic stress-test scenarios
Granular stress-test data can be used to construct a comprehensive measure of return at portfolio level for different economic scenarios.[12] This box uses actual bank portfolio-level information from two stress-test exercises, the 2018 European Banking Authority (EBA) stress test and the recent ECB COVID-19 vulnerability analysis (VA), to calculate portfolio-level risk-adjusted return on assets (ROA) for the euro area as a whole and for individual countries. This measure is broader than a net interest margin (NIM), taking into account costs associated with holding the related portfolio, such as credit risk and the cost of equity alongside the effective interest rate and funding costs required to derive the NIM.[13] This measure can then be deconstructed to provide additional insights into the question of how adverse macroeconomic and financial developments, including very low interest rates, affect the profitability of bank intermediation.[14] The analysis sheds light on the profitability of banking activities as opposed to the profitability of banks themselves, thus abstracting from some structural factors such as cost inefficiencies deriving from overheads.
Behind the aggregate improvement of risk-adjusted returns in recent years, the extent and drivers of recovery differ by portfolio type (see Chart A, upper panel). From 2015 to 2018 returns on sovereign and financial portfolios were relatively flat, while returns generally increased for household mortgage, consumer credit and non-financial corporate (NFC) portfolios. At the same time, volumes increased most markedly for sovereigns and, to a lesser degree, for mortgage and NFC portfolios.[15] In 2019 financial and sovereign portfolio returns remained relatively stable, while risk-adjusted returns fell significantly for the household consumer credit and mortgage portfolios, related mostly to a decrease in their effective interest rates, while the dampening impact of the cost of risk began to increase. That said, returns on exposures to non-financial corporations increased, accompanied by an increase in exposure volumes. Sovereign exposures largely recorded returns that barely covered banks’ weighted-average cost of capital, indicating that portfolios used in particular for regulatory purposes may have been a drag on profitability. Taken together, this suggests that the profitability of household and NFC loan intermediation is more sensitive to economic and interest rate conditions than that of sovereign and financial intermediation.
Chart A
The macroeconomic and interest rate environment generates different patterns of returns across portfolios
Euro area risk-adjusted ROA components by portfolio
(left-hand scale: percentages per annum; right-hand scale: € trillions per annum)

Sources: 2016 and 2018 EBA stress-test templates, 2020 ECB vulnerability analysis, Bloomberg Finance L.P. and ECB calculations.
Notes: COR: cost of risk; EIR: weighted-average effective interest rate; ROA: weighted-average risk-adjusted return on assets; WACC: weighted-average cost of capital. FIN: financial corporations; HH-CC: household consumer credit; HH-HP: household mortgages; NFC: non-financial corporations; SOV: sovereigns. Given the lack of historical data for the year 2018, 2018 baseline projections from the 2018 stress-test exercise are used as an approximation. This may lead to some bias in the corresponding data.
1) Minimum cumulative growth from the starting point level.
2) Maximum percentage point deviation from the starting point rate.
3) Maximum percentage deviation from the starting point level.
Peak-to-trough change in ROA projections by portfolio under the 2018 EBA adverse scenario for 2018-20 and the COVID-19 VA central and severe scenarios for 2020-22
(percentage point changes per annum)


Projections of profitability under stress-test scenarios for growth and interest rates also point to the differing sensitivity of returns for different portfolio types (see Chart A, lower panel). Changes in portfolio-level returns are estimated under two scenarios for economic activity and interest rates (the central and severe COVID-19 VA scenarios) and benchmarked against projections under the 2018 EBA stress-test adverse scenario (see Chart A, lower panel).[16] Risk-adjusted returns decline in all three scenarios, but the largest declines are under the COVID-19 severe scenario (although scenarios, samples and methodologies have changed over time).[17] In all cases, returns on the household consumer credit portfolio fall the most, driven by increases in the cost of risk. Furthermore, in the COVID-19 central and severe scenarios, effective interest rates remain low and cannot offset the fall in returns. For household mortgage lending, effective interest rates also fall, while the cost of risk rises. By contrast, returns on financial and non-financial corporate lending still decline, but effective interest rates continue to provide some offset to the rising cost of risk. Returns on sovereign portfolios fall the least in all scenarios.
Chart B
Heterogeneity of profitability projections across countries and portfolios – scenario projections from the 2018 EBA stress test and the 2020 ECB vulnerability analysis
ROA projections across countries by portfolio under the EBA adverse scenario in 2018 and the ECB VA central and severe scenarios in 2020
(percentages per annum)
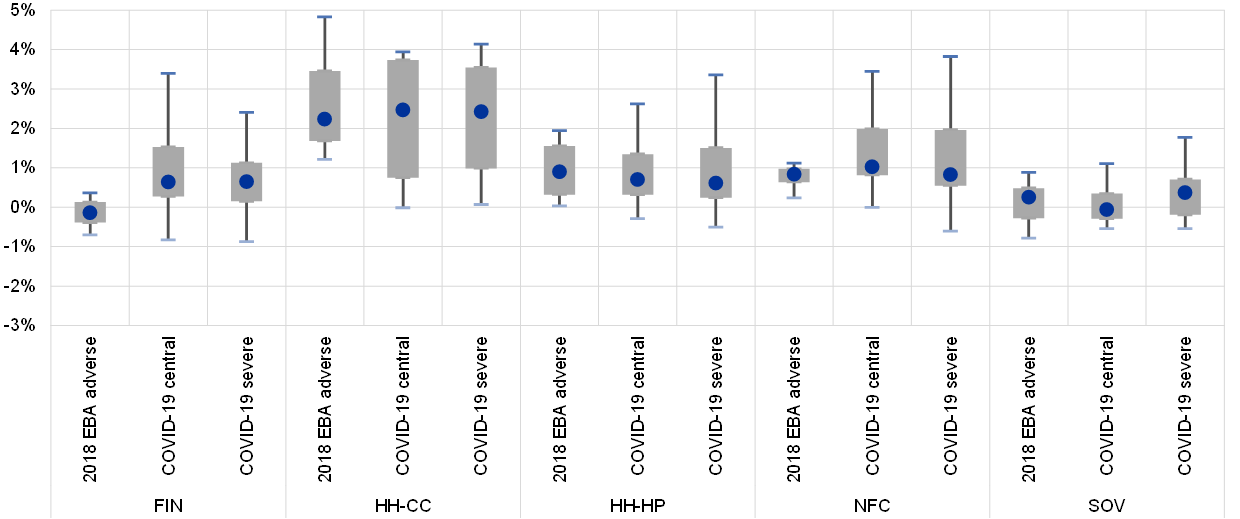
Sources and notes: See Chart A.
Portfolio types respond to stress-test scenarios very differently across countries, with those with the greatest average sensitivity to the scenarios seeming to show the greatest dispersion of returns (see Chart B). Heterogeneity is most pronounced for consumer credit, while sovereign portfolios seem to react most consistently across countries and scenarios. On the other hand, exposures to mortgages, as well as to financial and non-financial corporations, exhibit relatively homogeneous returns across countries for the 2018 EBA adverse scenario, while the corresponding returns are much more dispersed under the two COVID-19 scenarios. The lower ranges of the box plots indicate that most portfolios in certain countries are barely profitable or even loss-making in the sense of a negative adjusted return. While under the 2018 EBA stress test, ten country portfolios transition from a profitable to a non-profitable state between the starting point (i.e. the year 2017) and the first year of the adverse scenario (2018), the number of switching portfolios reaches 20 and 23 respectively under the central and severe COVID-19 scenarios of the VA exercise in the year 2020. This provides evidence that the pandemic is putting even more pressure on bank portfolio profitability in selected countries than a regular stress-test crisis scenario, which may further reduce the ability of some banks to extend credit to certain sectors of the real economy. At the same time, lower profitability would reduce the capacity of banks to provision their exposures adequately in response to deteriorating quality, leading to relevant financial stability risks.
- See Schnabel, I., “Going negative: the ECB’s experience”, speech at the Roundtable on Monetary Policy, Low Interest Rates and Risk Taking at the 35th Congress of the European Economic Association, Frankfurt, 26 August 2020.
- It can be further decomposed into the average short-term risk-free real rate expected over the maturity horizon, a term premium and an inflation risk premium.
- See “Macroprudential policy issues arising from low interest rates and structural changes in the EU financial system”, European Systemic Risk Board, November 2016, and Lane, P., “Determinants of the real interest rate”, remarks at the National Treasury Management Agency, 28 November 2019.
- Many papers document this finding. See, among others, Angbazo, L., “Commercial bank net interest margins, default risk, interest-rate risk, and off-balance sheet banking”, Journal of Banking and Finance, Vol. 21(1), 1997; Demirgüç-Kunt, A. and Huizinga, H., “Determinants of Commercial Bank Interest Margins and Profitability: Some International Evidence”, World Bank Economic Review, Vol. 13(2), 1999; and Albertazzi, U. and Gambacorta, L., “Bank profitability and the business cycle”, Journal of Financial Stability, Vol. 5(4), 2009. The most recent contributions specifically focus on the low interest rate environment and unconventional monetary policy measures; see for example Borio, C. and Gambacorta, L., “Monetary policy and bank lending in a low interest rate environment: Diminishing effectiveness?”, Journal of Macroeconomics, Vol. 54, 2017, and Altavilla, C., Boucinha, M. and Peydrò, J., “Monetary policy and bank profitability in a low interest rate environment”, Economic Policy, 2018. The estimation presented above replicates and builds on the baseline specification of Claessens, S., Coleman, N. and Donnelly, M., “‘Low-for-long’ interest rates and banks’ interest margins and profitability: Cross-country evidence”, Journal of Financial Intermediation, Vol. 35, 2018, and uses annual information for 3,629 euro area banks.
- Because bank assets generate returns linked to the long end of the yield curve, while the costs of their liabilities tend to co-move with the short end of the curve, net interest margins tend to increase when the slope of the yield curve steepens.
- See Borio, C., Gambacorta, L. and Hofmann, B., “The influence of monetary policy on bank profitability”, BIS Working Papers, No 514, Bank for International Settlements, October 2015.
- Here longer-term inflation expectations at the ten-year horizon are extracted from inflation-linked swaps. The sample covers a period of relatively low and stable inflation expectations in line with the ECB’s definition of price stability. Large increases in inflation expectations are unlikely to support bank profitability as depositors would probably no longer accept to hold non-remunerated or lowly remunerated deposits, which are essential for banks’ seigniorage-like income-generation capacity.
- The latter result, admittedly against our own prior thinking, could reflect the possible weakening of loan demand by cash-rich firms in boom periods. This should not be overemphasised, however, as the point estimate of the elasticity coefficient is significantly lower than that for nominal rates, and in particular inflation expectations, indicating a relatively weak impact in economic terms.
- This exercise updates the one presented in Kerbl, S. and Sigmund, M., “From low to negative rates: an asymmetric dilemma”, Financial Stability Report, Oesterreichische Nationalbank, Issue 32, 2016, pp. 120-137.
- Defined as a period with a nominal short-term interest rate below the sample median (1%).
- See Altavilla, C., Burlon, L., Giannetti, M. and Holton, S., “Is there a zero lower bound? The effects of negative policy rates on banks and firms”, Working Paper Series, No 2289, ECB, June 2019.
- For a different application of stress-test data to assess bank profitability, see the special feature entitled “How can euro area banks reach sustainable profitability in the future?”, Financial Stability Review, ECB, November 2018.
- The cost of equity is derived from Bloomberg, as opposed to the other drivers which are all sourced directly from relevant stress-test data.
- The analysis abstracts from other risk drivers such as market risk and other sources of returns, such as fee and commission income, as well as any overhead costs.
- It should be noted that these developments, and in particular the changes in volumes shown in the upper panel of Chart A, are also affected by changes in the stress-test sample of banks.
- For more information on the 2020 ECB vulnerability analysis, see the results overview on the ECB Banking Supervision website. The corresponding scenarios are based on the June 2020 Eurosystem staff projections.
- See the EBA stress-test methodological notes for the years 2016, 2018 and 2020, which describe the relevant constraints and assumptions governing these exercises. A consistent feature is the assumption of a static balance sheet, implying that total assets per bank and portfolio do not change across the scenario projections. The 2020 stress test has been postponed by one year in the light of the pandemic; however, it has been replaced with an ECB vulnerability analysis relying largely on the EBA methodology. Furthermore, the EBA stress test is a constrained bottom-up exercise, whereas the ECB vulnerability analysis instead follows a constrained top-down approach that is quality assured through interactions with supervisory teams. For a discussion of ECB stress-test quality assurance from a top-down perspective, see Macroprudential Bulletin, ECB, Issue 3, June 2017, Chapter 2.