
Counterparty and liquidity risks in exchange-traded funds
Counterparty and liquidity risks in exchange-traded funds
Published as part of the Financial Stability Review November 2018.
Over the last decade, exchange-traded funds (ETFs) have grown at a fast pace both globally and in the euro area. ETFs typically offer low-cost diversified investment opportunities for investors. ETF shares can be bought and sold at short notice, making them efficient and flexible instruments for trading and hedging purposes. At the same time, the wider use of ETFs may also come with a growing potential for transmission and amplification of risks in the financial system. This special feature focuses on two such channels arising from (i) liquidity risk in ETF primary and secondary markets and (ii) counterparty risk in ETFs using derivatives and those engaging in securities lending. While ETFs still only account for a small fraction of investment fund asset holdings, their growth has been strong, suggesting a need for close monitoring from a financial stability and regulatory perspective, including prospective interactions with other parts of the financial system.
1 Introduction
Over the last decade, ETFs in the euro area have seen double-digit annual growth rates in assets under management, while accounting for sizeable shares of trading volumes on exchanges. Amid a broader shift from active to passive investing, total assets of euro area-domiciled ETFs have doubled in the past four years and amount to approximately €660 billion or 16% of the global market (see Chart C.1).[1] ETFs account for approximately 10% of equities and about 5% of bonds held by euro area investment funds, while the share of ETF trading in equity trading is likely to be more significant.[2] ETF shares are also increasingly used as collateral and in securities lending transactions, as well as by some institutional investors for liquidity management purposes.[3]
Strong growth of euro area-domiciled ETFs since 2009
(assets under management in € billions, percentages)
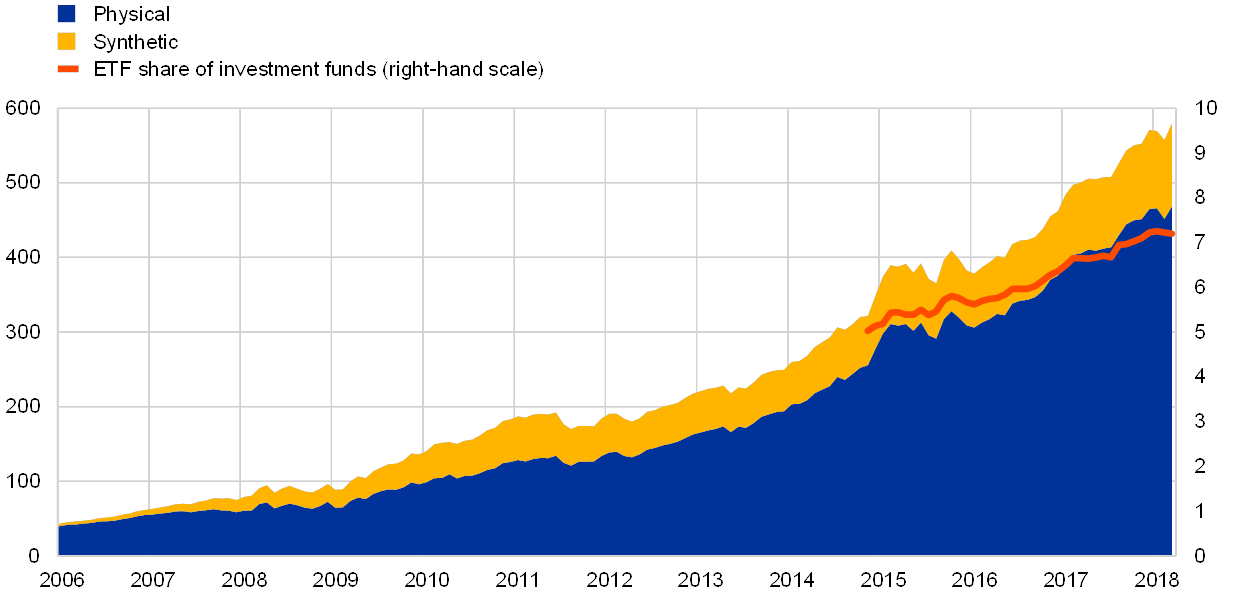
Sources: Thomson Reuters Lipper and ECB calculations.Notes: Physical ETFs own the securities of the index they aim to replicate. Synthetic ETFs use derivatives to obtain the intended exposure.
The liquidity features of ETFs combine characteristics of open-ended investment funds and tradable securities. On the one hand, the open-ended nature of ETFs resembles traditional investment funds, while on the other hand the ability of investors to trade ETFs throughout the day is a feature of tradable securities such as equities. Unlike traditional open-ended investment funds, ETFs are not directly linked with end-investors. Instead, investors buy and sell ETF shares through a broker which deals in ETF secondary markets.[4] For example, the investor submits a sell order to its broker, which then executes the trade either on-exchange or over the counter with a market-maker (see Chart C.2). The market-maker, in turn, delivers the ETF shares to a specialised institution, the so-called authorised participant (AP).[5] Only APs can create and redeem ETF shares directly with the fund, while APs can be at the same time market-makers. In the example, the AP will either receive cash or securities in exchange for the redeemed shares.[6] Liquidity in ETFs requires a smooth functioning of this chain of transactions, implying a crucial role for both market-makers and APs to ensure ETF market functioning.
ETFs have a more complex structure than traditional investment funds, as ETFs do not deal directly with end-investors
Stylised transmission of an ETF share sell order
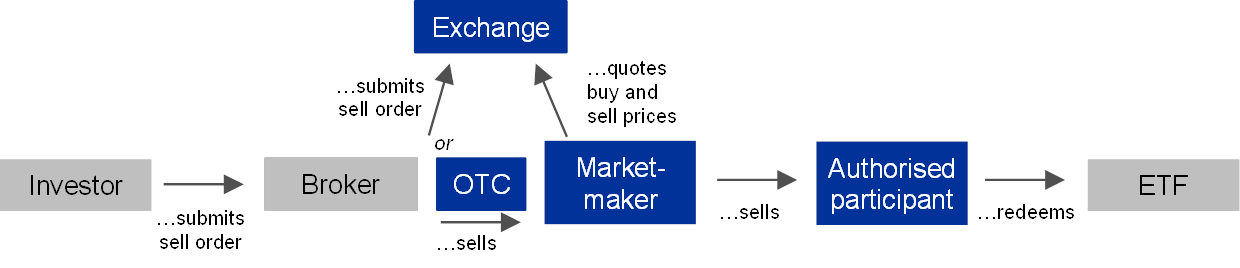
Source: ECB.Notes: The blue boxes represent elements that are typically not part of traditional investment funds. APs are often also market-makers in ETFs and can be affiliated to the ETF issuer. OTC stands for over-the-counter markets.
Market-makers and APs have incentives to trade in ETF primary and secondary markets if they can benefit from arbitrage opportunities. There are two forms of arbitrage in which market-makers and APs can engage. First, market-makers and APs can make a profit by creating or redeeming ETF shares if the fund’s net asset value deviates from the ETF share price (henceforth NAV spread). The second form of arbitrage involves quoting bid and ask prices on trading venues and profiting from the bid-ask spread.[7] Whenever a broker submits a buy or sell order, market-makers stand ready to transact and will nearly instantaneously hedge their position to maintain a matched book.[8] Market-makers and APs may also trade in primary markets to benefit from the NAV spread. Although primary market transactions are typically less frequent than transactions on secondary markets, they seem to be an important factor determining ETF liquidity overall.[9]
ETFs yield important benefits to institutional and retail investors alike and may contribute to completing markets. First, ETF shares are frequently traded in ways that suggest that they are more liquid than the individual securities in the ETF’s portfolio as evidenced by, for example, narrow bid-ask spreads (see Box A). The near instantaneous liquidity offered by ETFs is an important factor for institutional investors’ portfolio decisions.[10] Second, low transaction costs relative to active investment funds and sets of underlying securities allow cheap access to diversified investments. In particular, end-investors can gain access to exposures that were previously hard to replicate. ETFs may thus enable investors to allocate their capital more efficiently. Synthetic ETFs using derivatives to track an index usually exhibit superior tracking performance compared with physical ETFs. Synthetic replication also allows the ETF issuer to offer exposures to more illiquid markets that would be difficult to replicate through costly physical purchases.
Post-crisis regulatory measures have, to some extent, changed the regulatory environment in which ETFs operate, even though there is no overarching dedicated piece of legislation catering for the specificities of ETFs. ETFs in the EU are regulated by both the UCITS Directive, in their capacity as investment funds, and the Markets in Financial Instruments Directive (MiFID), in their function as transferable securities. Bespoke ESMA Guidelines have introduced some specifics into UCITS regulation on ETFs, with a focus on disclosure requirements.[11] However, APs are not regulated as such, falling instead under banking regulation or MiFID investment firm provisions, where applicable. To the extent that ETFs use derivatives underpinning synthetic replication strategies, they are subject to the European Market Infrastructure Regulation (EMIR) adopted in 2012. EMIR includes, for example, measures to mitigate counterparty risk, such as margining requirements for OTC derivatives. Derivatives market reforms aimed at reducing counterparty risk may have also increased the cost of using synthetic replication strategies, which are widely used by ETFs in Europe.[12]
The wider use of ETFs may come with a growing potential to transmit and amplify risks in the financial system. First, there might be potential disruptions to ETF arbitrage and the liquidity of ETF shares in secondary markets. Investors may expect that ETF liquidity is high in all market conditions. This might induce selling pressure when liquidity deteriorates, especially given the increased use of ETFs based on their liquidity features. Second, there are concerns regarding the counterparty risk exposure of investors in ETFs using derivatives and those engaging in securities lending. Synthetic ETFs make use of total return swaps to obtain exposure to a particular index.[13] Many physical ETFs generate additional revenue by lending portfolio securities to borrowers. In both cases, counterparty risk arises as the ETF may suffer losses if the swap counterparty or the borrower defaults. Third, ETF ownership might affect the liquidity and volatility of underlying securities. However, there is an ongoing (academic) debate on the relevance of these effects and whether they have system-wide implications.[14] This special feature focuses on the first two channels related to liquidity and counterparty risk.
This special feature presents new evidence for the European ETF market on some key risk transmission and amplification channels associated with liquidity and counterparty risk. While most of the academic literature focuses on the empirical assessments of risks in the US market, this analysis focuses on European ETFs.[15] It finds that AP arbitrage activity, and thus the rebalancing of demand and supply pressures in ETF markets relevant for liquidity provision, declines in stressed market conditions. The findings also suggest that investors behave procyclically with respect to ETF counterparty risk. In stressed market conditions, investors sell their shares, prompting sizeable outflows and possible knock-on effects between ETFs of the same issuer or those using similar strategies. While the ETF market in the euro area still remains relatively small and accordingly harbours limited incremental financial stability risks, it could embed important amplification and interconnectedness potential during market stress.
2 Liquidity risk in ETFs
Risks to financial stability may arise in the event of disruptions to ETF liquidity that lead to significant redemption pressures across ETFs and knock-on effects on related markets. The liquidity of ETF shares is determined through the interplay of share creation and redemption, market-making and secondary market trading, including trading and hedging activity in related markets. Disruptions to ETF liquidity could, for example, arise through trading halts in underlying securities. Market conditions, such as extreme volatility, could increase the costs for market participants to provide liquidity. In addition, operational glitches at a market-maker may cause an abrupt temporary reduction of ETF liquidity. Such triggers could lead to an increase of bid-ask spreads and increase the cost for investors to exit the market through discounts to NAV. In a stress scenario, this could result in increased redemption pressures with feedback loops to the liquidity and volatility of underlying securities.
Liquidity transformation performed by ETFs is a key benefit for investors but could be subject to frictions. ETFs are capable of transforming less liquid assets into more liquid tradable securities.[16] Multiple participants provide liquidity based on their commercial incentives. ETF liquidity is hence jointly determined on primary, secondary and related markets used for hedging activities. Investors face the risk that liquidity may not be higher than the liquidity of the underlying securities in all market conditions. Past experience has shown that disruptions to ETF liquidity can occur in highly liquid markets, such as European or US equity markets, even if these episodes have been short-lived.[17]
The activities of APs and market-makers, as well as the factors behind potential withdrawals from market-making, are largely unexplored areas. APs are regulated institutions given that they are either banks or principal trading firms. However, they are not regulated in their capacity as APs, but instead are more generally within the scope of banking and securities regulation. Hence, there is generally no disclosure of APs and market-makers, although some ETF providers and stock exchanges voluntarily publish lists of institutions. Evidence on the number of APs and market-makers per ETF, as well as the concentration of their activities and their potential interconnectedness, is therefore limited.[18] The Central Bank of Ireland has recently reiterated the importance of transparency in this regard.[19]
Market-makers that deal on their own account using high-frequency strategies have recently increased in importance for ETF market-making. These firms usually have small balance sheets and trade large volumes of securities, aiming at zero net exposure through hedging.[20] They typically employ high-frequency strategies[21] exploiting small deviations of ETF share prices from net asset value and making small marginal profits based on bid-ask spreads. Increased competition in this area has reduced bid-ask spreads over recent years (see Box A). However, the reliance on algorithms, as well as the fast pace at which trading is executed, raise the potential impact of operational risk. Moreover, some research finds that high-frequency traders provide liquidity in normal times, while consuming liquidity in stressed times.[22]
Institutional investors are increasingly relying on ETFs for liquidity management purposes, which might imply that investors are becoming more sensitive to a materialisation of liquidity risk. Liquidity features offered by ETFs, in particular in bond markets, seem to be one of the key reasons to invest in ETFs.[23] Bond ETFs are often also used for cash management purposes, which might entail an expectation that liquidity remains high in all market conditions. If investors were forced to raise cash and liquidate ETF positions during stress periods, they could face unanticipated transaction costs in the form of higher than usual bid-ask spreads and NAV discounts. The use of ETFs as complements or substitutes for other liquid (or less liquid) instruments can create interdependencies between ETF markets. Furthermore, liquidity management issues among ETF investors, which could transmit any potential shock in the underlying markets to ETF investors, might imply that investors are becoming more sensitive to a materialisation of liquidity risk. These dynamics may be exacerbated by concentration in ETF arbitrage and the presence of market-makers with a small balance sheet capacity.
Box AEmpirical assessment of the liquidity risk channel
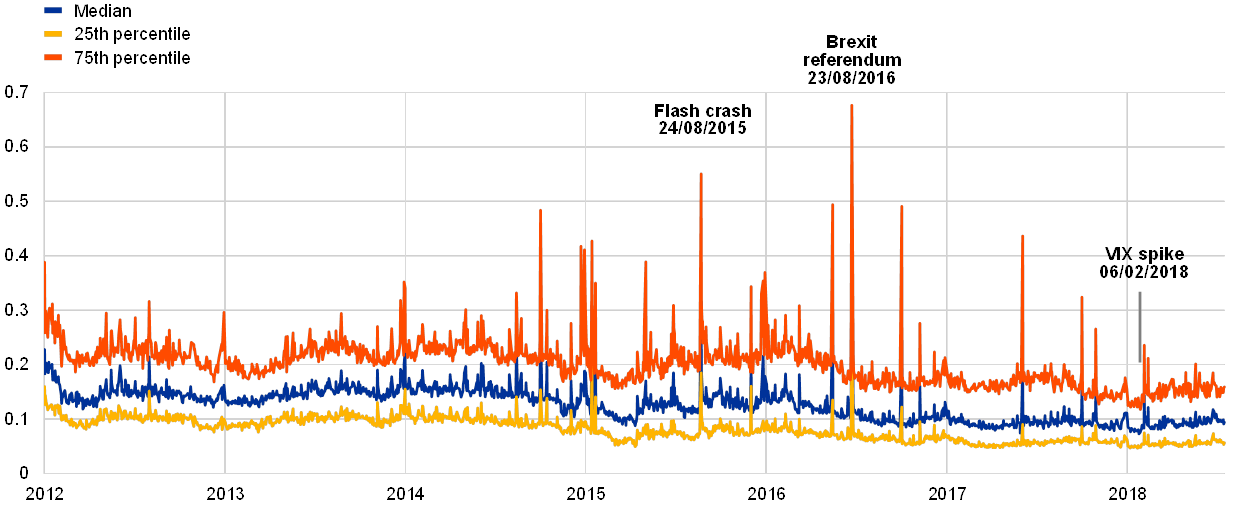
ETFs typically trade at narrow bid-ask spreads and close to their NAV (see Charts A and B). However, the demand for and supply of ETF shares in secondary markets can sometimes be unbalanced and ETF prices may temporarily deviate from NAVs. In these instances, APs can profitably eliminate price discrepancies and provide further liquidity to the market by creating or redeeming ETF shares. Thereby, demand imbalances are accommodated and prices are aligned with NAV. In the following, we test for frictions in this process in times of stress.
Chart A
Distribution of NAV spreads over time
(NAV spread as a percentage; EU-domiciled ETFs holding US or European stocks)

Sources: Bloomberg and Thomson Reuters Lipper.Notes: Sample contains equity ETFs with a US or European geographical focus. Small and new ETFs are excluded.
We conduct a panel analysis to assess whether market-wide stress has an effect on ETF arbitrage, as measured by share creation and redemption. The changes in ETF shares outstanding are regressed on NAV spreads in the preceding period, the VIX index, a proxy for market-wide stress, as well as their interaction term.[24] The sample contains daily data of euro area-domiciled equity and bond ETFs representing 90% of market capitalisation in their asset class at each point in time.
Chart B
Distribution of bid-ask spreads over time
(bid-ask spread as a percentage of mid-quote; EU-domiciled ETFs holding US or European stocks)
Sources: Bloomberg and Thomson Reuters Lipper.Notes: Sample contains equity ETFs with a US or European geographical focus. Small and new ETFs are excluded.
This fixed-effects panel regression model can be used to test for (i) the elasticity of AP arbitrage to NAV spreads ( ) and (ii) the extent to which this elasticity changes in response to volatility ( ) for equity and bond ETFs respectively. Conceptually, the change in shares outstanding from period t to t+1 should not affect NAV spreads in period t.[25] However, in a simultaneous equation specification we explicitly allow for endogeneity, leading to similar results.
Results show that APs indeed exploit NAV spreads by creating and redeeming ETF shares (see Table A). Consistent with results for the US market,[26] APs create and redeem more ETF shares when NAV spreads widen. The intensity of arbitrage, however, changes with volatility. On days with high volatility, APs reduce arbitrage activity, as implied by a negative interaction term (Column 1).
Arbitrage activity decreases in bond ETFs but not in equity ETFs (Column 3), where the interaction term is statistically insignificant. Under normal market conditions, an increase in the NAV spread by one percentage point is associated with an average increase in bond ETFs’ shares outstanding of 0.324 percentage point. Such a change in shares outstanding is substantial, given that there is little primary market activity on most trading days. In stressed times, however, the response in shares outstanding to NAV spreads decreases by 0.189 percentage point.
Table A
Results of the panel analysis
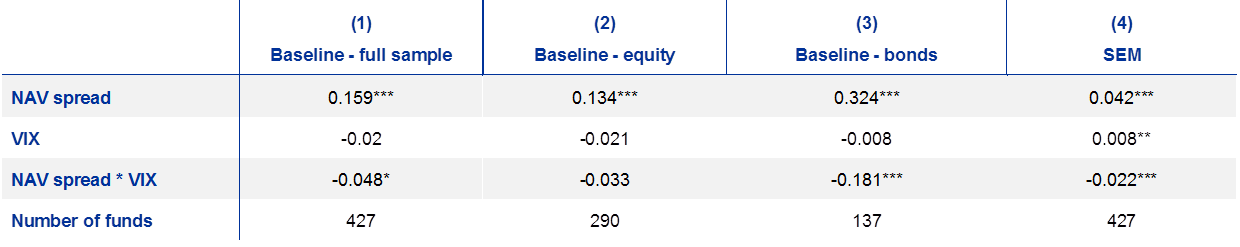
Notes: SEM: simultaneous equation model. Macro control variables are the risk-free rate, the credit risk premium and the term premium; ETF-specific control variables are the lagged return on NAV, the lagged return on the ETF and the fund age in months.Significance levels: *** = 0.1%, ** = 1%, * = 5%. We use Driscoll-Kraay (1998) standard errors.
The different findings for bond and equity ETFs could be due to the fact that underlying bond markets have higher limits to arbitrage, as bonds are typically less liquid than equities. Accommodating intraday demand imbalances and conducting arbitrage is less risky for APs, when offsetting hedge trades are readily available. APs can then meet ETF selling pressures and simultaneously sell the underlying basket or correlated assets without assuming market or inventory risk. However, offsetting hedges are more difficult to locate and more costly to trade in less liquid underlying asset classes, such as bonds, which are often traded over the counter. Liquidity provision for bond ETFs is thus riskier in volatile times.
3 Counterparty risk in ETFs
Apart from being exposed to market and liquidity risk, ETF investors bear counterparty risk in ETFs using derivatives or engaging in securities lending. Synthetic ETFs hold total return swaps whereby the ETF swaps the return on a basket of assets for the return on a benchmark index. Synthetic ETF investors are therefore exposed to counterparty risk, i.e. the risk of loss from a default of the counterparty.[27] Counterparty risk is mitigated by the basket of assets (collateral) that the ETF holds.[28] Physical ETFs that lend securities from their portfolios also expose their investors to counterparty risk. In this case, investors might suffer losses if a borrower defaults on its obligations.
Large redemptions and negative feedback loops to the counterparty are two important channels through which counterparty risk may affect financial stability. First, similar to standard investment funds,[29] large redemptions as a response to increased counterparty risk would lead to forced selling of collateral securities by the ETF. This is likely to take place in the context of a market downturn as counterparty risk would become relevant in generally stressed market conditions, and may put further downward pressure on already falling asset prices.[30] Second, increased counterparty risk and ensuing redemptions could have feedback loop dynamics for the counterparty itself. For counterparties relying on ETFs as a source of funding, large redemptions may exacerbate the initial stress. Counterparties using the swap or ETF exposure itself as a hedge for their trading positions may be suddenly more exposed to the risks they were aiming to hedge.
Factors related to market structure and investor behaviour may amplify the effects of materialising counterparty risk on financial stability. First, there is a high level of concentration of counterparties of synthetic ETFs in Europe (see Chart C.3). While counterparties are typically connected with many ETFs, most ETFs rely on a single counterparty. In addition, counterparties tend to be connected with ETF issuers through ownership links as they often belong to the same parent bank. Increases in counterparty risk of one of the important institutions in the network would thus directly affect many ETFs. Second, the complex nature of the relationship between ETFs and connected counterparties may not be fully transparent to all investors, creating a potential for sudden changes in the perception of risk. Indeed, as our analysis suggests, investor behaviour with respect to counterparty risk in ETFs seems to be dependent on market conditions (see Box B). Investors tend to be complacent with respect to counterparty risk in normal market conditions and react with sizeable selling (and ensuing redemption) activity when counterparty risk increases in stressed market conditions. This might contribute to amplifying the effects of materialising counterparty risk on financial stability.
Concentration and interconnectedness of synthetic ETFs
(mapping of euro area-domiciled synthetic ETFs (yellow) and their swap counterparties (blue); the grey arcs represent the swap connecting ETFs and their counterparties; the size of the circles represents the number of links within the network)

Sources: ECB and Thomson Reuters Lipper.Notes: The sample contains 968 euro area-domiciled synthetic ETFs active between 2013 and 2017. Data on counterparty relations were obtained from issuers’ public disclosures. The network graph is based on calculations using the Fruchterman-Reingold algorithm allowing for a force-directed layout that assembles ETFs around their counterparties.
In the extreme case of a counterparty default, while ETFs can fall back on collateral assets, investors would face risks associated with the collateral. Both synthetic ETFs and ETFs offering securities lending are typically over-collateralised.[31] Collateral baskets often consist of liquid stocks and bonds. However, frictions may arise when dealing with collateral from defaulting counterparties. To obtain the original exposure, the ETF issuer might have to sell the received collateral in falling markets given that counterparties are more likely to default when markets are stressed.[32] This may be particularly problematic when collateral exposures differ substantially from the exposure expected by investors, for example in terms of correlation with the broader market, or when the value of collateral is positively correlated with the performance of the defaulting counterparty. Similarly, terminating the fund by selling remaining securities could impact asset prices more broadly if the funds that are liquidated are large relative to either the market capitalisation of the funds’ collateral assets or their trading volume.[33]
While incremental financial stability risks posed by counterparty risk in ETFs are small at the current juncture, the risk remains a feature of the ETF market. The current size of synthetic ETFs domiciled in the euro area of around €130 billion in assets is relatively small. Moreover, risks are limited by regulation imposing capital and liquidity requirements on counterparties, as well as counterparty exposure limits and collateral requirements. Margin requirements for OTC derivatives, as well as transparency with respect to securities financing transactions (SFTs), further limit the potential effects of ETF counterparty risk on financial stability. However, while the market share of synthetic ETFs has decreased[34], issuers have switched to physical replication with securities lending which also gives rise to counterparty risk.[35] The ongoing issue that many synthetic ETFs rely on a single derivative counterparty (see Chart C.3) is analogous to ETFs lending securities via a single lending agent. In a similar way, the affiliation with derivative counterparties is an issue that is also present in physical ETFs that employ affiliated lending agents. In addition, connectedness with the banking sector may imply contagion from or to banks in stress periods. Hence, ETF investors continue to be exposed to counterparty risk, which is exacerbated by counterparty concentration, warranting continued monitoring from a financial stability perspective.
Box BEmpirical assessment of the counterparty risk channel
Synthetic ETFs and counterparty risk remain an important feature of the European ETF market. Indicative evidence, as shown in Chart A, points to a potential relationship between variations in counterparty risk and volatility and net outflows from synthetic ETFs. Increases in average credit default swap (CDS) spreads of counterparties associated with synthetic ETFs coincide with net outflows in periods of heightened market-wide volatility (shaded areas in Chart A). This raises the question to what extent are investors aware of the counterparty risk they are taking and whether their sensitivity to counterparty risk changes in stress periods.
Chart A
Net outflows from synthetic ETFs tend to coincide with increased counterparty risk and volatility
(aggregate monthly flows of synthetic ETFs in € billions, VIX index in %, average CDS spread of counterparties in 10 basis point units)
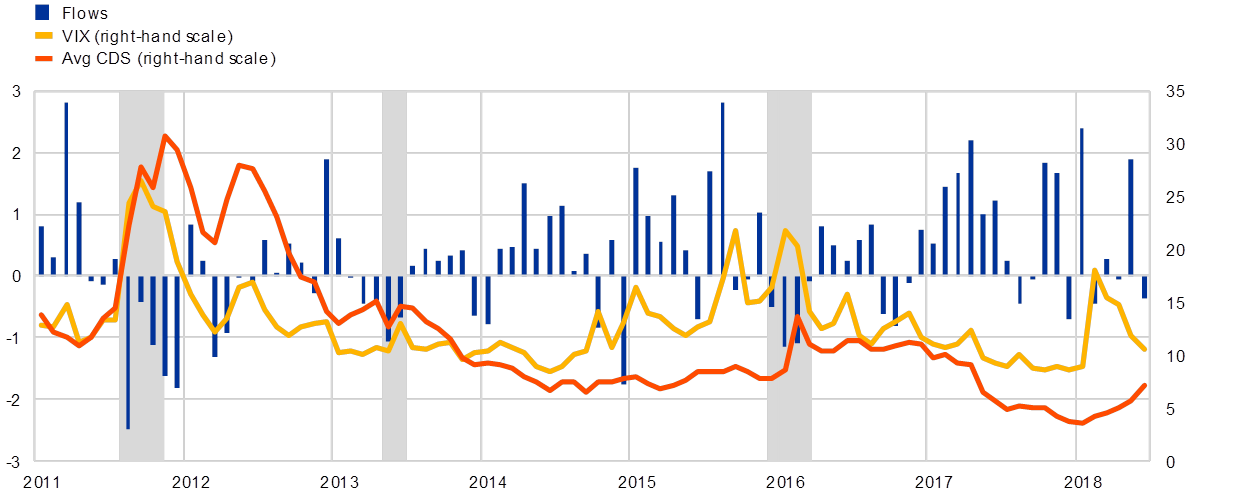
Sources: Bloomberg, Thomson Reuters Lipper and ECB calculations.Note: Shaded areas represent periods in which increases in CDS spreads and the VIX index coincide with net outflows.
To shed light on this question, a panel analysis is conducted which assesses whether ETF investors are sensitive to changes in counterparty risk and whether their sensitivity changes in stressed market conditions. As shown in Equation 2, ETF turnover is regressed on the CDS spreads of the swap counterparties[36], a proxy for counterparty risk, the VIX index, a proxy for market-wide stress, as well as their interaction term, in order to investigate the effects of counterparty risk on investor behaviour in secondary markets (more versus less trading activity).[37] In a second specification, turnover is replaced by flows to gauge the impact on the primary market (inflows versus outflows).
[Equation 2]
[Equation 3]
The fixed-effects model tests for (i) the sensitivity of ETF investors to counterparty risk ( ) and (ii) the marginal effect of volatility on investors’ sensitivity to counterparty risk ( ). The sample contains data for 721 euro area-domiciled synthetic ETFs representing around 90% of the synthetic market segment as at April 2018 between January 2011 and May 2018. Data on ETF-counterparty relations were obtained from issuers’ public disclosures (see also Chart C.3).
Table A
Results of the panel analysis
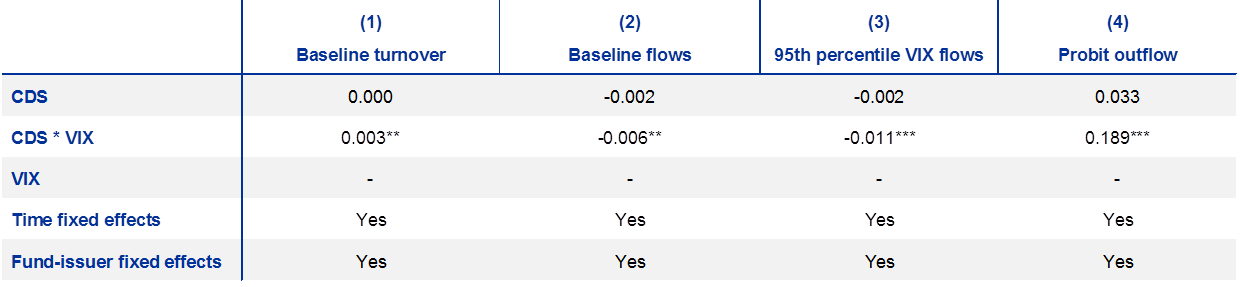
Notes: (1) Baseline specification as in equation 2. Turnover is defined as the log of daily turnover on the ETF’s primary exchange in euro. CDS is defined as the CDS spread associated with the counterparty to the ETF, or an exposure-weighted average in the case of multiple counterparties. VIX is defined as a dummy variable equal to one whenever the VIX index exceeds the 90th percentile of its distribution over the sample period (2011-18). Controls include the ETF’s size, its age in months and NAV returns. (2) Baseline specification as in equation 3. Flows are defined as the log of daily net flows in euro. (3) VIX is defined as a dummy equal to one whenever the VIX index exceeds the 95th percentile of its distribution over the sample period. Specifications (1) to (3) include ETF, issuer and time fixed effects. (4) The dependent variable is a dummy variable equal to one whenever the ETF had a net outflow on a given day. CDS and VIX are defined as dummies equal to one whenever they exceed the 75th percentile of their distributions over the sample period, similar to Hurlin et al. (2017).Significance levels: *** = 0.1%, ** = 1%, * = 5%.
The results shown in Table A indicate that ETFs have the potential to transmit counterparty risk to the wider financial system. In normal market conditions, investors monitor counterparty risk to some extent, while buying and selling is largely balanced and primary market activity is not affected by counterparty risk. In stressed conditions, investors become more sensitive to counterparty risk, generating selling pressures on secondary markets and redemptions on primary markets. Investors’ sensitivity increases with the degree of market stress, indicating procyclical behaviour. Selling pressure in secondary markets triggers sizeable ETF share redemptions in the primary market as the ETF share price deviates from net asset value due to the selling imbalance.[38]
Synthetic ETFs continue to play an important role in the European ETF market. The business model of banks owning ETF issuers and serving as swap counterparties is still predominant. The impact of post-crisis reforms has yet to be fully assessed. However, counterparty risk in synthetic ETFs is a part of the ETF market that warrants continued monitoring from a financial stability perspective. This holds all the more given the evolution of business models and replication strategies, as well as the increasing use of securities lending by ETF issuers involving counterparty risk that could be intermediated and transmitted through ETFs.
4 Implications for regulation
The rapid growth of ETFs, coupled with their potential to transmit and amplify risks to financial stability, warrants further evaluation of regulatory action, in particular from a system-wide perspective. ETFs are projected to continue their fast-paced growth over the next years amid a broader shift towards passive investing and their suitability for digital distribution.[39] ETFs are also increasingly used by high-frequency traders, as well as by institutional investors using ETFs for liquidity management purposes. At the same time, liquidity and counterparty risks in ETFs might have implications for the wider financial system under certain conditions. Indeed, the analysis presented in this special feature identified a few open issues related to liquidity and counterparty risks in ETFs. This raises the question of whether current regulatory frameworks sufficiently deal with the risks posed by ETFs, or whether further regulatory action should be considered.
ETFs are currently regulated by various frameworks that can be considered robust, but that may not sufficiently cater for the specificities of ETFs. As ETFs are both investment funds and tradable securities, they are within the scope of the UCITS Directive and MiFID. These frameworks, however, lack specificity for ETFs as there can be risks originating at the intersection of ETFs as funds and ETFs as securities. For example, the arbitrage mechanism is central to the ETF structure, but its resilience is largely dependent on commercial incentives of the market participants involved. At the same time, the process of share creation and redemption is currently not under regulatory purview. Also, as ETF shares are typically liquid instruments, counterparty risk contained in the ETF may transmit stress more quickly than when contained in a traditional investment fund.
Liquidity and counterparty risks identified in this special feature could be addressed by either enhancing currently applicable frameworks or by developing an ETF-specific regulatory framework. First, the current regulatory frameworks could be enhanced by adding ETF-specific rules. For example, the UCITS Directive, EMIR or the SFT Regulation could be adjusted to account for the potential implications of counterparty risk in ETFs for financial stability. Second, given the specificities of ETFs a dedicated regulatory framework could be envisaged. In the United States, an ETF-specific rule was proposed by the Securities and Exchange Commission in June 2018. In any case, a decision on the appropriate action should take into account whether financial stability risks can be sufficiently addressed.
- [1]Note that the total amount of assets under management is smaller than €660 billion in Chart C.1 due to missing data on replication strategies for some ETFs. Europe is the second largest ETF market after the United States.
- [2]Estimates of the share of ETF turnover in total equity turnover vary widely due to limited data.
- [3]In an industry survey, 56% of respondents indicated that they resorted to ETFs for liquidity management purposes in 2017, compared with 48% in 2016 (see “ETFs: Valuable Versatility in a Newly Volatile Market”, Greenwich Associates, 2018). Another industry survey from 2015 indicates that 56% of respondents accept ETFs as collateral (see “ETFs as collateral – The results”, Securities Lending Times, 2015, p. 4).
- [4]See also “Exchange Traded Funds – Discussion Paper”, Central Bank of Ireland, 2017, pp. 17-26.
- [5]In practice, market-makers often register as APs to obtain direct access to the primary market. In dealing with the ETF, APs may act in a principal capacity or as agents for market-makers and institutional investors. Market-makers may choose to register with stock exchanges as official liquidity providers (OLPs) for certain ETFs or deal in ETF shares voluntarily. Trading venues include stock exchanges, as well as over-the-counter markets.
- [6]In Europe creations and redemptions are predominantly settled in cash, while in the United States most ETFs deal in kind, i.e. APs exchange underlying securities for ETF shares and vice versa. The unique dealing mechanism is cost-efficient for ETF issuers as they deal with a limited number of APs typically trading large blocks of shares. APs are not legally obliged to create and redeem shares, nor do they have a fiduciary duty towards the end-investor.
- [7]The bid price indicates the maximum the market-maker is willing to pay to buy a share, while the ask price is the minimum price that it is accepting to receive in a sale.
- [8]Natural hedging instruments are underlying securities and futures referencing the same index as the ETF. The selection of hedging instruments is often done by algorithms and is based on correlations. Hence, the instruments do not have to bear any obvious relation to the ETF share other than correlation.
- [9]See “Exchange Traded Funds – Discussion Paper”, Central Bank of Ireland, 2017, pp. 22-26.
- [10]See “Institutions Turn to ETFs for Bond Market Liquidity”, Greenwich Associates, 2018.
- [11]“Guidelines on ETFs and other UCITS issues”, European Securities and Markets Authority, ESMA/2014/937, 2014.
- [12]EMIR provisions have yet to be fully phased in which could imply that ETF issuers are still in the process of switching from synthetic to physical replication, leading to a further decline of synthetic market share. On the other hand, intragroup exemptions contained in EMIR could be applicable to synthetic ETFs and thus allow issuers of synthetic ETFs to continue operating without costly margining and imply that synthetic ETFs are likely to maintain a significant market share under current rules.
- [13]In a total return swap, the ETF transfers the cash received through investor inflows to a counterparty for a basket of securities that serves as collateral. The ETF pays the return of the collateral basket to the counterparty and receives the return of the index that the ETF intends to replicate.
- [14]The literature suggests that ETF ownership can exacerbate market volatility, arguing that ownership by US equity index ETFs is associated with higher volatility among component stocks and that the increased volatility is non-fundamental (see Ben-David, I., Franzoni, F. and Moussawi, R., "Do ETFs Increase Volatility?", The Journal of Finance, Vol. 73(6), 2018). While one paper finds that increased ETF ownership is associated with lower liquidity for investment-grade bonds, another study finds that bonds included in ETFs experience improvements in their liquidity (see Dannhauser, C.D., “The impact of innovation: Evidence from corporate bond exchange-traded funds (ETFs)”, Journal of Financial Economics, Vol. 125(3), 2017, and Nam, J., “Market Accessibility, Corporate Bond ETFs, and Liquidity”, Working Paper, Indiana University Bloomington, 2017).
- [15]The European ETF market structurally differs from the US market. For example, redemptions are primarily in cash, in contrast to the US market where redemption mostly takes place in kind. Moreover, synthetic replication is more common in Europe and ETF issuers in Europe tend to be affiliated to banks.
- [16]Liquidity transformation is generally higher in ETFs tracking less liquid underlying securities, for example bond ETFs. See also Turner, G. and Sushko, V., “What risks do exchange-traded funds pose?”, Financial Stability Review, No 22, Banque de France, April 2018, pp. 133-144, and “Die wachsende Bedeutung von Exchange-Traded Funds an den Finanzmärkten”, Monthly Report, Deutsche Bundesbank, October 2018, pp. 83-106.
- [17]For example, following a technology malfunction in August 2012, the trading firm Knight Capital lost USD 440 million and sharply reduced its market-making and AP business in ETFs. As a result, other APs stepped in to take up primary market activity in ETFs previously serviced by Knight Capital. For some less liquid ETFs where Knight was the lead market-maker, bid-ask spreads increased. This event illustrates that the exit of an AP can have repercussions on the ETF it services, and in particular on more illiquid ETFs that might be more affected by frictions in the arbitrage process. Another example was the May 2010 flash crash when ETFs experienced some of the most severe price dislocations and liquidity squeezes because they were being widely used as a hedging instrument by market-makers.
- [18]According to an industry survey in 2014, each ETF has on average 34 AP agreements, while four to five APs are actively trading in the primary market on average (see “The Role and Activities of Authorized Participants of Exchange-Traded Funds”, Investment Company Institute, 2015).There are indications that bond ETFs have a smaller number of market-makers (OLPs) than equity ETFs. 19% of net assets of Euronext Paris-listed ETFs have one market-maker. Two market participants on Euronext account for 57% of the OTC value traded (see “ETFs: characteristics, overview and risk analysis – the case of the French market”, Autorité des marchés financiers, 2017).
- [19]See “Feedback Statement on DP6 – Exchange Traded Funds”, Central Bank of Ireland, 2018, and “Die wachsende Bedeutung von Exchange-Traded Funds an den Finanzmärkten”, Monthly Report, Deutsche Bundesbank, October 2018, pp. 83-106.
- [20]For example, for one of the leading European market-makers in ETFs, the value of ETFs traded was roughly 100 times larger than its balance sheet in 2017. The value traded by this market-maker in European ETFs represented approximately double the total net assets of European-domiciled ETFs.
- [21]The use of high-frequency strategies is not limited to firms trading on their own account.
- [22]See, for example, Cespa, G. and Foucault, T., “Illiquidity contagion and liquidity crashes”, The Review of Financial Studies, Vol. 27(6), 2014.
- [23]According to an industry survey, 80% of the 86 surveyed institutional investors from the United States and Europe indicate that liquidity is among the reasons for investing in bond ETFs (see “Institutions Turn to ETFs for Bond Market Liquidity”, Greenwich Associates, 2018).
- [24]The subscripts used in the equation refer to ETFs (f) and time (t).
- [25]NAV spreads are determined at the end of period t-1 by publication of the NAV by the issuer. During period t, APs send creation and redemption orders to the ETF issuer which are executed after the next NAV fixing at the end of period t. Shares outstanding (in response to variations in the NAV spread at t-1) are hence expected to change between periods t and t+1.
- [26]See Pan, K. and Zeng, Y., “ETF arbitrage under liquidity mismatch”, Working Paper Series, No 59, European Systemic Risk Board, 2017.
- [27]The UCITS Directive defines counterparty risk as “the risk of loss for the UCITS resulting from the fact that the counterparty to a transaction may default on its obligations prior to the final settlement of the transaction’s cash flow” (Commission Directive 2010/43/EU).
- [28]Synthetic ETFs may either own the basket of assets or hold it as collateral from the counterparty.
- [29]See “Policy Recommendations to Address Structural Vulnerabilities from Asset Management Activities”, Financial Stability Board, 2017.
- [30]See Ramaswamy, S., “Market structures and systemic risks of exchange-traded funds”, BIS Working Papers, No 343, Bank for International Settlements, 2011.
- [31]See Aramonte, S., Caglio, C. and Tuzun, T., “Synthetic ETFs”, FEDS Notes, Board of Governors of the Federal Reserve System, 10 August 2017.
- [32]In the case of synthetic ETFs, swaps might have to be replaced which could be challenging in stressed market conditions, especially when ETFs rely on a single counterparty.
- [33]Some ETF issuers use similar collateral baskets across their synthetic ETF product range.
- [34]The market share of synthetic ETFs in Europe has decreased from more than 30% in 2011 to roughly 20% in 2018. In the United States, the market share of synthetic ETFs is lower, at around 2%, also due to the Securities and Exchange Commission effectively prohibiting the issuance of synthetic ETFs in 2010.
- [35]Data on the share of ETFs engaging in securities lending, as well as current and historical on-loan levels for the aggregate market, are not available. A 2011 survey indicates that on-loan levels vary widely. Half of ETFs have, on average, less than 10% of securities on loan at any time, while roughly 25% of ETFs had more than 50% of their portfolio on loan at some point in 2011 (see “Securities Lending in Physical Replication ETFs: A Review of Providers’ Practices”, Morningstar, 2012).
- [36]ETFs were matched with counterparties based on issuers’ public disclosures. In cases where more than one counterparty provide the swap, CDS spreads are an exposure-weighted average.
- [37]The subscripts used in the equation refer to ETFs (f), issuers (i) and time (t).
- [38]This effect is economically large as a one (two) standard deviation increase of CDS spreads amounts to 33 (66) basis points, which implies an outflow of 19.8% (39.6%) of net assets.
- [39]See, for example, “Reshaping around the investor – Global ETF Research 2017”, EY, 2017.