
A macroprudential perspective on replenishing capital buffers
Published as part of the Financial Stability Review, November 2020.
ECB Banking Supervision recently announced that banks will not be required to start replenishing capital buffers before the peak in capital depletion is reached.[2] ECB Banking Supervision has committed to allowing banks to operate below the Pillar 2 guidance (P2G) and the combined buffer requirement (CBR) until at least the end of 2022, without automatically triggering supervisory actions. The exact timeline will be decided following the 2021 EU-wide stress test and, as in every supervisory cycle, on a case-by-case basis according to the individual situation of each bank. In particular, ECB Banking Supervision will look at the profitability of banks and how much capital will be required to replenish the buffer. Taken together, this forward looking supervisory guidance should give banks confidence that they can currently draw on capital buffers to absorb losses and support lending.[3]
Chart A
The effect on lending of restoring capital requirements will depend on both macroeconomic and individual bank conditions
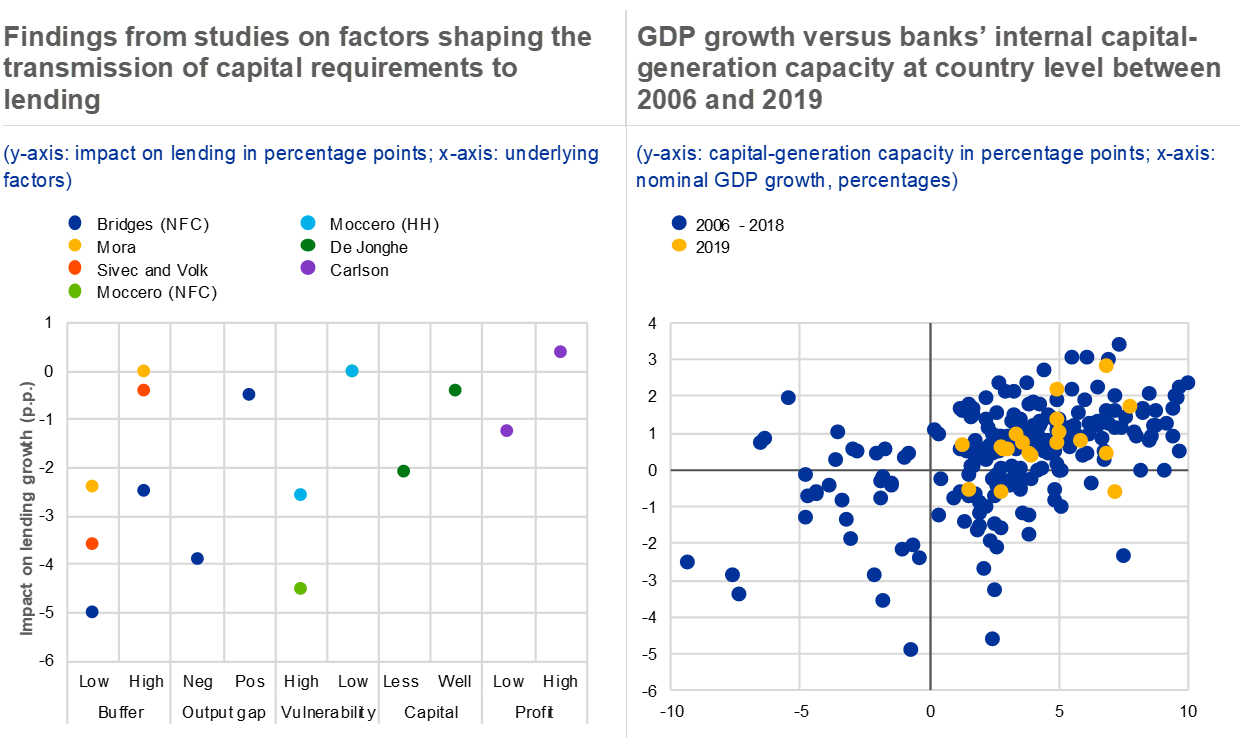
Sources: ECB calculations based on underlying papers, SNL Financial, ECB (Statistical Data Warehouse) and ECB calculations.
Notes: Left panel: the chart reports the impact of a 1 percentage point decline in capital buffers, defined as the difference between the actual capital ratio and the required capital ratio. Studies use different definitions of bank lending and efforts have been made to make the impact comparable across studies. Apart from the output gap and bank vulnerability, the different studies have employed the percentiles of the distribution of the variable in question to classify the variables as low or high (for buffer and profit) and less or well (for capital). Vulnerable banks have above-median expected equity price declines (in percentage points) conditional on a financial crisis. HHs: households; NFCs: non-financial corporations. The studies are the following: Bridges, J., Gregory, D., Nielsen, M., Pezzini, S., Radia, A. and Spaltro, M., “The impact of capital requirements on bank lending”, Working Paper No. 486, Bank of England, January 2014; Mora, N. and Logan, A., “Shocks to bank capital: evidence from uk banks at home and away.” Applied Economics, 44:1103–19, 2012; Sivec, V. and Volk, M., “Bank response to policy related changes in capital requirements”, Bank of Slovenia, Statec/Anec, 2017; De Jonghe, O., Dewachter, H., Ongena, S., ”Bank capital (requirements) and credit supply: Evidence from Pillar 2 decisions”, Journal of Corporate Finance, 60, 101518, 2020; Carlson, M., Shan, H. and Mi. Warusawitharana, “Capital ratios and bank lending: A matched bank approach”, Journal of Financial Intermediation, 22, pp. 663–687, 2013; Moccero, D. and Davidson S., “The Nonlinear Effects of Bank Capital Shocks in Euro Area Countries”, forthcoming. Right panel: internal capital-generation capacity (
) is computed at bank level as:
where
is the bank-level return on assets,
is the average risk weight,
is the growth rate of risk-weighted assets and
is the capital ratio. Risk-weighted asset growth of 4% is assumed to ensure that banks can finance asset expansion in line with a 2% real GDP trend growth rate and 2% inflation. Country aggregates are obtained by aggregating bank-level results. The dots represent a given year for a given euro area country.
More generally, to avoid excessive deleveraging, authorities will carefully consider the timing and speed of bank capital buffer replenishment. Ensuring that buffers are rebuilt in a timely manner enhances the resilience of the banking system. At the same time, rebuilding capital too soon or too fast could weigh on credit supply and the economic recovery, as banks typically reduce lending in response to higher requirements when profits are low, banks are vulnerable, and the output gap is negative (see Chart A, left panel). To inform this discussion, the trade-off between the costs and benefits of replenishment is explored by comparing simulated GDP and lending impacts across different models.
Banks’ capacity to generate capital through profits is key to setting an appropriate timeline for replenishment, as reflected in the communication by ECB Banking Supervision. Internal capital-generation capacity reduces the need for banks to tap capital markets, which is typically more difficult in times of crisis. Historically, the ability of banking sectors in euro area countries to increase capital ratios through retained earnings is linked to GDP growth (see Chart A, right panel) and output gaps.[4] This suggests that the severity and length of the economic downturn impact banks’ ability to rebuild buffers through profits, and should therefore inform their replenishment path.
Model simulations show that replenishing capital buffers too early or too aggressively could be counterproductive and prolong the economic downturn. In order to explore the economic implications of moving too early to restore capital buffers (including P2G), model simulations were conducted using three different macro models[5] with capital constrained banks.[6] For illustrative purposes, four different frontloaded replenishment scenarios were analysed where banks are asked to start restoring buffers either at the end of 2021 or at the end of 2022, with either a one-year phase-in period or a more gradual, two-year phase-in period. If banks were to start replenishing buffers at the end of 2021 and bring them back to pre-crisis levels within one year, or alternatively two years, lending to the non-financial private sector could be around 0.6-0.9% lower than the current ECB central forecast (see Chart B, left panel) and real GDP around 0.3-0.4% lower (see Chart B, right panel). If buffer rebuilding began at the end of 2022 instead, the impact in terms of lower GDP and reduced lending would be somewhat milder, but still worse than current ECB staff projections. The long lags in the transmission of capital increases to the real economy mean that the negative effects on bank lending and real GDP from a more frontloaded replenishment path are likely to persist in the medium term.[7]
Chart B
Replenishing capital buffers too early or too aggressively could prolong the economic downturn

Sources: Model simulations based on Budnik et al. (2020) and Darracq Pariès et al. (2019, 2020).
Notes: The baseline is the central forecast from the September 2020 ECB staff macroeconomic projections. Current ECB forecasts end in the fourth quarter of 2022. The BEAST model was used to generate the macroeconomic projections for the horizon beyond end-2022.
A weaker than expected macroeconomic scenario would warrant a later and more gradual restoration of capital buffers. While the costs of restoring capital buffers to pre-crisis levels are not excessive if the economy moves along the central scenario of the current ECB staff projections, a weaker economic environment would increase bank losses and result in a more extensive use of capital buffers. Model simulations suggest that were economic activity to deteriorate further, the frontloaded restoration of buffers could amplify feedback effects entailing the loss of up to 1% of GDP at the end of 2024 compared to the baseline. In such a scenario, model simulations[8] suggest that buffer replenishment should start towards the end of 2023 or beginning of 2024 at the earliest, with the speed of phasing-in being commensurately slow.
Buffer replenishment should be seen in conjunction with the other policies enacted to mitigate the effects of the pandemic, as well as with prudential mechanisms designed in the pre-COVID-19 environment. One source of uncertainty at the current juncture is that national support policies such as public moratoria and guarantee schemes may be phased out, and what impact this will have on the banking sector and the real economy (see Special Feature A for more details). Furthermore, the design of the optimal replenishment path should also factor in other prudential reforms aimed at strengthening the banking sector’s resilience, such as the supervisory backstop on provisioning expectations[9] and the implementation of the Basel III standards[10] from 1 January 2023.
- With useful input and comments from Markus Behn, Diego Moccero and Giulia Usai.
- See Enria, A., “The coronavirus crisis and ECB Banking Supervision: taking stock and looking ahead”, The Supervision Blog, ECB Banking Supervision, 28 July 2020, and the press release entitled “ECB extends recommendation not to pay dividends until January 2021 and clarifies timeline to restore buffers”, ECB Banking Supervision, 28 July 2020.
- See Chapter 5 of the May 2020 Financial Stability Review for an overview of the mitigating actions taken by prudential authorities in the euro area.
- Econometric analysis reveals that even when GDP growth is positive, a negative output gap is usually associated with lower capital-generation capacity: for the period 2006-19, on average, a 1 percentage point drop in real GDP growth is associated with a 0.16 percentage point drop in internal capital generation capacity, and a 1 percentage point lower output gap with a decrease of 0.15 percentage points.
- The analysis employs three models: (i) a non-linear dynamic stochastic general equilibrium (DSGE) model proposed by Darracq Pariès, M., Kok, C. and Rottner, M. in “Reversal interest rate and macroprudential policy”, Working Paper Series, No 2487, ECB, 2020. For a more concise description of the model, see also Box 1 in the article entitled “Enhancing macroprudential space when interest rates are ‘low for long’”, Macroprudential Bulletin, ECB, October 2020; (ii) the Banking Euro Area Stress Test (BEAST) model described in Budnik et al., “Banking euro area stress test model”, Working Paper Series, No 2469, ECB, September 2020, and Budnik et al., “Macroprudential stress test of the euro area banking system”, Occasional Paper Series, No 226, ECB, 2019; (iii) the DSGE model presented by Darracq Pariès, M., Kok, C. and Rancoita, E. in “Macroprudential policy in a monetary union with cross-border banking”, Working Paper Series, No 2260, ECB, 2019. Moreover, model (iii) has been enhanced with firm- and bank-level satellite models. For more details, see also Special Feature A in this edition of the FSR.
- The simulations take into account the forward-looking losses of banks under the central ECB forecast and the commensurate use of existing capital buffers.
- Thus, the cumulative GDP impact at the end of 2027 of the most frontloaded replenishment path would range between -0.5% and -0.7% compared to the baseline. The BEAST model was used to project macroeconomic developments beyond the 2022 horizon of the current Eurosystem forecasts, which makes it possible to track the effects of buffer replenishment taking into account the longer transmission lags (until 2027).
- Based on Darracq Pariès et al. (2020, ibid).
- See ECB (2019) “Communication on supervisory coverage expectations for NPEs”.
- See “Macroeconomic impact assessment” of the “Basel III reforms: impact study and key recommendations”, EBA, 4 December 2019.