
Causes and implications of variation in euro area banks’ recent loan loss provisioning
Published as part of the Financial Stability Review, November 2020.
Banks’ loan loss provisions increased markedly in early 2020 amid the sharp contraction in economic activity, but there was also large variation across banks’ provisioning. In the first half of 2020, significant banks’ loan loss provisions rose to 0.76% of loans (on an annualised basis), more than 2.5 times the level a year earlier, but still below the peak levels of 1.2-1.4% in earlier economic downturns (2008-09 and 2011-13). Much of the increase was driven by the migration of non-financial corporate (NFC) loans to Stage 2, while the Stage 3 loan ratio remained broadly unchanged[1] (see Chart A, left panel). Provisioning levels were widely dispersed across both countries and banks within the same countries (see Chart A, right panel).
Chart A
Stage 2 migration explains much of the increase in provisions, but with large variation across banks

Sources: ECB supervisory data and ECB calculations.
Notes: Left panel (left): “Other” includes changes due to modifications without derecognition (net), changes due to update in the bank’s estimation methodology (net) and other adjustments. Left panel (right): “Total loans” includes loans to the non-financial private sector, general government and financial institutions. HH: household; S1: Stage 1; S2: Stage 2; S3: Stage 3. Right panel: excludes state-owned promotional/development lenders and one outlier bank.
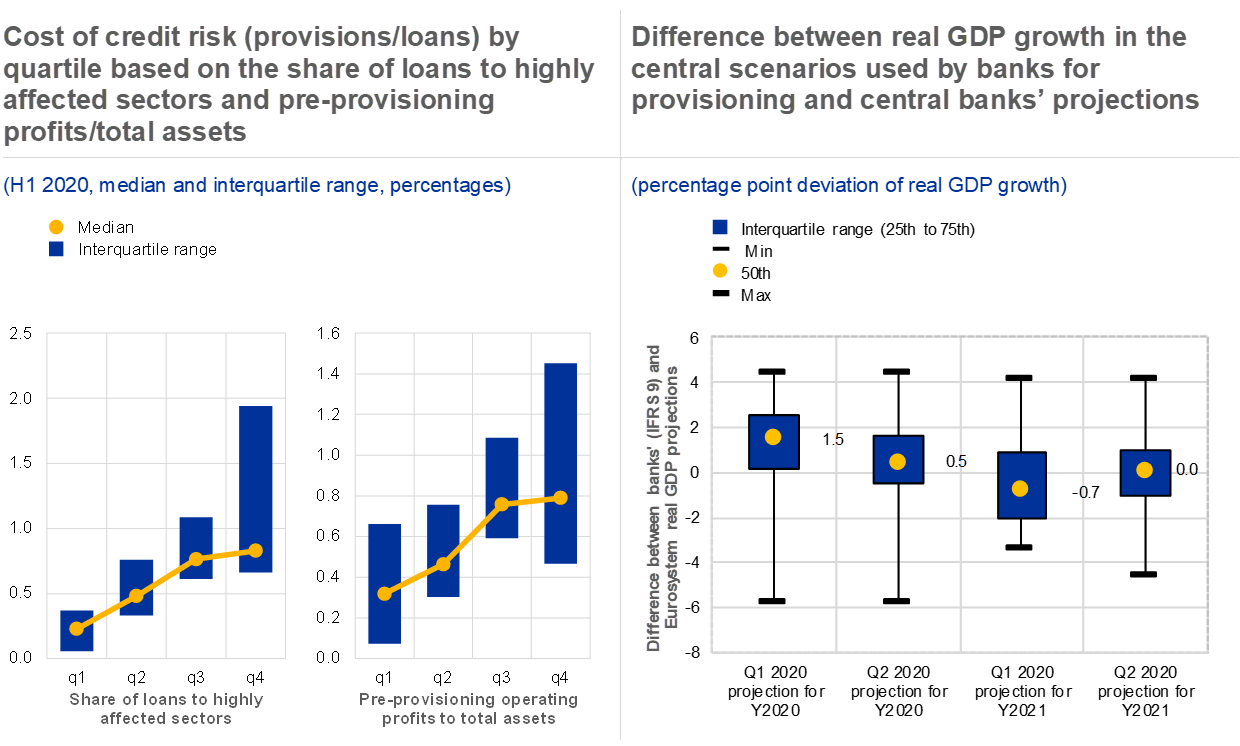
To some extent, the wide dispersion of provisioning levels can be explained by the pronounced economic uncertainty and the heterogeneous sectoral impacts of the COVID-19 crisis. The scale of the economic shock induced by the pandemic, uncertainty around the recovery and difficulties in gauging the impact of government support measures are making it hard for banks to reliably estimate credit losses at present. Divergence in banks’ provisioning may partly reflect differences in portfolio mix for instance in terms of exposures to sectors highly affected by the pandemic[2] (see Chart B, left panel, left chart) or to emerging market economies the diversity of the impact of public support measures for borrowers[3] and differences in the timing[4] of loss recognition. Furthermore, the current transition to the new, more forward-looking IFRS 9 accounting standard,[5] alongside other measures, may also have led to additional variation, although authorities have provided guidance to avoid excessive procyclicality.[6]
Chart B
Differences in exposures to riskier sectors, available pre-provisioning profits and optimism about the economic recovery may partly explain the divergence in provisioning
Sources: ECB supervisory data, ECB calculations and financial statements of the 37 largest banks in the five largest euro area countries.
Note: Left panel: by NACE classification, highly affected sectors include retail and wholesale trade, professional services, manufacturing, construction, accommodation and food services, arts, entertainment and recreation, and transport and storage. The composition of banks in various quartiles differs between the left- and right-hand graphs.
However, it is possible that some of the variation in provisions across banks reflects inadequate provisioning by some banks, in part due to profitability constraints. In general, banks entered the crisis with low profitability, leaving some institutions with limited capacity to use buffers from operating profits to allow for credit losses, possibly making them reluctant to draw on capital. Notably, many (but not all) banks in the weakest pre-provisioning profit quartile tended to have the lowest provisions (see Chart B, left panel, right chart). This relationship may partly reflect the lower risk profile of banks with lower operating profits, but it is also consistent with analysis of historical data (see Chart 7, right panel), which finds that provisions are positively related to pre-provisioning operating profits even after controlling for credit risk.
Varying levels of optimism about the economic recovery also appear to have affected estimates of future credit losses. Financial statement data show diverse levels of optimism in the macroeconomic scenarios used to calculate expected credit losses under IFRS 9 compared with those produced by central banks[7] (see Chart B, right panel), which might affect asset migration and loss coverage. In addition, uncertainty regarding the speed of the recovery affects stage migration, lifetime expected losses, and provisions recorded.[8] The effect of this is also seen in the variation across banks in the development of coverage ratios, with a slight majority of banks (52%) reporting falling coverage of Stage 3 NFC loans in the first half of 2020.[9]
Looking ahead, the future path of credit losses remains very uncertain, in particular when moratoria and other support schemes expire in the first half of 2021. In their public disclosures, most banks indicate that they expect to book lower provisions in the second half of 2020, assuming that the macroeconomic environment does not deteriorate further. However, a weaker than expected economic recovery and, in some cases, optimistic assumptions underlying banks’ expected credit loss models may render current provisioning levels insufficient. In fact, banks’ annualised half-yearly provisions fall short of projected credit risk losses for 2020 under the baseline scenario (see Chart 3.18 in Section 3.2).[10] From a financial stability perspective, it is helpful that euro area banks have generally avoided excessive procyclicality in provisioning, but those with less conservative policies may still need to raise provisioning (and coverage) levels so as to ensure investor trust in asset valuations and transparency in financial statements.
- Stage 2 includes assets that have had a significant increase in credit risk since initial recognition, while Stage 3 includes assets that have objective evidence of impairment at the reporting date. For both Stage 2 and Stage 3 assets, lifetime expected credit losses (ECLs) are recognised.
- A similar exercise using quartiles based on total NFC loans and total household loans and its main components (residential real estate and consumer loans) showed no or only a weak relationship between the share of these loan types and provisioning levels.
- The European Banking Authority (EBA) also clarified that some public policy measures (e.g. moratoria and guarantees) do not imply automatic stage migration. See “Statement on the application of the prudential framework regarding Default, Forbearance and IFRS9 in light of COVID-19 measures”, EBA, 25 March 2020.
- Among the listed banks disclosing cost of risk guidance for 2020, the share of loan loss provisions booked in the first half to those expected for the full-year varied between 40% and 88%.
- See Chapter 5 for more details.
- See “IFRS 9 in the context of the coronavirus (COVID-19) pandemic”, ECB Banking Supervision, 1 April 2020, “FAQS on ECB supervisory measures in reaction to the coronavirus”, ECB Banking Supervision website, and “Statement on the application of the prudential framework regarding Default, Forbearance and IFRS9 in light of COVID-19 measures”, EBA, 25 March 2020.
- In April 2020 ECB Banking Supervision indicated that it would provide significant institutions with central macroeconomic scenarios to be used for IFRS 9 modelling purposes. See “IFRS 9 in the context of the coronavirus (COVID-19) pandemic”, ECB Banking Supervision, 1 April 2020.
- The implementation of IFRS 9 requires a certain degree of judgement to quantify the amount of lifetime provisioning (based on macroeconomic scenarios) and identify when provisions should increase. Migration to Stage 2 (or underperforming) should be triggered by the identification of a significant increase of credit risk, which might be based on the 30 days past due criterion together with other less objective criteria. Migration to Stage 3 (or non-performing) might be triggered by the 90 days past due criterion and the less objective assessment of the unlikeliness to pay.
- Based on supervisory data for a sample of 97 significant institutions.
- In the first half of 2020 impairments (on financial assets) amounted to 6.8% of equity on an annualised basis, compared with projected credit risk losses of 9.9% for 2020 under the baseline scenario.