
Volatility-targeting strategies and the market sell-off
Published as part of Financial Stability Review, May 2020.
Low financial market volatility in the years prior to the coronavirus outbreak increased the popularity of investment strategies based on targeting volatility. Low volatility across major asset classes and regions had been a key feature of global asset price developments until recently.[1] Investments following strategies which are reliant on low market volatility have grown over recent years, with varying estimates. Globally, there may be funds with assets under management worth up to USD 2 trillion invested in some form of volatility strategies[2], with USD 300 billion invested in some 100 risk parity funds, a well-known hedge fund strategy for multi-asset funds. Additional leverage deployed in these funds raises their market-moving capacity.[3]
Volatility-targeting strategies can deploy leverage when market volatility is below target. Funds following volatility-targeting strategies invest in different asset classes with a specific portfolio volatility target, with the possibility to deploy leverage if market volatility and correlations are low. Risk parity strategies have the additional feature that each asset (class) in the portfolio contributes the same risk to the overall portfolio risk.[4] A common feature of these strategies is the procyclical way in which leverage and volatility are linked. Volatility targets allow for higher leverage and thus larger positions in financial assets during periods of low market volatility. Conversely, fund managers have to liquidate leveraged positions when market volatility and cross-asset correlations surge, thereby reinforcing the selling pressure in asset markets.
This box provides model-based estimates of the portfolio shifts experienced by risk parity strategies in the recent market downturn. The findings are based on a daily rebalancing risk parity investment rule applied to a four asset class portfolio with investments in equities, sovereign bonds, as well as investment-grade (IG) and high-yield (HY) corporate bonds. The performance in each of these asset classes is gauged by exchange-traded funds (ETFs) tracking benchmark euro area market indices. The portfolio volatility target is set to an annualised 8% and optimal weights in the four asset classes are determined such that each asset class contributes the same amount of variance to the overall portfolio, in line with the principle of risk parity.
Sharp rise in market volatility and cross-asset correlations of a stylised risk parity fund

Source: Bloomberg.Notes: Volatilities are computed as one-month rolling averages of the ETF return series. The four asset classes are approximated by the returns of the following ETFs: iShares Core EURO STOXX 50, iShares High Yield Corporate Bond, iShares Core EUR Corporate Bond and Xtrackers II Eurozone Government Bond.
A strict risk parity rule would have called for a large unwinding of leveraged bond and equity investments as volatility climbed and diversification benefits vanished. Until mid-March, backward-looking volatility measures in all of the asset classes except equities ranged below the target level amid low levels of cross-asset correlations (see Chart A). This environment allowed risk parity investors to leverage their positions in bonds and equity by up to twice the amount of assets under management (see Chart B, left panel). In March, however, volatility rose sharply across all asset classes. In addition, cross-asset correlations climbed to historically high levels, reflecting a parallel sell-off across all major asset classes and in particular a sharp deterioration in the diversification benefits from holding highly rated sovereign bonds. In sum, portfolio volatility climbed rapidly, requiring risk parity investors to wind down their leverage. According to the stylised model, assets worth nearly 225% of the portfolio’s capital had to be sold in order to meet the volatility target. The new portfolio would have a cash share of nearly 25% as a result. Notably, asset sales would have extended to all asset classes in the portfolio, including the supposedly safer ones. In relative terms, the selling pressure on sovereign and higher-rated corporate bonds would have been less pronounced than in riskier asset classes (notably high-yield corporate bonds) as their relative portfolio share increased. Mirroring the shifts in relative portfolio shares, the riskier asset classes, equity and high-yield bonds, have made a more negative contribution to the recent portfolio performance (see Chart B, right panel).
Stylised model suggests that the spike in market volatility and correlations turned highly leveraged asset allocations into large cash weights
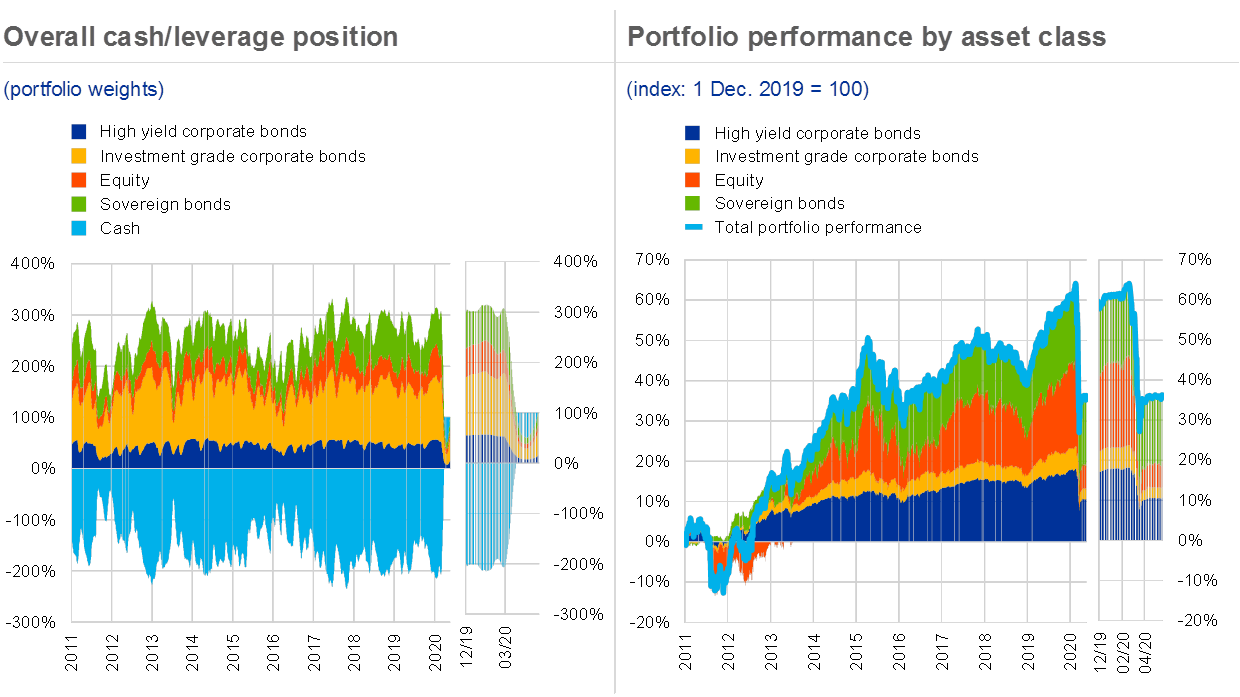
Sources: Bloomberg and ECB calculations.Notes: The relative portfolio weights are adjusted on a daily basis to equalise the risk contribution of the constituent assets of the portfolio considering the daily estimates of portfolio variances and co-variances presented in Chart A. The level of leverage or cash is set in a way to bring the expected portfolio volatility in line with the volatility target, whereby a portfolio volatility below the target allows for additional leverage and a portfolio volatility above the target requires the fund to hold cash.
Risk parity and volatility-targeting strategies may have reinforced the downturn, but their contribution remains hard to quantify. Overall, the findings suggest that risk parity strategies have probably contributed to price movements observed in financial markets during March, both in absolute and relative terms. That said, precise information on the aggregate size, the initial leverage position, the asset allocations and the exact calibration of these strategies, which might include features to mitigate their inherently procyclical character, is lacking. Hence, the extent to which such strategies moved and potentially set in motion downward spirals in asset prices during the recent period of volatility remains uncertain.
- [1]This phenomenon reflected a number of factors, including stable and robust global economic growth, reduced uncertainty surrounding the outlook for growth and inflation, and accommodative monetary policies across the globe. For a detailed discussion of the financial stability risks arising from low market volatility, see Andersson, M., Hermans, L. and Kostka, T., “Higher future financial market volatility: potential triggers and amplifiers”, Financial Stability Review, ECB, November 2017.
- [2]See “End of an era for irrational complacency in markets”, Financial Times, 6 September 2017.
- [3]See Schrimpf, A., Shin, H. S. and Sushko, V., “Leverage and margin spirals in fixed income markets during the Covid-19 crisis”, BIS Bulletin No 2, Bank for International Settlements, April 2020.
- [4]In a more simple form of a low-volatility trade, speculators sell insurance against rising market volatility by taking short positions in volatility futures (e.g. VIX futures). If the implied volatility remains below the futures price, the investor earns the volatility risk premium. If volatility exceeds the futures price, such a position can incur large losses, as experienced during the VIX shock in February 2018.