
Financial stability implications of private equity
Published as part of Financial Stability Review, May 2020.
Private equity (PE) funding, and buyout funds in particular, have grown rapidly as a form of corporate financing in recent years, as the search for yield intensified. The outstanding amount of PE managed by global funds amounted to close to USD 8 trillion in December 2019, of which buyout funds accounted for around a third. Buyout funds have grown faster than any other PE strategy over recent years, even as their managers have diversified their activities. Institutional investors’ demand for access to PE buyout funds has been reflected in increasing rates of oversubscription of buyout funds in the primary market (see Chart A, left panel). This box provides an overview of the main developments in the PE buyout market and assesses potential financial stability risks to both investors in PE funds and the overall financial system.
While buyout funds achieved very high absolute returns in the past, investors in more recent vintages are likely to obtain lower returns. The median buyout fund achieved high absolute returns throughout the business cycle, with a minimum of 8.1% in 2006. The median overperformance with respect to the public benchmark is 4% (see Chart A, right panel).[1] However, these returns are very heterogeneous and 35% of funds still underperform the benchmark, with the fund vintage (the year when the fund was launched) playing a key role. Market exuberance can drive over-optimistic investments that may lead to low returns in the medium term: the worst-performing vintages are those of 2005-06, prior to the onset of the global financial crisis, as they deployed most of their funds at a time when valuations were highest (see Chart B, left panel). Valuations of buyout funds have continued to increase every year since 2013, suggesting an increasing likelihood that recent fund vintages would achieve low and negative absolute returns. That said, the market sell-off in February and March may create opportunities for some of the newest funds while worsening the returns of 2012-13 vintage funds which are currently in their harvesting cycle.[2]
Buyout funds have grown rapidly in recent years, thanks to historically high returns

Sources: Bloomberg and ECB calculations.Notes: The shaded area in the right panel shows the interquartile range. The sample consists of 85,232 private equity deals of 19,472 global private equity funds for the left panel and 2,255 global private equity buyout funds for the right panel, of which 941 had data on the internal rate of return (IRR). The benchmarks, computed for each vintage, show the realised annual total return that would have been achieved by investors if they had invested in customised equity indices of publicly traded corporates that have risk characteristics similar to the fund, i.e. HY corporates with gross debt/EBITDA leverage above 4, and the same weights as the fund in terms of sectoral and geographical exposure. The predicted returns are estimated based on the past relationship between median fund leverage and acquisition prices paid by PE managers for pre-stress vintages (see Chart B, left panel). Pandemic developments will likely increase the dispersion of returns around the median.
Market intelligence suggests that PE-controlled companies issuing leveraged loans had been driving corporate leverage higher and investor protection lower both in the US and Europe.[3] PE managers also control very large shares of high-yield (HY) corporates globally: leveraged loans issued by buyout companies are estimated to account for as much as 80% of the European leveraged loan market and half of the US market. Furthermore, PE-controlled corporates have lower ratings than the HY market, typically single B-rated, reflecting their higher leverage. PE managers have encouraged the market’s shift towards lower investor protection in HY bond and leveraged loan markets in terms of fewer and weaker covenants protecting the debt-holders. These so-called covenant-lite structures increase PE managers’ flexibility in terms of corporate management and cash-flow usage.
In the current stress period, PE funding can provide corporates with a diversified source of financing, but it can also increase some financial stability vulnerabilities. PE funds can support productivity by driving out inefficient management and companies, and by allocating more capital to higher growth industries. Moreover, PE managers can use excess liquidity, the so-called “dry powder” that is currently estimated to amount to around USD 1 trillion globally for buyout funds, to provide financing during downturns, which both increases the fund returns and has a countercyclical effect. But buyout activities can also have a negative impact on financial stability. First, while higher financial leverage increases returns to PE investors, it also leads to decreased investments in downturns, thus amplifying recessions.[4] Second, higher leverage increases corporates’ probability of default (see Chart B, right panel), and will likely lead to lower recovery rates.[5] The fallout from the coronavirus pandemic increases the default risk in buyout funds’ portfolios further. There is a conflict of interest between PE sponsors, who seek to maximise their returns on equity, and debt-holders, who seek repayment. PE sponsors are likely to have fewer incentives than strategic investors to support companies in difficult times and are also likely to extract higher concessions from debt-holders when providing support to their companies. Finally, the high concentration of PE ownership in the hands of only a few large and global managers may exacerbate these risks.[6]
Buyout funds have paid higher values for acquired companies and tend to leverage their targets, which increases companies’ default risks
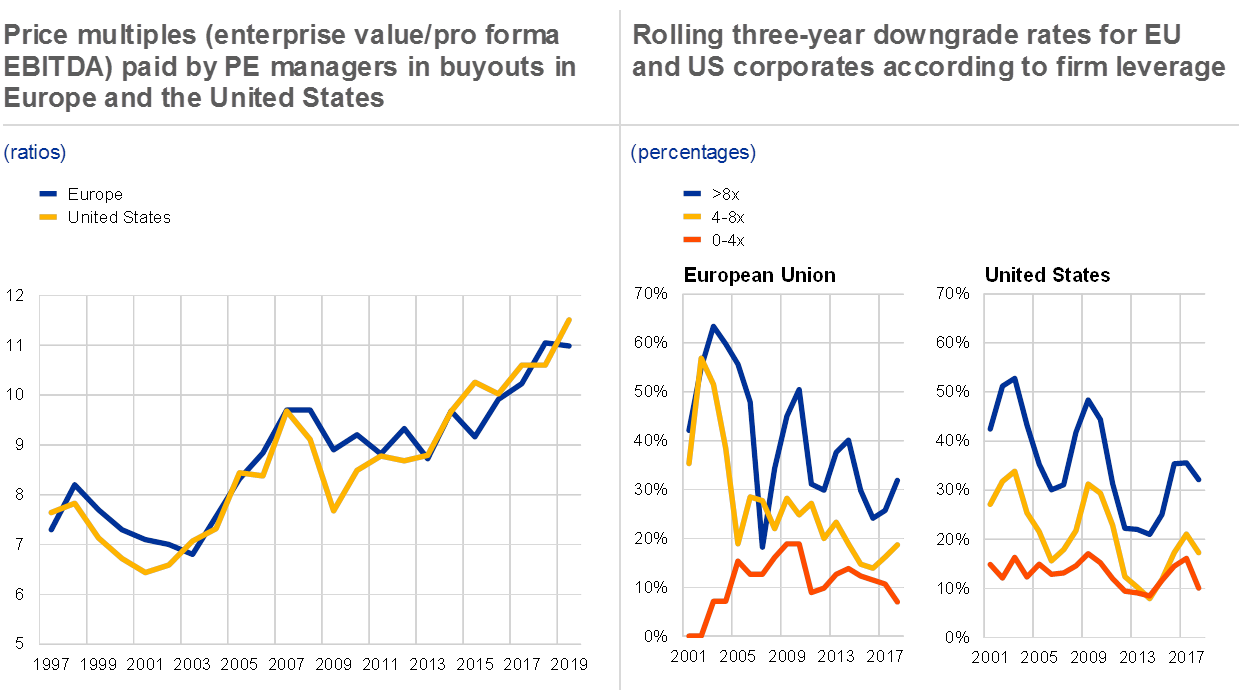
Sources: Bloomberg, Capital IQ, S&P LCD and ECB calculations.Notes: In the right panel, the downgrade rates shown are cumulative over three years and capture downgrades that bring the rating at least one full step lower, for example from BB to B or lower. Leverage is computed as gross debt/EBITDA, with the lines showing cumulative downgrade rates for companies with a certain gross leverage range. The sample comprises public and private companies that provide financial information.
- [1]The returns are based on publicly available data disclosed by US pension funds investing in PE funds. These investments may therefore not be representative of the overall buyout fund returns.
- [2]Estimates are generally consistent with industry reports. See, for example, “How a COVID-19 Recession Is Likely to Affect Buyout Performance”, Preqin, 31 March 2020.
- [3]See “LBO credit quality is weak, bodes ill for the next downturn”, Moody’s, 18 October 2018.
- [4]See Kalemli-Özcan, S., Laeven, L. and Moreno, D., “Debt overhang, rollover risk, and corporate investment: evidence from the European crisis”, Working Paper Series, No 2241, ECB, February 2019.
- [5]Leverage plays a central role in standard credit risk models used in academia and in the financial industry. Recently, the relationship between leverage and default risk has been investigated in Cathcart, L., Dufour, A., Rossi, L. and Varotto, S., “The differential impact of leverage on the default risk of small and large firms”, Journal of Corporate Finance, Vol. 60, February 2020, and Traczynski, J., “Firm Default Prediction: A Bayesian Model-Averaging Approach”, Journal of Financial and Quantitative Analysis, Vol. 52(3), June 2017, pp. 1211-1245.
- [6]The top 6 (16) PE buyout managers control 30% (50%) of corporate investments by value globally. See also “Largest PE firms will outperform smaller players in a downturn”, Moody’s, 7 May 2019.