
Financial Integration and Structure in the Euro Area, April 2022
This is the second edition of the European Central Bank’s biennial report on financial integration and structure in the euro area. As explained in greater detail in the preface to the first edition in March 2020,[1] it is designed to focus on structural developments in the financial system of the euro area, and in some cases also of the European Union (EU), and related policy issues. In so doing, it covers developments in financial integration across member countries, changes in financial structure (the mixture of financial markets and intermediaries) and financial development or modernisation (for example through innovations in the financial system). Definitions of these three concepts and how they link to Eurosystem tasks and functions were provided in more detail in the 2020 preface.
The findings of this report may touch upon issues relevant for the policy discussion related to the European banking union (BU), the European capital markets union (CMU) and thereby on the financial aspects of deepening Economic and Monetary Union (EMU).
The report has been streamlined in two ways compared with the previous issue: by focusing on the main trends in financial integration, structure and development, and by replacing special feature articles with more concise boxes. The topics covered by the five boxes are the following:
- Making euro area equity markets fit for green and digital innovation;
- Measuring market-based and non-bank financing of non-financial corporations in the euro area;
- Frictions in debt issuance procedures and home bias in the euro area;
- Home bias in green bond markets;
- A deep dive into capital risk sharing in the euro area – inter- versus intra-regional risk sharing.
The standard set of indicators of financial integration and structure and their descriptions are included in an online Statistical Annex.
The report does not cover the implications of Russia’s military attack on Ukraine for the euro area or the EU financial system, as the data cut-off date was 11 February 2022.
Key messages
1 Overall assessment of financial structure and integration
The surveillance parts of this report cover developments in euro area financial structure, in terms of both financing instruments and financial intermediaries, as well as in euro area financial integration during the COVID pandemic period. The economic and financial implications of the COVID-19 pandemic as well as the sizeable policy responses dominated most of the two-year reporting period of this report. There were, however, also a number of previous features and trends in financial structure and integration that continued or evolved differently during the last two years. The surveillance parts of the report – summarised in this section – describe the most important patterns in both regards. They consider aggregate and sectoral developments for different financing instruments (liability perspective) and for different financial intermediaries (notably from an asset perspective). They also review the integration of financial markets across member states and its resilience as well as assess risk sharing across member states.
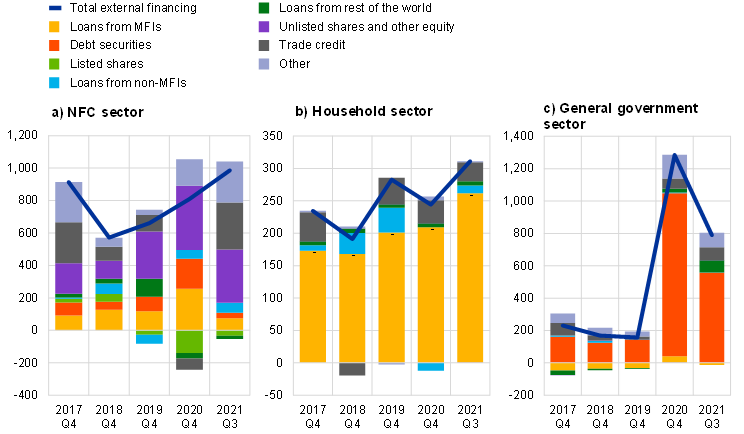
Thanks to a decisive set of policy responses the financing of euro area firms and households held up during the pandemic crisis, although this required a significant increase in public debt. As seen in Chart 1.1, aggregate external financing of both non-financial corporations (NFCs, left-hand panel) and households (middle panel) broadly held up in the euro area during the pandemic (blue lines in 2020 and 2021 compared to the years before). But this was only possible thanks to the fast and formidable policy support and actions that fiscal authorities, the Eurosystem and prudential authorities and bodies undertook in response to the pandemic. For example, the right-hand panel of Chart 1.1 visualises this in terms of the multiplication of public debt issuance necessary to finance measures supporting firms and households. The speed and decisiveness of the action clearly benefited from the experiences with the financial crisis and the sovereign debt crisis a decade earlier and subsequent reforms.
Chart 1.1
External financing of euro area NFCs, households, and general governments by instrument
(flows; four-quarter sums; EUR billions, Q4 for 2017 -2020; Q3 for 2021)
Sources: ECB (euro area accounts) and ECB calculations.
Notes: MFI stands for Monetary and Financial Institutions. Non-MFIs include other financial institutions (OFIs) as well as insurance corporations and pension funds (ICPFs). "Other" is the difference between the total and the instruments included in the figure and includes inter-company loans and the rebalancing between non-financial and financial accounts data. Figures shown represent the sum of flows over the last four quarters at the end of Q4 for 2017 to 2020 and of Q3 for 2021.
In addition to fiscal support and guarantees, another factor helping non-financial corporations to stabilise was a fast change in their financing mix towards bank credit lines and corporate debt issuance, as also facilitated by various monetary policy measures. While total NFC financing held up overall, the pandemic triggered large swings in its composition. Notably, in 2020 trade credit and public equity issuance dried up (grey and green blocks in Chart 1.1), because of the great uncertainty about the viability of firms during lockdowns early in the crisis and a rush towards liquidity (“dash for cash”). At the same time, NFCs resorted more to debt financing, both through bank loans and through corporate debt securities (yellow and red blocks). Robustified by regulatory reforms decided after the Great Financial Crisis and supported by special ECB liquidity operations, banks were able to let firms draw elastically on their credit lines. In addition, much enhanced corporate bond purchases by the ECB through its Pandemic Emergency Purchase Programme (PEPP) made corporate issuance attractive.
Multiple support to companies was all the more important as the corporate sector could be regarded as the economic epicentre of the COVID crisis. The initially necessary social distancing and lockdowns very much limited the operations of firms in important sectors, constraining the employment of people earning wages, investment and the production, distribution and sale of goods and services. Therefore, the risks spread within the corporate sector and from there to supporting governments, financial intermediaries and consumers. One challenge for the future will be how the pandemic legacy of corporate debt will be resolved, including through the functioning of insolvency frameworks.
The trend towards non-bank financial intermediation continued, with an especially strong growth of investments funds, in particular for equity funds, despite some initial stresses in some segments of the fund sector. Turning from the perspective of financing instruments to the one of financial intermediaries, a trend that existed at least since the Great Financial Crisis is the growth of non-bank financial intermediaries in the euro area. For example, the share of non-banks in the provision of credit to NFCs grew from around 15 per cent at the time of the Great Financial Crisis to almost 30 per cent in 2021 (see panel b of Chart A in Box 2 of this report). A particularly strongly growing type of non-bank intermediary during the last two years were investment funds (green line in panel a of Chart 1.2), notably driven by equity funds (blue line). This reflected not only valuation effects on the back of strong fiscal support and monetary policy measures but also high inflows over a number of quarters. Apart from the low interest rate environment, the enhanced interest in portfolio equity investment may have been driven by the strong performance of stock markets until the cut-off date of this report. Finally, as of late also insurance corporations and pension funds increased their equity holdings, partly through the purchase of investment funds (Chart 9 in the main chapter of the report).
Chart 1.2
Developments in euro area investment funds
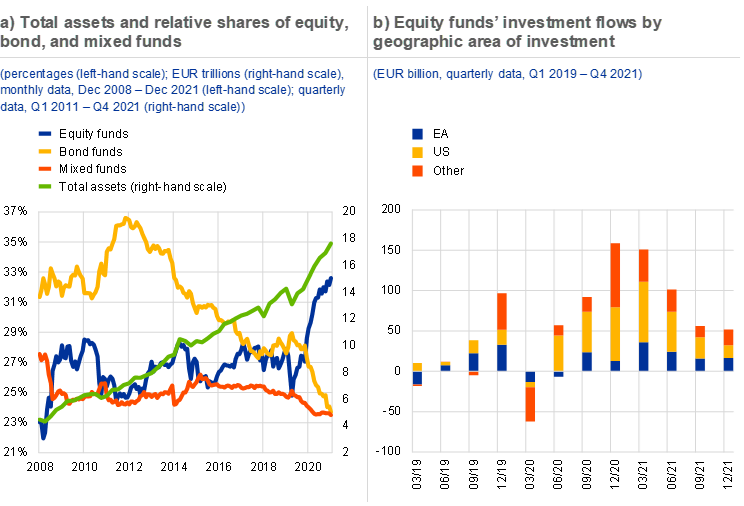
Sources: ECB (investment fund balance sheet statistics).
Notes: Panel b: "Other" refers to all equity transactions of euro area equity funds with counterpart area other than EA and US.
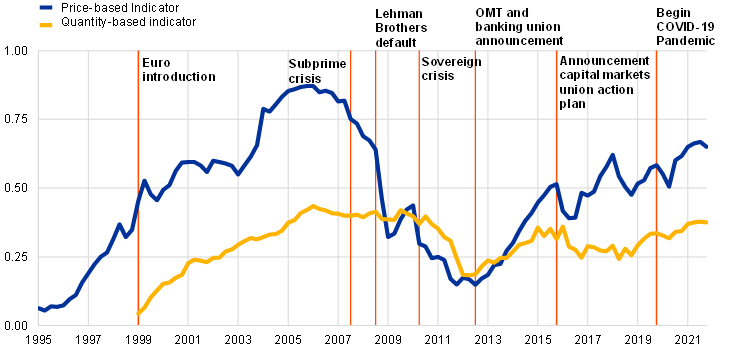
Contrary to previous major crises, a material decrease in euro area financial integration induced by the beginning of the pandemic – and more pronounced in prices than in quantities – stopped and reversed relatively quickly. Turning to euro area financial integration, Chart 1.3 shows the ECB’s two composite indicators that provide an aggregate picture of integration across the main market segments (money, bond, equity and banking markets) in terms of prices (blue line) and quantities (yellow line) since the start of the euro. The price-based indicator suggests that the moderated and volatile recovery of integration after the Great Financial Crisis and the European Sovereign Debt Crisis reported in the 2020 report was still intact until the cut-off date. Quantity-based integration (capturing cross-border bond holdings, equity holdings and interbank lending), however, moved broadly sideways for a number of years and only recovered somewhat more recently. The levels of integration measured with the latest data now compare to those of the mid-2000s, i.e. a few years before the financial crisis. Most importantly, the adverse effects of the COVID crisis on financial integration, while material in particular in terms of cross-border price divergences, seem to have been relatively short-lived both in prices and in quantities.
Chart 1.3
Price-based and quantity-based financial integration composite indicators
(quarterly data; price-based indicator: Q1 1995 – Q4 2021; quantity-based indicator: Q1 1999 – Q4 2021)
Source: ECB and ECB calculations.
Notes: The price-based composite indicator aggregates ten indicators for money, bond, equity and retail banking markets, the quantity-based composite indicator aggregates five indicators for the same market segments except retail banking. The indicators are bounded between zero (full fragmentation) and one (full integration). Increases in the indicators signal greater financial integration. From January 2018 onwards the behaviour of the price-based indicator may have changed due to the transition from EONIA to €STR interest rates in the money market component. OMT stands for Outright Monetary Transactions. For a detailed description of the indicators and their input data, see the Statistical Web Annex to this report and Hoffmann, P., Kremer, M. and Zaharia, S. (2019), Financial integration in Europe through the lens of composite indicators, Working Paper Series, No 2319, ECB, September.
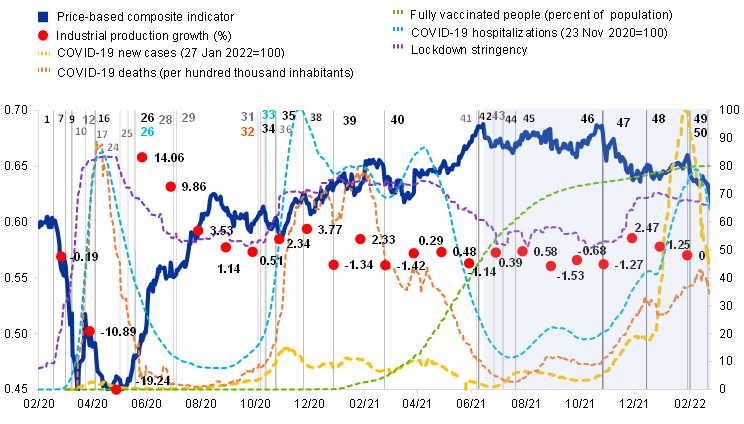
The most influential policy measures that first contained re-fragmentation in the euro area and then brought it back to pre-pandemic levels were first a prompt series of ECB monetary policy measures and then, decisively, the EU agreement about a very sizeable COVID recovery fund. To analyse in greater depth what happened with integration during the pandemic crisis, Chart 1.4 zooms in on the period February 2020 to February 2022. This is only possible with a high-frequency version of the price-based composite indicator (blue line), which is complemented with information about the severity of the crisis (various dashed lines), economic activity (red dots) and important events and policy actions (numbered and colour coded vertical lines). The chart first confirms the sharp re-fragmentation (and economic contraction) triggered by the first COVID wave and severe lockdown measures. Initial policy measures – including notably the ECB’s PEPP (e.g. events 7, 9 and 16) – were able to contain this development but not sustainably reverse it yet. Only when the two key proposals for a sizeable European recovery fund (events 24 and 25) combined with a number of other measures and developments a sustainable re-integration was set in motion. These other developments included particularly the previous adoption of three European safety nets for businesses, jobs and workers (event 17), the easing of the first virus wave (dashed orange and violet lines) and a sharp economic recovery. Thereafter, following also an expansion of the PEPP (event 26) and the European Council’s agreement on the NextGenerationEU recovery fund financed through the joint issuance of debt (events 28 and 29), the price-based composite ultimately reached pre-pandemic levels.
Chart 1.4
Euro area price-based financial integration, COVID-19 pandemic developments and events
(daily data, 3 February 2020 – 23 February 2022)
Sources: Price-based composite indicator and industrial production: ECB and ECB calculations; COVID-19 deaths, fully vaccinated people, and lockdown stringency index: Our World in Data.
Notes: The price-based composite indicator of financial integration is a high-frequency version (daily readings) of the one by Hoffmann et al. (2019), described in Borgioli et al. (2020). The indicator is calibrated to vary between 0 and 1. The COVID-19 deaths data series are measured as seven day moving averages. Fully vaccinated is the share relative total population. Industrial production growth (excluding construction) is measured as growth rate to the previous month. Lockdown stringency varies between 0 and 100 (100 = strictest) and is computed as an average of the COVID-19 stringency indexes of all euro area countries, weighted by their 2019 real GDP. It is based on nine response indicators including school closures, workplace closures, and travel bans. PEPP stands for Pandemic Emergency Purchase Programme and SURE for Support to mitigate Unemployment Risks in an Emergency. The chart distinguishes between four phases of the crisis, indicated by the grey and light blue shaded areas. The first captures the first infection wave, with drastic lockdowns and a severe economic downturn (mid-February to early May 2020). The second phase covers the stark economic rebound when infections had returned to low levels and member countries partly opened up again (early May to mid/late-August 2020). The third phase spans the severe return of infections in three more waves with, however, more targeted lockdowns and a more resilient economy than during the first phase (mid/late-August 2020 to end May 2021). The fourth phase is characterized by a combination of the rise in the number of COVID-19 new cases (including Delta and Omicron variants) together with the low number of deaths, high vaccination rates, and more resilience of financial integration (since June 2021 until February 2022).
Vertical lines and their numbers mark selected significant events (colours refer to country events – Italy red, Spain dark blue, Germany light blue – or events with euro area wide relevance – fiscal light brown, monetary policy and other black):
1. Closure of Italian schools and universities (4 March 2020), 7. ECB PEPP announcement (18 March), 9. PEPP legal documentation published (25 March 2020), 10. Third European Council with divergent views on coronabonds (26 March 2020), 12. Eurogroup agreement on comprehensive policy response (9 April 2020), 16. ECB collateral rating freeze (22 April), 17. Fourth European Council with endorsement of Eurogroup’s comprehensive policy response and plans for recovery fund (23 April), 24. Franco-German EUR 500 bn. European recovery fund proposal (18 May 2020), 25. European Commission EUR 750 bn. “NextGenerationEU” recovery instrument proposal (27 May 2020), 26./26. ECB PEPP expansion and Germany announces major fiscal stimulus package (4 June 2020), 28. Start of special European Council on recovery fund (17 July 2020), 29. End of special European Council on recovery fund with final agreement on size and structure (21 July 2020), 31. First issuance of EU Commission SURE bonds (21 October), 32. S&P upgraded the outlook on the Italian sovereign bond rating from negative to stable (23 October 2020), 33. Germany adopts toughest health restrictions since first lockdown (28 October 2020), 34. ECB hints at December monetary policy stimulus (29 October 2020), 35. BioNTech/Pfizer vaccine announcement (9 November 2020), 36.Second issuance of EU Commission SURE bonds (10 November 2020), 38. ECB expands PEPP envelope and announces to “preserve favourable financing conditions” (10 December 2020), 39. Announcement of US economic relief package (15 January 2021), 40. ECB temporarily increases PEPP purchases (11 March 2021), 41. Commission successfully placed 800 billion euros of bonds, "NextGenerationEU" (8 June 2021), 42. European Union countries agreed on an easing of travel restrictions over summer (11 June 2021), 43. EU hands out first payments from COVID-19 recovery fund, "NextGenerationEU" (28 June 2021), 44. ECB reformulates inflation goal to 2%, allows overshoot (8 July 2021), 45. ECB extends forward guidance on rates (22 July 2021), 46. ECB Governing Council (28 October 2021). 47. Inflation in the euro area is estimated at 4.1% in October (29 October 2021), 48. Governing Council meeting (16 December 2021), 49. Euro area GDP rose by 0.3% on quarter in the last three months of 2021, slightly less than predicted, after a sharp contraction in Germany's output (31 January 2022), 50. Governing Council follow up from December meeting announcing a gradual reduction of asset purchases and termination of PEPP net asset purchases (3 February 2022). Omitted numbers are relevant events suppressed for readability.
Once pre-pandemic levels were reached again, measured financial integration gradually further increased and remained resilient to further COVID waves. Following the establishment of the comprehensive set of national and European fiscal, monetary and prudential policy instruments, Chart 1.4 clearly shows how euro area financial integration remained resilient to the later waves of the coronavirus and its variants, as also national lockdown measures become less severe and eventually vaccinations picked up (dashed green line). If anything, integration further increased in the following quarters. The experience overall illustrates, among other things, how powerful aligned monetary and fiscal policies can be in stabilising financial markets specifically and the euro area more generally during a crisis.
As flagged in the 2020 report, however, the resilience of integration to large shocks needs to be continuously monitored. For example, while the ratio of intra-euro area foreign equity investments relative to foreign debt investments has somewhat recovered during the pandemic (Chart 18 in the main chapter of the report), the ratio of intra-euro area foreign direct investment relative to combined FDI and portfolio equity investments continued to decline (Chart 19 in the main body). The former should increase the resilience of financial integration and the latter decrease it.
Measured quantity-based integration of the European Union green bond market may gradually decrease over time, from an initial high level, as all member states develop local bond supply and domestic investors have local alternatives (“home bias” effect). A particularly highly integrated European market is the relatively new market for green bonds. Box 4 of the report, however, finds that the limited investor home bias in this market (member countries’ investors holding a relatively large share of green bonds issued in other euro area countries) may have to do with the local underdevelopment of this market in some member countries. As soon as the domestic market develops and there is a greater local supply of green bonds, investors from these countries tend to reduce their foreign holdings to buy more domestically issued bonds and the green home bias increases, as a consequence. Although this process seems to be quite gradual, it may lead to a reduction of quantity-based integration measured in this market over time.
The nature of the COVID crisis very much restricted private consumption risk sharing across euro area countries, limiting one of the benefits of financial integration and development. An important economic benefit expected from financial integration and development in the euro area is risk sharing across member countries. The associated financial flows are expected to help households to better stabilise income and consumption in the face of shocks. While estimates suggest that income risk sharing has been relatively stable over the last years and the pandemic – in contrast to the Great Financial Crisis and the European Sovereign Debt Crisis –, it also remains at relatively low levels (Chart 23 in the main body of the report). At the same time, the nature of the COVID crisis restricted key private channels for consumption risk sharing, since public health measures, mobility restrictions and production constraints limited households in consuming their regular consumption baskets. Given the long data windows with which consumption risk sharing needs to be estimated, the measured moderate recovery – driven much by the credit channel but starting from a relatively low level – is still likely to be related to the resolution of the previous crises (Chart 24 in the main body). Box 5 of the report presents a historical analysis of the capital channel of risk sharing and confirms the relatively moderate contribution of this channel for the years following the European twin crises. Distinguishing a region of Northern euro area countries and a region of Southern euro area countries, it also finds that most of the capital channel operates within those regions rather than across them and that the inter-regional capital channel is particularly weak for the South.
The major fiscal initiatives at the EU level, such as the NextGenerationEU recovery programme and the three safety nets for business, jobs and workers, were key for ensuring risk sharing among member countries and for compensating for the hampered private financial channels. Given the nature and severity of the COVID crisis, it was therefore critical that the hampered private risk sharing channels were swiftly complemented with fiscal channels. This was all the more important, as the European Economic and Monetary Union does not include a fiscal union and therefore the fiscal risk sharing channel in the euro area is typically estimated as very small (Chart 24 in the main body). Sizeable fiscal risk sharing mechanisms were established with the three EU safety nets for businesses, jobs and workers and, notably, the NextGenerationEU pandemic recovery programme. From 2021 to 2026 NGEU can mobilise funds in the order of 6 per cent of EU GDP, with a significant annual volume of debt issuance at the European level. A large share of the NGEU grants and loans will be distributed to the countries most affected by the pandemic. Moreover, due to the joint backing of debt by all EU member states loans can be made available at favourable conditions. Pay-outs have started towards the end of 2021 and about a third of NGEU funds are expected to be used by the end of 2022. All this brings fiscal risk sharing in the EU to another level for a number of years, as the programme is designed to be temporary. But the success of the associated investments and reforms is expected to have a significant impact on the future debate on fiscal integration in the EU.
2 Selected policy issues for financial structure and integration
Completing the Banking Union and making material progress with the Capital Markets Union are key to enhance the integration and resilience of the financial sector and help Europe's post-COVID recovery. The description and assessments of financial integration and financial structure trends in the euro area and the EU in the previous section illustrate that there remain significant challenges ahead. Both as a consequence of the pandemic and as a consequence of otherwise existing trends. With the Banking Union (BU) and the Capital Markets Union (CMU) the EU has two interrelated projects under which many are already tackled, or new ones can be addressed going forward. A strong and integrated EU financial sector is essential to the EU’s post-recovery ambitions and requires a robust BU as well as an ambitiously deepened CMU, including in its green dimensions. The BU has come a long way since 2012, but further progress needs to be made on key missing elements, such as improving the crisis management framework or setting up a European deposit insurance scheme, and to ultimately complete the project. This would enable banks to conduct their business across the banking union without being hampered by national borders, allowing financing to reach the most promising projects. It would also make the banking sector more resilient. At the same time, the EU needs to urgently strengthen its financial markets beyond the banking segment. More developed and integrated capital markets would allow companies to diversify their funding sources, help mobilise investment across the Union and contribute to overall financial resilience, provided that the resilience of the non-bank financial sector is also strengthened so that it provides robust financing to companies in both normal and stressed market conditions.[2] Thus, the ECB welcomes the objectives of the European Commission’s second CMU action plan of September 2020 to achieve better access to finance for companies, make it safer for individuals to invest their savings and to better integrate EU capital markets. It supports the full and swift implementation of the envisaged reforms, including the proposals of November 2021[3] as well as outstanding actions such as on withholding tax and supervisory convergence. Alongside the advancement of the EU’s sustainable finance framework, these actions will also contribute to building a green CMU with sizeable, mature and integrated green capital markets.[4] The ECB also notes that more needs to be done to complete the single market for investment funds with more widespread cross-border distribution, because this promises to give investors more choice, reduce costs and fees, as recently also noted in a report by the European Court of Auditors (ECA).[5] Assessing the suitability of the regulatory framework, the ECA report highlights a lack of adequate and reliable data to mitigate risk to financial stability as a key concern and calls for strengthening ESMA’s role as a supervisor.
Selected areas discussed in the main body of this report that need enhanced policy efforts include equity markets, debt issuance procedures and bank consolidation. This section highlights a small number of policy considerations that emerge from the analysis presented in this report and go beyond the work already going on under the BU and CMU, at least in some dimensions. They touch on the role of more dynamic and integrated equity markets for financing European innovation, on better integrating European debt issuance procedures and on the need for further European bank consolidation.
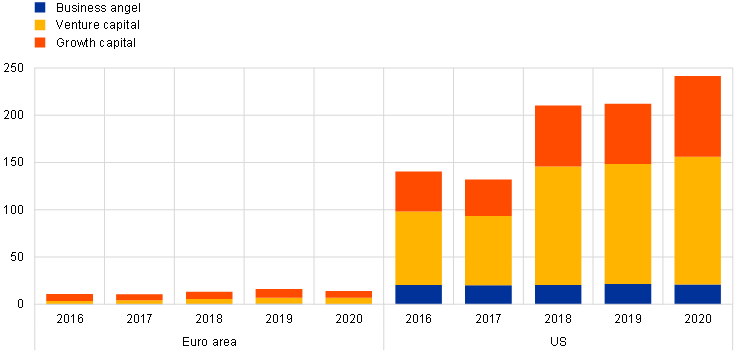
The NextGenerationEU recovery and public investment programme provides a unique historical opportunity to bring private risk capital markets in the euro area and EU to similar levels as is the case for other major economies. This way, private and public forces together ensure enough innovation and prepare the ground for financing the green, digital and other technological transformations. The green and digital transformations require sizeable investments for achieving the necessary technological and commercial innovations. If anything, the COVID pandemic and recent geopolitical events have further underlined the need to accelerate the EU’s twin transition. The European Commission has estimated that the average additional investment effort until 2030 to meet the EU’s current green and digital ambitions amounts to €650 billion per year across the EU. While public investments under NGEU and its significant share in green and digital investments will mean material progress, the required efforts will not be possible without also very substantial private investment. The research literature clearly suggests that public and private equity markets are much more suitable for providing the necessary funding for relatively risky innovation-orientation investment than bank lending. Yet, the relevant equity market segments in the euro area are significantly smaller and less integrated compared to other major advanced economies, even though European risk capital markets have grown well during the last few years.[6] For example, Chart 2.1 compares the size of risk capital markets in the euro area and the United States. A particular bottleneck seems to be the small size of European venture capital funds and a resulting lack of large funding rounds, which particularly hamper successful companies with high growth potential to scale up further. Moreover, public equity markets as the exit option for growing firms are also very much smaller in the euro area than in the US (Chart A, panel a) in Box 1 of the report).
The implementation of the 2020 CMU action plan can produce some tangible progress in the development and integration of European equity markets. As detailed in Box 1, For example, the creation of a European Single Access Point (ESAP), a digital platform for harmonised company information, including sustainability-related information and open to small and medium-size enterprises (SMEs), as proposed by the Commission last November, can help to connect investors and companies. Moreover, the ongoing review of EU fund and insurance regulation envisages to facilitate institutional investors’ investments in green or other innovative projects. Additional measures under the Action Plan are forthcoming. The planned review of EU public listing rules should proceed swiftly to make listing easier for SMEs, including the set-up of an SME Initial Public Offering (IPO) fund. Moreover, the thorny path of making insolvency frameworks more efficient and more harmonised across member countries needs to be continued, as envisaged via a Commission proposal to be published later this year. This seems also important because of the greater indebtedness of many companies due to the COVID crisis and the possibility that currently low default rates may increase once fiscal support and public guarantees fully vanish.
Chart 2.1
Size and composition of risk capital markets in the euro area and United States
(EUR billion; annual data: 2016 2020)
Sources: European Business Angel Network (EBAN), Invest Europe, National Venture Capital Association (NVCA), Center for Venture Research (University of New Hampshire) for panel b.
Notes: The data covers data for all euro area countries excluding Cyprus, Malta, Slovakia and Slovenia. Venture capital is a subset of private equity and refers to equity investments made for launch (seed), early development (start-up), or expansion (later stage venture) of business. “Seed” is funding provided before the investee company has started mass production/distribution with the aim to complete research, product definition or product design, also including market tests and creating prototypes. This funding will not be used to start mass production/distribution. “Start-up” is funding provided to companies, once the product or service is fully developed, to start mass production/distribution and to cover initial marketing. Companies may be in the process of being set up or may have been in business for a shorter time but have not sold their product commercially yet. The destination of the capital would be mostly to cover capital expenditures and initial working capital. “Later stage venture” is financing provided for an operating company, which may or may not be profitable. Late stage venture tends to be financing into companies already backed by VCs. For further details see www.investeurope.eu/research/. As for “Business Angel” investment these are (high-risk) investments made by private early stage investors typically in the form of seed financing towards startup businesses. Angel investment comprises financial contribution in addition to the investment of time, expertise and connections that the investors also provide in exchange for ownership equity in the startups.
Yet further actions will be necessary to build a vibrant EU equity ecosystem, notably to support European companies with high growth potential to scale up their activities. Greater efficiency and harmonisation of equity and venture capital frameworks across Member States, including addressing the debt-equity bias in taxation, could contribute to further grow and integrate the market. It is also worthwhile to consider how large companies can be further incentivised to provide corporate venture capital to start-ups.[7] Moreover, the extent of the currently ongoing technological transformations, the importance of risk capital for innovation and in turn the EU’s growth and competitiveness requires commensurate engagement of both the private and the public sector and the adequate balance between the two. For example, it may justify targeted public support to stimulate private investment in promising projects. The Scale-up Europe initiative launched by the French Presidency of the EU to achieve large pan-European equity funds for late-stage company financing is targeting precisely one key bottleneck in Europe’s capital market landscape. Obviously, the success of such initiatives also depends on effective policies in other fields outside the strict financial area, such as education, business-university clusters, competition, company and labour regulations, taxation and pension reforms.
Debt issuance procedures need also to be better integrated and harmonised to reduce costs and allow investors to better diversify across EU countries. Turning to debt securities markets, there is no uniform issuance procedure at the moment. Box 3 of the report assesses to which extent home bias in debt securities holdings in the euro area could be reduced, if certain aspects of issuance processes were better integrated and therefore transaction costs reduced. The box focuses on links between Central Securities Depositories (CSDs), institutions mainly responsible for settlement and custody services and involved in the issuance process of new securities via their notary services. It finds that the existence of a link between two CSDs is associated with an economically and statistically significant reduction of home bias. It is therefore advisable to further integrate and harmonise debt issuance processes in the EU. Accordingly, the ECB supports initiatives under the September 2020 CMU action plan to reduce fragmentation in the European post-trade landscape and the SCoReE project (Single Collateral Management Rulebook for Europe).
As further domestic and cross-border bank consolidation could help address structurally low profitability and fragmentation in retail credit markets, it should be considered to remove remaining regulatory obstacles. In what concerns EU credit institutions, further consolidation could reap several benefits. With a significant cross-border dimension, it could foster the integration of credit markets, diversify revenue sources and avoid concentrations at local level. Both domestic and cross-border bank mergers have the potential to address excess capacities and cost inefficiencies, two of the factors behind structurally low profitability in Europe. Chart 2.2 suggests that consolidation has been limited since the creation of the BU in 2012, despite some moderate pick up lately (see also Chart 7, left-hand panel, in the main body). While further consolidation should remain a market-driven process and be based on credible business plans ensuring institutions’ stability, ECB Banking Supervision supports addressing remaining regulatory obstacles to cross-border consolidation. For example, consolidation through branches rather than subsidiaries could imply a deeper and more cost-effective form of consolidation, but it may presently lead to a reallocation of risk across national Deposit Guarantee Schemes. The current Deposit Guarantee Scheme Directive only allows the transfer of contributions for the last 12 months before a merger from the previously responsible scheme to the new one. A more balanced approach to the allocation of resources, in line with the opinion of the European Banking Authority on the issue, would limit risk shifting between the two schemes. In previous reports, the ECB has also made suggestions for the effective use of intragroup waivers to enhance the cross-border fungibility of capital and liquidity within banking groups.
Chart 2.2
Total assets of target banks in the euro area
(EUR billions)
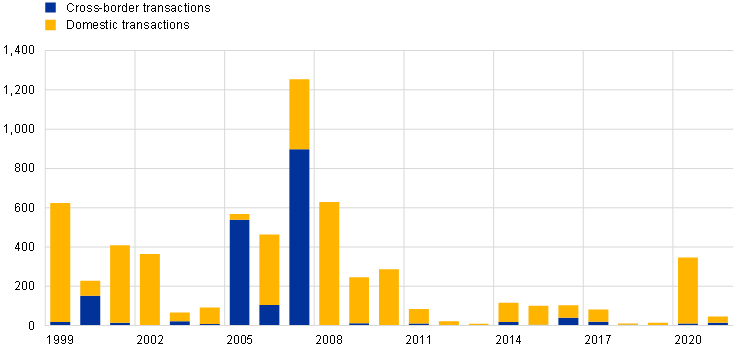
Source: ECB calculations based on Dealogic and Orbis BankFocus.
Notes: The sample includes M&A transactions involving significant institutions and less significant institutions in the euro area, excluding some private transactions and transactions among small banks not reported in Dealogic. Transactions associated with the resolution of banks and distressed mergers were removed from the sample. Transactions are reported based on the year in which they were announced.
Structure and integration developments in the euro area financial system
We have recently witnessed an unprecedented shock, with non-financial corporations (NFCs) at its epicentre. The coronavirus brought a type of shock that was unprecedented in our lifetime, triggering a sharp economic downturn extraordinary in its speed, reach and scale across the world. The NFC sector was the economic epicentre of the COVID-19 pandemic, as a significant part of it was temporarily shut down or reduced in capacity. Risks then spread within the corporate sector – in the form of supply chain disruptions – and thereafter to bank and non-bank lenders. Despite its common origin, the economic and financial fallout from the crisis has been asymmetric across euro area countries: i.e. the effects on production, trade, investment, employment, consumption and financial systems have varied.
Financial structures and integration were severely stressed by the coronavirus crisis. A sequence of concerted monetary, fiscal and prudential policy responses were taken to mitigate the initial tendencies to financial fragmentation and avoid the financial sector aggravating the real-side impacts. As the period covered by this report (the last two years) coincides with the COVID-19 pandemic, the economic and financial implications of which started to materialise in Europe around mid-February 2020, particular emphasis is placed on how the ongoing crisis is influencing financial integration, structures and developments in the euro area.
The state of financial integration and the evolving structure of financial markets and intermediaries are two key elements for gauging the functioning of European Economic and Monetary Union (EMU). For example, they influence the extent to which asymmetric shocks can be shared and how the single monetary policy is transmitted across member countries.
This chapter is structured in two parts. The first investigates the structure of euro area financing markets and the provision of this financing by different euro area financial intermediaries. The second then focuses on measuring the extent of financial integration in the euro area, assessing the resilience of this integration and evaluating its implications for risk sharing.
1 Financial market structure
External financing of euro area NFCs and households (HHs) has held up since the onset of the pandemic (Chart 1, left-hand and middle panels, dark blue lines). It remained at levels broadly comparable with the pre-pandemic years, thanks to coordinated fiscal, monetary and prudential policy measures. NFCs and HHs financed themselves via debt instruments – loans, trade credits and debt securities – and equity instruments including listed and unlisted shares and other types of equities.[8] The timely and effective fiscal policy responses that stabilised markets and the economy came, however, at the cost of a significant increase in the financing needs of the general governments (GGs) (Chart 1, right-hand panel).
NFC external financing increased strongly at the start of the pandemic, and then slowed down from the second half of 2020. At the onset of the crisis, NFCs built precautionary liquidity buffers and front-loaded their financing needs via bank loans and debt securities,[9] as trade credit slowed down in the first half of 2020 on the back of much reduced economic activity.[10] The increase in external financing from the second half onwards was driven by improvements in trade credit and lending between NFCs, reflecting the recovery in economic activity and large firms’ liquidity support to their subsidiaries, sub-contractors and customers.
The economic contraction, combined with sharp declines in corporate sales and cash flows during the first months of the pandemic, drove up NFCs’ bank borrowing and net debt securities issuance in 2020 on the back of substantial monetary and fiscal policy support. As NFCs made a substantial effort to build up their cash buffers in 2020 and the larger ones replaced bank borrowing with market-based debt, their reliance on bank loans remained subdued in 2021. The debt increase in the euro area NFC sector was facilitated by the ECB stepping up its corporate bond purchases, as part of the Pandemic Emergency Purchase Programme (PEPP). The TLTRO-III also had a positive impact on bank lending to firms.
Net issuance of listed NFC shares was negative in 2020, only returning to positive levels in 2021. At the same time net issuance of unlisted shares increased markedly. Net issuance of listed NFC shares in 2020 was strongly and negatively affected by a shift from listed equites to unlisted, mergers and acquisitions (M&A) and balance sheet restructuring by multinationals. In addition to the impact of de-listing, net issuance of unlisted shares was supported by the recovery in the creation of new firms and possible recapitalisation needs of existing businesses. The renewed increase in net listed shares in 2021 was driven by robust issuance in the technology sector, moderate recapitalisations by unlisted firms and improvements in new listings.[11]
Household financing flows remained at pre-pandemic levels all along. Fiscal support measures for households, high household saving ratios and continued credit growth on the back of lending for house purchases sustained household financing.
Government financing increased strongly in 2020 before the economic recovery in the latter part of 2020 and 2021, coupled with progress on the health crisis, partly reversed the drivers of this trend. The sharp contraction in economic activity in the first half of 2020 led to a sudden drop in tax revenues and a surge in current expenditures (due to automatic stabilisers and increased subsidies and transfer payments). While government consumption and investment increased from late 2020, government income also grew substantially as tax collection rose and the fiscal support measures for households put in place to mitigate the crisis declined.
Chart 1
External financing of euro area NFCs, households and general governments by instrument
(flows; four-quarter sums; EUR billions, Q4 for 2017-2020; Q3 for 2021)

Sources: ECB (euro area accounts) and ECB calculations.
Notes: MFI stands for Monetary and Financial Institutions. Non-MFIs include other financial institutions (OFIs) as well as insurance corporations and pension funds (ICPFs). "Other" is the difference between the total and the instruments included in the figure and includes inter-company loans and the rebalancing between non-financial and financial accounts data. Figures shown represent the sum of flows over the last four quarters at the end of Q4 for 2017 to 2020 and of Q3 for 2021.
For all sectors, the COVID-19 crisis increased the outstanding amount of total financing relative to euro area GDP. It also moderately altered the composition of the euro area economy’s balance sheet liabilities (Chart 2). The amount of total financing grew, both as a result of increased volumes and higher valuations. At the end of the third quarter of 2021, aggregate financing amounted to €73.8 trillion, or 6.1 times nominal GDP (Chart 2, middle panel).[12] The strong net issuance of debt securities since end-2019 has extended the euro area economy’s reliance on debt financing and increased the use of marketable instruments in the euro area economy’s financing mix. Debt instruments and marketable instruments increased their relative share in the financing mix by 1.1 percentage points and 0.6 percentage points respectively, mostly on account of the large government debt increase. Euro area GDP also declined considerably in 2020.
Chart 2
External financing of euro area economy

Sources: ECB (euro area accounts) and ECB calculations.
Notes: The chart is constructed from the liabilities of all economic sectors, excluding liabilities to the rest of the world, loans from NFCs (to net out intra-company loans in this non-consolidated data), currency and deposits, investment fund shares or units, entitlements from pension, insurance and standardised guarantee schemes, financial derivatives and employee stock options as well as other accounts payable. Other equity refers to equity claims that are not securities listed on an exchange and not unlisted securities, such as equity in incorporated partnerships, equity in limited liability companies whose owners are partners, capital invested in cooperative societies or investment by the government in the capital of public corporations whose capital is not divided into shares. The European System of Accounts (ESA) 2010 underlying the euro area data is broadly consistent with the SNA 2008, although in some cases it may be more detailed.
The figures for 2021 include values up to Q3, due to data availability.
An overarching lesson is that post-pandemic financing needs call for deeper and more dynamic capital markets, in particular equity markets, as well as the mobilisation of additional capital.[13] The euro area NFC sector in particular will need to re-balance debt/equity ratios to address the post-pandemic debt overhang by reallocating capital from debt to equity or mobilising additional risk capital to support growth and innovation in the euro area economy. A case in point is the depth and integration of the rapidly growing sustainable financing segment (see Box 1: Making euro area equity markets fit for green and digital innovation). Euro area economic agents will most importantly need to cater for investment efforts to meet the challenges of greening and digitising the euro area economy. At the EU level, these are estimated at €650 billion per year up to 2030.[14] This annual investment effort represents 5.4% of euro area GDP, 31.2% of combined euro area NFC, HH and GG financing and 2.3% of euro area household deposits (four quarter sum figures at the end of the third quarter of 2021).
The euro area financial sector’s capacity to attract and intermediate funds to euro area economic agents will crucially depend on scaling up market-based financing and an increasing role for the non-bank financial sector. The ECB regularly assesses these issues (see Sections 3.1 and 3.2) and tracks progress (see Box 2: Measuring market-based and non-bank financing).
Box 1
Making euro area equity markets fit for green and digital innovation
Capital markets, and equity financing in particular, will be essential to meet the EU’s post-recovery ambitions. The investment required to green and digitalise the EU economy is estimated at €650 billion per year until 2030, far exceeding public recovery spending.[15] Alongside public investment programmes such as NextGenerationEU, which are expected to considerably boost innovative sectors and companies, private investment will have to be stepped up significantly over the coming years. This would help meet programme objectives and leverage the innovation and transformation potential, especially as public programmes expire.[16] From a financing perspective, research shows that equity is more suitable for riskier and innovative projects than debt.[17] Equity financing can also have a stabilising impact in an environment in which the COVID-19 crisis has increased corporate leverage substantially. Equity will thus be vital in closing the investment gap and financing post-recovery economic activity. This box provides an overview of euro area equity markets by type of equity and investor and highlights the need to further improve Europe’s equity landscape, in particular as regards risk capital.
Equity financing plays a central role in funding innovation, and is therefore a crucial complement to public investment in delivering the green and digital transition.[18] In contrast to bank lenders, equity investors are more willing to assume the greater risks associated with innovation and do not require tangible collateral.[19] The equity share of an economy (equity as a share of the sum of equity and credit) has been shown to positively correlate with green innovation.[20] Venture capital investments specifically have also been shown to spur innovation,[21] including green innovation, and there is evidence that their social return is significantly greater that of public or business R&D.[22] Accordingly, economies with a greater share of public and private equity in their financial structure have been found to de-carbonise faster than those that are more debt and bank-based.[23] At the same time, innovation is an economy-wide effort, and the extent and speed of innovation required for the green and digital transformations will also depend on public-sector initiatives and synergies between different sectors. In particular, large “mission-oriented” investment programmes induce material spillovers between the many different private and public actors involved and frequently result in innovation.[24] More generally, funding availability plays a key role throughout the R&D process, including the dissemination of new technologies; this illustrates the point that public spending on R&D and private risk capital complement each other in fostering green and digital innovation.
An enabling equity ecosystem for innovative companies includes venture capital and access to public equity markets[25]. While only 0.5% of US firms are backed by venture capital, these account for nearly half of all public listings.[26] Venture capital, especially by corporates, is also typically accompanied by significant know-how transfer. Survey data show that initial public offerings (IPOs) are a key exit strategy for firms backed by venture capital.[27] This not only highlights the role of venture capital, but also the importance of a diversified choice of equity instruments to help firms grow to scale and reach their full potential.[28]
Chart A
A comparison of the euro area and the US: equity financing requirements by type of equity
(ratio to nominal GDP (left-hand panel); EUR billion (right-hand panel); annual data: 2016-2020)

Sources: Panel a: ECB and OECD; panel b: European Business Angel Network, Invest Europe, National Venture Capital Association, Center for Venture Research (University of New Hampshire).
Notes: Panel a: the chart is based on financial accounts data. Other equity refers to equity claims that are not securities listed on an exchange and not unlisted securities, such as equity in incorporated partnerships, equity in limited liability companies whose owners are partners, capital invested in cooperative societies or investment by the government in the capital of public corporations whose capital is not divided into shares. Data for the US are based on the global System of National Accounts 2008. The European System of Accounts 2010 underlying the euro area data is broadly consistent with the SNA 2008, although in some cases it may be more detailed; panel b: the data cover all euro area countries except Cyprus, Malta, Slovakia and Slovenia. Venture capital is a subset of private equity and refers to equity investments made for launch (seed), early development (start-up), or expansion (later stage venture). “Seed” is funding provided before the investee company has started mass production/distribution, with the aim of completing research or defining and designing the product, including market testing and creating prototypes. This funding is not used to start mass production/distribution. “Start-up” is funding provided to companies once the product or service is fully developed, to start mass production/distribution and cover initial marketing. Companies may be in the process of being set up or may have been in business for a shorter time, but have not sold their product commercially yet. The use of the capital would mostly be to cover capital expenditure and initial working capital. “Later stage venture” is financing provided for an operating company, which may or may not be profitable. This tends to be financing provided to companies already backed by VCs. For further details see www.investeurope.eu/research/. “Business Angel” investments are (high-risk) investments made by early-stage private investors, typically in the form of seed financing for start-up businesses. Angel investments comprise both financial contributions and time, expertise and connections the investors provide in exchange for ownership equity.
European private equity and risk capital have grown in recent years, but the euro area still lags behind international peers. While aggregate euro area equity markets have stagnated in size over recent years, private equity has gained in relative importance compared to public equity. This is in stark contrast to the US, where listed equity plays a dominant role (see Chart A, left-hand panel). Total euro area early-stage equity financing (or risk capital) – including business angel, venture capital and growth equity investments – grew from €10.7bn in 2016 to just short of €14bn in 2020, with venture capital accounting for nearly all of the increase. Yet, despite euro area venture capital having doubled over this period, the gap with the US widened: it is now less than 5 percent of US venture capital. Similarly, total euro area risk capital is less than one-tenth of US risk capital (see Chart A, right-hand panel). The structure of venture capital financing also differs compared to the US, with most euro area venture capital funds concentrated on comparatively small, early-stage funding for companies.[29] This later-stage funding gap has been reported to lead high-growth high-potential companies (“scale-ups”) to seek funding from abroad in the pre-IPO phase; this can even lead to these companies relocating their operations.[30] US venture capital funds, for instance, are on average three times larger than their European counterparts and, in terms of capital raised between 2010 to 2019, the biggest EU venture capital firm is three times smaller than the 10th largest US venture capital firm.[31] Finally, there are also significant differences in the size of risk capital markets across euro area countries.
Knowledge of the main providers of equity financing to euro area NFCs can help assess the size of the equity financing gap in the euro area and identify ways to narrow it. To further shed light on the providers of equity financing to euro area non-financial corporations (NFCs), the following analysis uses 2020 Bureau van Dijk ORBIS data.[32] The sample underlying this analysis covers 8,706 euro area NFCs with 7,810 distinct ultimate owners (i.e. investors) and aggregated equity capital at book value amounting to EUR 2.7 trillion. 5,263 NFCs in the sample can be clearly assigned to the following three key economic sectors: manufacturing (40% of the sample’s equity: 2,104 entities representing 24% of the total number of entities); professional, scientific and technical activities (13% and 23% respectively); and wholesale and retail trade (4% and 13% respectively).[33]
Individuals and sovereigns are the main providers of equity funding for NFCs (Chart B, left-hand panel). Individuals provide 50%, 23% and 87% of listed, unlisted and other[34] equity financing respectively. Sovereigns are the main providers of unlisted equity financing (29% of total unlisted equity) and the second largest provider of listed equity financing (24% of total listed equity). Sovereign investors – led by Italy (27% of total sovereign investment), France (23%), Germany (21%) and Austria (13%) – invest principally in large-sized companies. Financial corporations[35] (including investment companies and other financial intermediaries) supply 6% of euro area NFCs’ equity financing, with investment companies and other financial intermediaries (OFIs)[36] providing 2%. The role of OFIs reflects the provision of intra-NFC equity financing e.g. via captive finance companies. Foundations and research institutes represent 13% of total equity financing.[37]
NFCs are also important providers of listed and unlisted equity financing. They see this as a way of implementing their business strategies and investing in early stage companies. Empirical evidence shows that NFCs which have benefitted from venture capital financing are more likely to provide venture capital financing to others,[38] thereby strengthening the corporate venture capital ecosystem. NFCs compete in this role with private equity funds (PEs), venture capitalists (VCs) and other early-stage risk capital providers. The methodological approach adopted for this analysis[39] underestimates the role of PEs and VCs companies for euro area NFC equity financing. VCs and PEs tend to own NFC equity via structures such as funds of funds, which are not covered in Chart B, rather than as direct portfolio positions.[40]
It is chiefly large and medium-sized euro area NFCs that issue listed equity (Chart B, right-hand panel). The challenges small companies face to list on public markets include the fixed costs of listings, the lower liquidity of small stocks and the limited incentives for the advisory ecosystem to support SMEs looking to hold an IPO.[41]
Chart B
Equity investments by investor sector and composition of equity investments by investee size
(2020; EUR billions (left-hand panel); number of NFCs (right-hand panel))
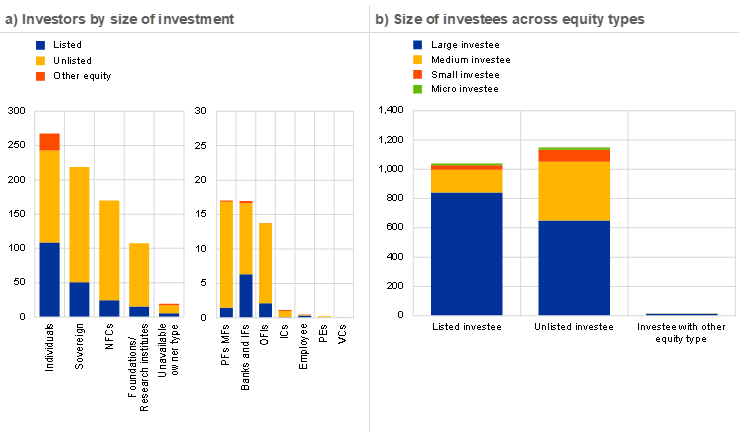
Source: Bureau van Dijk ORBIS database and ECB calculations.
Notes: The chart reflects the size of the investment of ultimate owners holding more than 25%. Size of investment consists of shareholders’ equity at book value provided by each investor to euro area consolidated NFCs in the sample. Consistent with the definition of “Other equity F.519” in ESA 2010, this includes the equity of partnerships, cooperative companies, branches, and foreign companies. Left-hand panel: banks and other investment companies are identified within the same category of investors by Orbis. Individuals are single private shareholders and shareholders designated by more than one named individual or family. NFCs are non-financial companies. Sovereign are states, governmental agencies, governmental departments and local authorities. OFIs are other financial intermediaries not classified as IBs and MFIs (broad category of monetary financial institutions and investment companies), PFs and MFs (pension funds and mutual funds), ICs (insurance corporations), PEs (private equity funds), HFs (hedge funds) or VCs (venture capital funds). Right-hand panel: the size of investees is consistent with the definition of SMEs provided by the European Commission. Medium entities have total assets of less than €43 million and the number of employees is less than or equal to 250. Small entities have total assets of less than €10 million and the number of employees is less than or equal to 50. Micro entities have total assets of less than €2 million and the number of employees is less than or equal to 10.
A pronounced home bias prevails across all types of equity financing (Chart C, left-hand panel). Equity investors from outside the euro area play a relatively more important role in providing equity financing in the form of unlisted or other equity to euro area NFCs. Looking at the residence of investors or investing firms, cross-border equity financing within the euro area is very low across all equity types and points to fragmented euro area equity markets. The strong role of individuals and the domestic public sector explain this home bias.
Excluding equity investments by individuals and sovereigns, equity is channelled from listed firms to unlisted ones (Chart C, right-hand panel). Sovereign and individuals can take stakes directly in listed equity or indirectly via investment vehicles.[42] Banks and asset managers enable retail or wholesale investors to participate in equity financing predominantly through fund structures.
Chart C
Equity financing funnelled across jurisdictions and equity types
(2020; EUR billions (left-hand panel); percentages (right-hand panel))
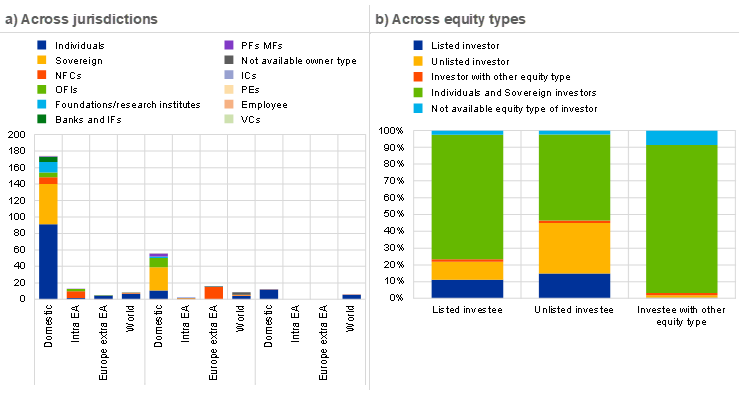
Source: Bureau van Dijk ORBIS database and ECB calculations.
Notes: The chart reflects the size of the investment of ultimate owners holding more than 25%. Size of investment consists of shareholders’ equity at book value provided by each investor to euro area consolidated NFCs in the sample. Banks and other investment companies are identified within the same category of investors by Orbis. Individuals are single private shareholders and shareholders designated by more than one named individual or family. NFCs are non-financial companies. Sovereigns are states, governmental agencies, governmental departments, and local authorities. OFIs are other financial corporations not classified as IBs and MFIs (broad category of monetary financial institutions and investment companies), PFs and MFs (pension funds and mutual funds), ICs (insurance corporations), PEs (private equity funds), HFs (hedge funds) or VCs (venture capital funds). Left-hand panel: the category “Europe extra euro area” refers to every European country, including countries outside the EU. Consistent with the definition of “Other equity F.519” in ESA 2010, this includes the equity of partnerships, cooperative companies, branches, and foreign companies. Right-hand panel: Percentages are computed as the equity provided by the investors as a share of total equity provided by all investors included in our data source.
The insights from this analysis suggest a need to further develop EU equity markets, especially with a view to strengthening funding opportunities for smaller, greener or innovative companies. Some measures to facilitate companies’ access to different types of funding are already under way or have been announced, in line with the European Commission’s 2020 Capital Markets Union Action Plan.[43] The recent proposal by the European Commission to create a digital platform providing free and centralised access to EU company and investment product information – the European Single Access Point (ESAP) – should make it easier for investors to identify investment opportunities and for companies to raise funding, both on private and public markets. It is especially welcome that the ESAP will include sustainability-related information, which can help gear funding toward greener activities, and be open to SMEs. Similarly, the forthcoming review of EU public listing rules by the European Commission, which will aim to make listing easier for SMEs, not least by setting up a dedicated SME IPO fund, is an opportunity to diversify smaller companies’ access to equity funding.
However, additional measures are necessary to grow the investor base and close the equity funding gap with international peers, especially in risk capital markets. Facilitating investments by institutional investors in green and innovative projects, as for instance envisaged in the ongoing review of EU fund and insurance regulation, is an important element to this effect. However, more fundamental reforms will be necessary to help Europe move closer towards its international peers as regards risk capital and cater to the needs of a highly innovative and competitive economy. More efficient and harmonised insolvency laws and regulatory frameworks for equity investments, including addressing the debt-equity bias in taxation, can improve certainty for investors, reduce costs and facilitate cross-border investments, while also making risk capital more attractive and accessible to companies.[44] Other reforms could include incentives for large companies to provide corporate venture capital for start-ups. Given the gap against international peers and the positive spillovers from cross-sectoral cooperation in innovation, there appears to be a strong case for expanding public initiatives to help catalyse risk capital investments, notably via promotional banks. Recent initiatives such as the European Innovation Council (under the EU budget) or the public-private Scale-up Europe initiative to support the creation of large pan-European equity funds for late-stage company financing provide a welcome boost. Jointly, these measures – together with an ambitious implementation of the CMU Action Plan more broadly – will contribute to building a more dynamic funding ecosystem with positive spillovers for innovation. As such, they are also an important element for building a green CMU with sizeable, mature and integrated green capital markets.[45] In turn, these measures will facilitate the transition to a greener and more digitised economy and the success of public investment programmes, while promoting the EU’s strategic autonomy.
2 Financial intermediary structure
The growth of the euro area financial system since 2019 has come on the back of a strong increase in financial assets held by credit institutions and investment funds (Chart 3). Overall financial system assets have grown by €11.5 trillion since end-2019, with Eurosystem assets contributing €4.9 trillion of this. Valuation effects were a main driver of the increase in total financial sector assets (Chart 3, left-hand panel) together with increased ECB asset purchases through the PEPP.
Of the various financial sub-sectors, banks and investment funds have recorded the strongest increase in their financial assets over the last two years. Banks’ total assets grew by €3.9 trillion, predominantly thanks to fiscal, monetary and prudential policy support allowing them to provide credit flexibly. Investment funds benefitted from strong inflows and valuation effects that increased their financial assets by €2.4 trillion.[46] Other financial institutions (OFIs) – mainly holding companies and funding vehicles channelling funding flows in corporate groups – was the only sub-sector that saw financial assets decrease (-€0.5 trillion).
Financial system assets now represent eight times nominal GDP. The sharp economic contraction in 2020 (the grey line in Chart 3, left-hand panel) coupled with an increase in the volume and value of financial sector assets, pushed the ratio of total financial system assets to GDP from 7.2 in 2019 to 8.0 in 2020. This increased further to 8.1 in 2021 as the volume and value of financial sector assets increased, but by less than nominal GDP, which returned to its 2019 level (Chart 3, middle panel).
Chart 3
Total assets of the euro area financial sector
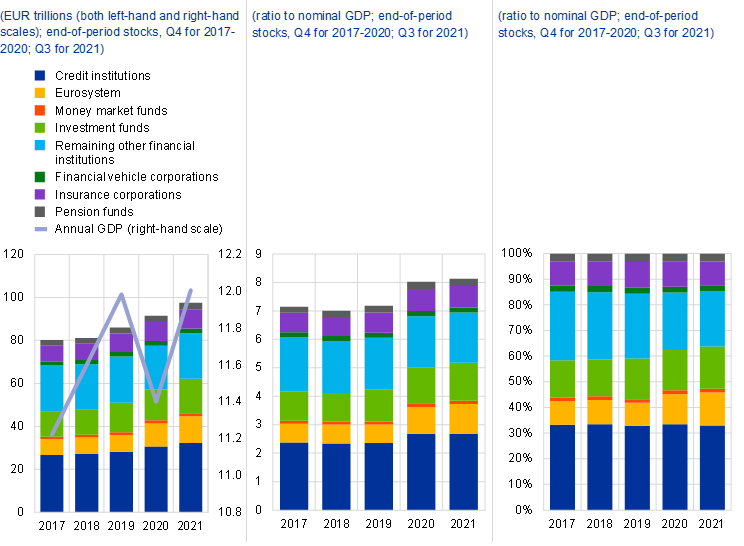
Source: ECB.
Notes: The aggregated (non-consolidated) assets of sub-sectors include financial assets and exclude non-financial assets. Remaining other financial institutions include security and derivative dealers, financial corporations engaged in lending (such as leasing or factoring companies), specialised financial corporations (including venture capital companies, export/import financing companies and some central clearing counterparties), financial auxiliaries (including asset management companies, securities brokers, investment advisers, insurance brokers and exchanges) plus captive financial institutions and money lenders (including financial holding companies, funding vehicles of non-financial corporations – e.g. supporting their debt issuance – and other entities that channel financial flows within non-financial corporations).
Changes in the euro area financial structure highlight a softening of bank dominance and the increasing weight of investment funds (Chart 3, right-hand panel). In relative terms, investment funds further increased their role (up by 0.6 percentage points compared to 2019) and the share of credit institutions grew slightly (by 0.1 percentage points), whereas all other sub-sectors saw their weight decrease, specifically OFIs (down by 3.5 percentage points).
The non-bank sector has continued to gain importance for euro area real economy financing. Non-bank financial intermediaries – more narrowly defined as money market funds (MMFs), investment funds (IFs), insurance corporations (ICs), pension funds (PFs) and financial vehicle corporations (FVCs) – held a combined €31.7 trillion in financial assets by end-2021 and accounted for 37.3% of the total financial sector.[47]
The non-bank sector has grown continuously over recent years and provides a significant share of total funding to the euro area real economy. IFs and ICPFs hold more than 40% of outstanding euro area NFC market debt (Chart 4) and bought the lion’s share of the record-high new issuance of NFC debt securities in the post-crisis recovery.[48] More generally, the ratio between credit granted by non-banks to NFCs to credit provided by both banks and NBFIs has almost doubled from around 15% to close to 30% since the global financial crisis. The relative importance of NBFI holdings of listed shares compared to those of banks and NBFIs, however, has remained stable at the high level of around 80% (see Box 2).
The assets of other financial intermediaries (OFIs) have decreased substantially, predominantly on account of reductions in their unlisted share holdings. OFIs’ aggregate assets decreased by 2.5% (Statistical Annex Chart 37), reflecting international companies’ restructuring of their off-shore activities due to changes in international tax regulations and exchange rate fluctuations.
Chart 4
Investor base of debt securities issued by EA issuers
(percentage of amounts outstanding)
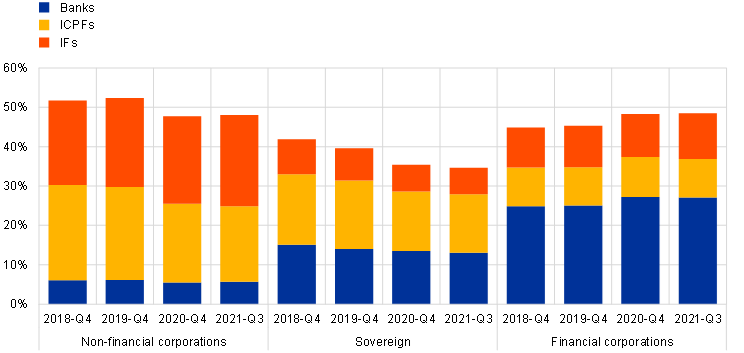
Sources: Euro area accounts reports, SHS and ECB calculations.
Note: Excludes financial vehicle corporations and remaining other financial institutions (OFIs).
Despite multiple ongoing international and European initiatives, harmonised central bank statistics still do not provide sufficient coverage of the way fintechs are transforming business. For example, the statistics lack insights into fintechs’ implications for relationships with different economic sectors in general and the euro area financial system in particular. Developing sound statistics covering these critical players is essential to monitoring advances in the financial system. Valuable initiatives have been launched at the international and European levels to increase the availability of information and improve the conceptual framework for fintech. The plan for a new Data Gap Initiative under the auspices of the G20 finance ministers and central bank governors envisages the development of prospective frameworks and data collections on fintech and financial inclusion.[49] The ongoing revisions to the International Standard Classification of All Economic Activities (ISIC)[50] and the statistical classification of economic activities in the European Community (NACE)[51]– both relevant for the preparation of national accounts and other economic and business statistics – are considering how fintech developments should be treated, and whether it is necessary to identify fintech activities separately in their hierarchical structures.[52] Finally, the concepts and accounting standards for compiling national accounts (the System of National Accounts, SNA 2008)[53] and external sector statistics (the Balance of Payments and International Investment Position Manual, Seventh Edition, BPM7)[54] are currently under revision; part of the review process is considering the treatment of fintech and crypto assets.
Box 2
Measuring market-based and non-bank financing of non-financial corporations in the euro area
The importance of market-based credit and non-bank finance in the euro area has increased substantially in recent years. Total assets of the euro area non-bank financial sector have almost doubled to around €50 trillion over the last decade and now represent almost 55% of total euro area financial sector assets.[55] This trend is reflected particularly in the credit space by the greater use of marketable credit instruments such as debt securities issued by non-financial corporations (NFCs), while dynamics in the equity space differ. The outstanding amount of debt securities issued by euro area NFCs has roughly doubled over the past decade, growing from around €860 billion in January 2012 to around €1.6 trillion in December 2021.[56]
This box sheds light on these developments by designing and estimating two indicators of NFC financing: a market-based (MB) measure and a non-bank (NB) measure. The MB measure takes the instrument perspective: it computes the ratio of how much NFCs finance themselves by issuing marketable instruments (i.e. debt securities, securitised loans and listed shares) compared with non-marketable instruments (i.e. external loans and unlisted equity).[57] By contrast, the NB measure takes an entity perspective: how much financing do NFCs receive from non-bank financial institutions (NBFIs) compared with their total financing from both NBFIs and banks, irrespective of the instrument used?[58] In addition, this box estimates these measures separately for credit and equity components. The two concepts of MB and NB finance are closely related, as NBFIs tend to hold a large share of marketable instruments. But they differ in scope, as the NB measure also includes the small but increasing amount of loans provided to NFCs by NBFIs. In addition, the NB measure considers only financing provided by banks and NBFIs, while the MB measure also covers financing provided by non-financial sectors such as NFCs, households and governments.
Since 2009, the relative importance of the NBFI sector in financing the real economy has increased significantly, whereas reliance on marketable instruments has not increased (Chart A). MB finance has in fact remained fairly constant at around 35% since 2009. However, this masks a doubling in MB credit alongside a significant decrease in MB equity, i.e. the share of listed equity over total external equity. By contrast, NB finance has increased significantly from 25% to close to 40%, driven in particular by a strong rise in NB credit and to a lesser extent by a slight increase in non-banks’ holdings of listed shares relative to banks’ holdings.[59]
Owing to data gaps, estimating the two measures requires several assumptions to be made. First, since there is no sectoral breakdown for financing received from non-euro area residents, the sectoral distribution of such financing is taken to be the same as in the euro area. Second, since the euro area sectoral breakdown for securities is only available since the fourth quarter of 2013, it has to be back-casted to previous quarters.[60] Third, information needed to exclude intra-group NFC financing is only partially available.[61] Fourth, the extent to which loans and equity granted and held by the other financial institutions sector (OFIs or “the OFI residual”) should be counted as external financing is unclear.[62] To tackle this, non-retained securitised loans are first separated out from loans granted by OFIs, with upper and lower bounds then calculated by either including or excluding all remaining loans and unlisted equity held by OFIs in the measures.[63] Finally, since the available equity data can be strongly driven by valuation effects, new time series are constructed: the outstanding amount in 1999 is taken as the starting point, and flows in the subsequent quarters are cumulated.[64]
Chart A
Market-based and non-bank financing of euro area NFCs, including their decomposition into credit and equity components
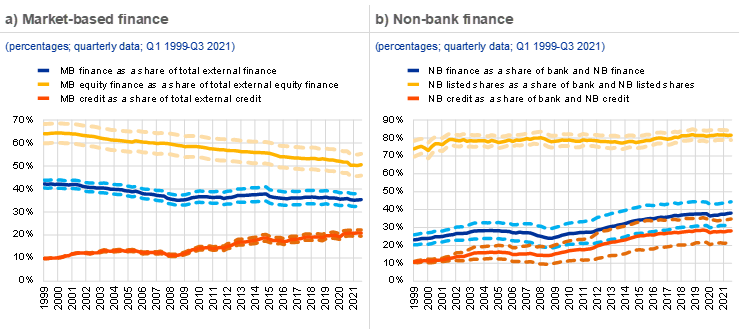
Sources: ECB (euro area accounts, balance sheet item statistics and financial vehicle corporation statistics) and ECB calculations.
Notes: Dotted lines represent the upper and lower bounds depending on whether the OFI residual is included as explained in the paragraph below. MB finance is defined as debt securities, non-retained securitised loans and listed shares over external loans and unlisted equity. MB equity is external listed shares over external unlisted equity. MB credit is debt securities and non-retained securitised loans over all external credit. NB finance is listed shares, (securitised) loans and debt securities held by NBFIs against those held by the total financial sector excluding central banks. NB equity is listed shares held by NBFIs against those held by the total financial sector. NB credit is credit held and granted by NBFIs against that provided by the total financial sector excluding central banks.
Monitoring and further refining these measures is important, as increasing use of MB finance can bring benefits for economic growth, integration and resilience in the euro area, provided that the supply of such financing remains resilient at all times. Both market-based and bank-based finance contribute to economic growth. But there is evidence that the marginal contribution of capital markets increases with economic development, as market-based finance contributes to the efficient allocation of capital towards innovative and productive companies.[65] The ability to mobilise and allocate financing from well-developed capital markets, especially deep stock markets, can also help to accelerate the greening of the economy.[66] As cross-border bank lending remains low (see Section 3.3.2), market-based finance can also strengthen financial integration by facilitating cross-border funding and risk sharing throughout the euro area. For all these reasons, one goal of capital markets union is to make entering and raising capital on public markets easier for companies. At the same time, market-based finance, as well as bank lending, can pose financial stability risks, which need to be closely monitored.[67] The benefits of MB finance can also be dampened if driven by a strong increase in NFCs’ debt, which may lower their loss absorption capacity. In addition, bank finance also has its own advantages, as banks can process soft information for credit decisions and offer more flexible credit terms compared with bond markets.[68] This can also create risks, as a close relationship between bank and customer might lead to the refinancing of lending exposures in danger of defaulting. In the equity space, young, innovative start-up companies often rely on unlisted equity, such as venture capital (see Box 1).
The provision of financing by the NBFI sector can also improve financial integration and resilience if related risks are mitigated. Stronger reliance on the NBFI sector is beneficial for financial integration. This is because investment funds – a significant subsector within the NBFI sector – tend to hold diversified portfolios and thereby facilitate the dispersion of asset holdings across euro area countries.[69] In addition, diversification of funding sources helps reduce the impact of bank-specific shocks on the real economy, potentially helping to strengthen financial resilience and stability. However, this is only true to the extent that the non-bank financial sector is a resilient source of funding, which is not to be taken for granted. In particular, the events of March 2020 highlighted the need to strengthen the resilience of NBFIs from a macroprudential perspective, ensuring that they provide a stable source of funding to the real economy in both normal and stressed market conditions.[70]
2.1 Credit institutions
A persistent challenge in the euro area is that banks have been suffering from structural low profitability for years, especially compared to other jurisdictions such as the United States. While the pandemic has put further pressure on banks’ profitability, average return of equity has recently exceeded pre-pandemic levels (Chart 5). However, overall profitability continues to be low and variance remains high. Among other factors, this is rooted in structural vulnerabilities related to excess capacity and cost inefficiencies.[71]
Chart 5
Return on credit institutions’ equity in major advanced economies
(percentages, Q1 2018-Q4 2021 for realised; Q1 2022)

Sources: Bloomberg and ECB calculations.
Further consolidation would benefit the efficiency and stability of the banking system. Banks with non-viable business models on a standalone basis can leave the market without endangering financial stability. Cross-border consolidation within the EU could help reduce costs and diversify sources of revenue. The digital transformation process could also be a lever to improve efficiency and offer new avenues for revenue growth, including by expanding activities across borders.
While there has been modest progress in consolidation since the establishment of the banking union (Chart 6), M&A activity appears to have gained momentum over the past two years (Chart 7).[72] Several factors can act as a brake on bank mergers: tax regimes, in the absence of harmonisation, can be a contributing factor; differences in national legislation (competition law, credit law, customer protection, etc.) can also hamper projects. Harmonisation should therefore be pursued to the greatest extent possible, including for rules that do not form part of banking regulations per se. Even though fully fledged bank mergers and acquisitions are still predominantly domestic, some of the more targeted consolidations at the level of business lines feature a cross-border dimension and hence are also contributing to financial integration within the EU.
Chart 6
Number of credit institutions (1998-2021)
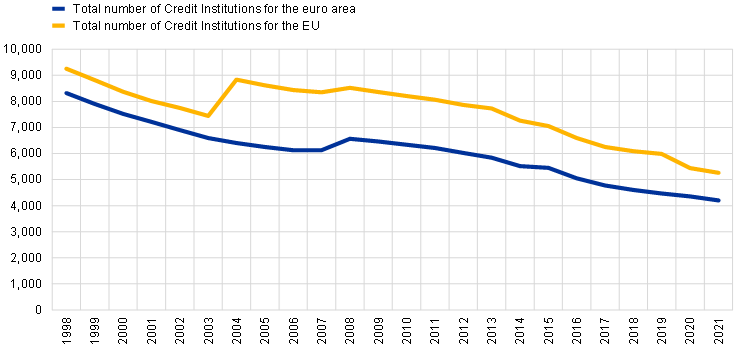
Source: ECB calculations.
Chart 7
Value and number of bank M&A in the euro area (1999-2021)
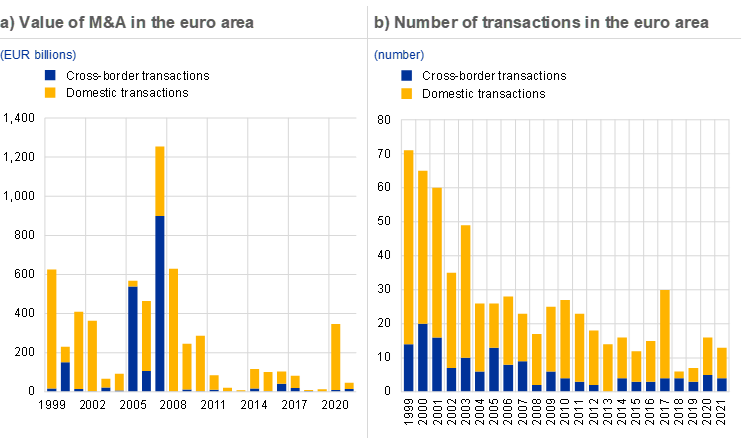
Source: ECB calculations based on Dealogic and Orbis BankFocus.
Notes: The sample includes M&A transactions involving significant and less significant institutions in the euro area, excluding some private transactions and transactions among small banks not reported in Dealogic. Transactions associated with the resolution of banks and distressed mergers have been removed from the sample. Transactions are reported based on the year in which they were announced.
Consolidation must remain a market-driven process and be conditional on safeguards on the business plan, business model sustainability, governance and risk management. The ECB has published a guide on the prudential treatment of mergers and acquisitions to provide transparency on its assessment approach to merger transactions.[73]
Several regulatory obstacles may hamper cross-border consolidation.[74] These include the limited cross-border fungibility of capital and liquidity within a single banking group. The ECB has made several suggestions as to how to facilitate the use of intragroup liquidity waivers within the current regulatory framework.[75] However, a lack of harmonisation of tax and insolvency regimes, customer protection and labour laws may still pose obstacles to the cross-border provision of services, in particular in the retail market. The planned Basel Committee revision of the implications of developments related to the European Banking Union for the G-SIB methodology, which will include a targeted review of the treatment of cross-border exposures within the Banking Union, represents an opportunity to assess issues related to effective integration.
Another way to pursue cross-border integration would be for banks to review their cross-border organisational structures. In particular, relying more extensively on branches and providing services directly across borders, instead of through subsidiaries, could be a way to develop pan-European business within the banking union and the Single Market.[76] The digitalisation of the banking market may offer new possibilities here, especially for cross-border provision of banking services.
ECB Banking Supervision has made some suggestions for improving the regulatory framework to facilitate the use of branches as a means of cross-border banking.[77] One pertinent issue concerns the provisions of the Deposit Guarantee Scheme Directive (DGSD). The current legal framework limits the amount of contributions that are transferred to the receiving DGS if the bank is transformed into a branch of another bank that is established in a different Member State. This provision is counter-intuitive, because the transfer of insured deposits implies a change in the overall risk of reimbursement for both DGSs involved. A good way forward would be to follow the EBA Opinion on this topic, which would involve replacing the current rule with a more balanced approach to the allocation of resources between the DGS of origin and the receiving DGS.[78]
2.2 Non-bank financial intermediaries
2.2.1 Money market and investment funds
Money market funds stood at €1.4 trillion in total assets in the third quarter of 2021, an increase of 7.4% from the third quarter of 2019 (Statistical Annex Chart 41). MMF assets remained highly concentrated in Ireland, Luxembourg and France. During the March 2020 market turmoil, private debt MMFs experienced strong outflows as investors’ demand for cash increased and they redeemed their shares. After the announcement of the PEPP the outflows stabilised, as risk sentiment and market conditions improved.[79] Reducing the liquidity mismatch and strengthening the asset liquidity of private debt funds should be a key element of MMF reforms in the EU.[80]
The investment fund sector has grown strongly over the last two years. Total assets stood at €17.6 trillion in December 2021, an increase by around €3.4 trillion or close to 25% over the last two years. Investment funds therefore remain the second largest subsector of NBFIs, accounting for one-third of assets. Assets are concentrated in Luxembourg, Ireland, Germany and France.
IFs recovered their total assets quickly after the March 2020 market turmoil and experienced record growth rates (Chart 3, left-hand panel). Investment funds suffered valuation losses and outflows in March 2020, leading to a drop in total assets of 8% in the first quarter.[81] The sector recovered to its pre-crisis size in the autumn of 2020. Amid positive news on the availability of vaccines in November 2020, investment funds attracted record inflows and experienced strong valuation gains. Total assets accelerated their growth and increased by €3.4 trillion in the relatively short period between the third quarter of 2020 and December 2021. Equity funds experienced the highest inflows of all asset classes in the fourth quarter of 2020 and the first quarter of 2021, amounting to €140 billion and €147 billion (Chart 8, panel a). These were the highest quarterly inflows since the start of the time series and, jointly with valuation effects, led to equity funds overtaking bond funds as the largest IF subsector in terms of total assets for the first time in November 2020 (Chart 8, panel b).
Strong inflows into investment funds can contribute to financial integration, although a large share of the inflows was invested outside the euro area (Chart 8, panel c). Investment funds facilitate cross-border financing and risk sharing.[82] However, most of the record inflows into equity funds were subsequently invested outside the euro area and therefore did not help fund domestic companies (Chart 8, panel c). While investors in euro area investment funds benefit from diversified portfolios and investment opportunities in foreign economies, this could also point to less intra-euro area equity market integration due to less developed capital markets.
Chart 8
Trends in euro area investment funds
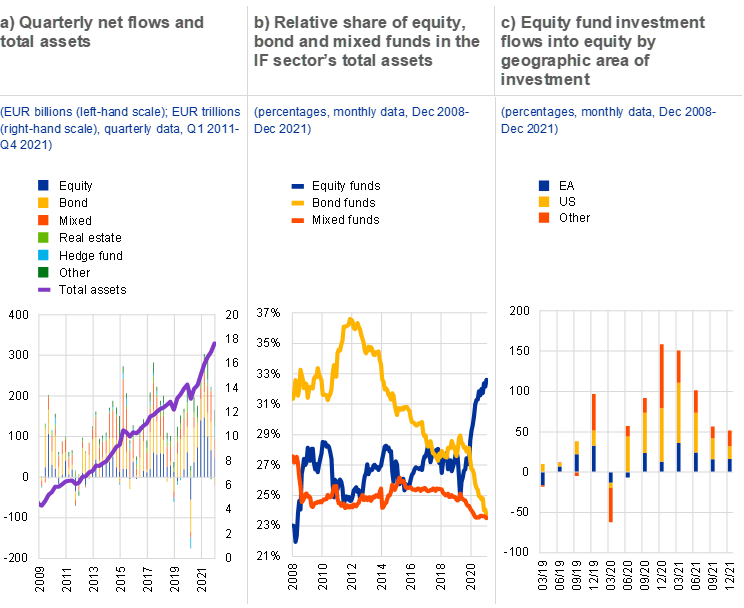
Source: ECB (investment fund balance sheet statistics).
Notes: Panel a: net flows reflect net issuance of shares. Panel c: "Other" refers to all equity transactions by euro area equity funds with
counterparts in areas other than the EA and US.
2.2.2 Insurance companies and pension funds (ICPFs)
ICPFs’ assets remain concentrated in relatively few euro area countries and they tend to focus on offering their services domestically. Insurance companies (ICs) in France, Germany and Italy together held the majority of euro area sector assets in 2021, while the Netherlands remain the largest pension fund (PF) sector in the euro area. There are differences in the structural design of first pillar retirement funding across euro area countries.[83] Pronounced differences in ICPF penetration rates (total sector assets/GDP) predominantly stem from the different roles these intermediaries play in providing retirement funding in their respective economies.
ICPFs have continued increasing their investments in IF shares and equities, diversifying their portfolios but also reducing their cash buffers (Chart 9). Higher investments in riskier assets are motivated by the search for yield[84] in the low interest rate environment and have been further supported by the shift towards defined-contribution schemes in the PF sector.[85] Overall, structural developments reflect a continuation of previous trends; the ICPF sector remained comparatively resilient to the COVID-19 shock.
Chart 9
ICPF investments by asset class
(percentages of total assets)
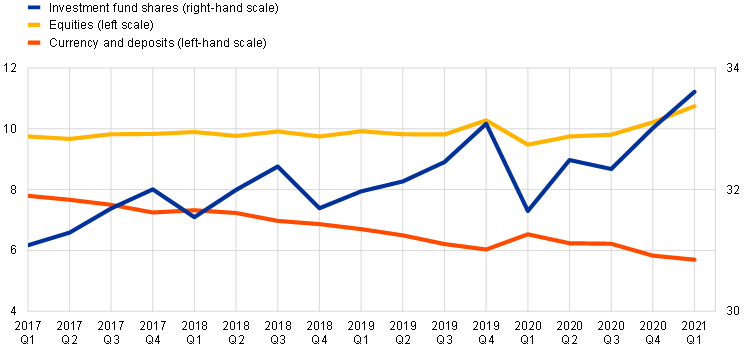
Source: Euro area accounts.
Notes: investment fund shares represent the aggregate investments in this asset class, irrespective of the funds’ investment policy (i.e. equity funds, bond funds, mixed funds, real estate funds, hedge funds and other funds).
3 Financial integration
3.1 Monitoring the state of financial integration by means of two composite indicators
There is evidence of a V-shaped decline and rebound in financial integration early in the pandemic. In recent years the ECB has built two composite indicators of financial integration (CIFIs; see Hoffmann et al., 2019).[86] Both help in gaining an overview of the state of financial integration. The first is the price-based CIFI shown in the blue line in Chart 10. This is based on cross-border price differentials in the most important financial markets (money markets, equities, bonds and banking). It shows a sharp deterioration at the start of the pandemic. While episodes of price-based financial re-fragmentation are not unprecedented, the one that occurred between February and April 2020 reversed substantially faster than in previous crises, such as the global financial crisis and the sovereign debt crisis. The pronounced fall in financial integration at the onset of the pandemic was followed by a quick rebound from mid-2020 on the back of a coordinated fiscal, monetary and prudential policy response to its economic and financial impact (see also the later discussion). The second, quantity-based, CIFI indicator (the yellow line in Chart 10) exhibited a less pronounced V-shaped decline and then levelled off at values last seen in 2014-2015, driven by unsecured money market lending, equity holdings and bonds, as discussed below. By mid-2020 both indicators had returned to pre-pandemic levels. Thus, both CIFIs were supported by the pan-European policy responses and institutional progress described below.
The key events of 2020 and 2021 – in terms of their impact on financial integration – are shown in chronological order in Chart 10.
Chart 10
Price-based and quantity-based financial integration composite indicators
(quarterly data; price-based indicator: Q1 1995 – Q4 2021; quantity-based indicator: Q1 1999 – Q4 2021)
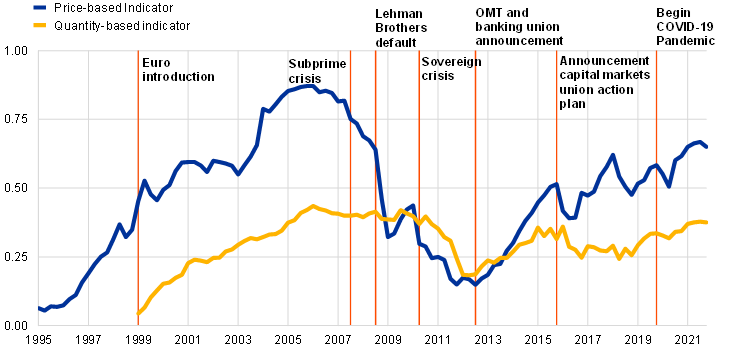
Sources: ECB and ECB calculations.
Notes: The price-based composite indicator aggregates ten indicators for money, bond, equity and retail banking markets; the quantity-based composite indicator aggregates five indicators for the same market segments except retail banking. The indicators are bounded between zero (full fragmentation) and one (full integration). Increases in the indicators signal greater financial integration. From January 2018 onwards the behaviour of the price-based indicator may have changed due to the transition from EONIA to €STR interest rates in the money market component. OMT stands for Outright Monetary Transactions. For a detailed description of the indicators and their input data, see the Statistical Web Annex to this report and Hoffmann, P., Kremer, M. and Zaharia, S. (2019), Financial integration in Europe through the lens of composite indicators, Working Paper Series, No 2319, ECB, September.
Zooming in on the pandemic, we provide below a timeline of the monetary, fiscal and prudential policy responses alongside public health policies. Following the “historic” low-frequency overview in the previous chart, Chart 11 presents a high-frequency version of the price-based composite indicator of financial integration together with various measures of the severity of the pandemic and a measure of economic activity proxied by industrial production growth (see Borgioli et al., 2020).[87] The sharp financial fragmentation in the euro area at the beginning of the crisis is evident: this is often described as a “dash for cash”, when the demand for money-like instruments spikes at the expense of other assets.
What drove the initial sharp financial fragmentation? The cross-country financial fragmentation in the initial phase of the pandemic can be explained by the fact that the common health epidemic manifested itself quite differently across member countries (see Breitenfellner and Silgoner, 2020; Delatte and Guillaume, 2020; Hernández de Cos, 2021).[88] This was due to uneven speeds of virus contagion, differences in health systems, industrial structures (the balance of more versus less affected sectors) and, notably, differences in public debt levels and the fiscal space available to support the companies and households most affected. In other words, fundamental factors were important, but so too were market dynamics and possible overreactions. In fact, early in the crisis, vulnerable countries’ sovereign spreads relative to Germany widened as a consequence not only of the large expected fiscal costs for stabilising their economies but also of flight to safety into German government bonds, driving down their yields.[89] Still, while persistent, sovereign spreads remained way below the peaks seen during the sovereign debt crisis.
The sequence of events and policy announcements can help us understand why financial fragmentation stopped and then reversed relatively rapidly. The vertical lines in the timeline indicate selected key events and policy measures. The chart confirms the sharp deterioration in financial integration during the first phases of the pandemic; this was driven particularly by public and private bond markets. Risks of financial fragmentation were alleviated by the ECB’s monetary policy interventions, including the early PEPP measures (events 7 and 9). The common European fiscal response was also crucial, including the agreement on European safety nets for jobs, workers and businesses (events 12 and 17) and the creation of the European recovery fund (events 24, 25, 28 and 29). Other significant events include the freezing of corporate bond ratings in the ECB collateral framework (event 16), the ECB’s LTROs at attractive rates, a series of banking supervisory and prudential relief measures, as well as national fiscal authorities’ support programmes for companies and workers affected by lockdowns. Chart 11 indicates that, as of the cut-off date of this report, the level of integration has fully reversed and is even higher than prior to the pandemic. With the exception of the drop in late October 2021, likely driven by changes in inflation expectations and adjustments in financing conditions, financial integration has been resilient to the most recent COVID-19 developments, including the large increase in new cases driven by the new and more contagious variants of the virus.
Chart 11
Euro area price-based financial integration, COVID-19 pandemic developments and events
(daily data, 3 February 2020 – 23 February 2022)
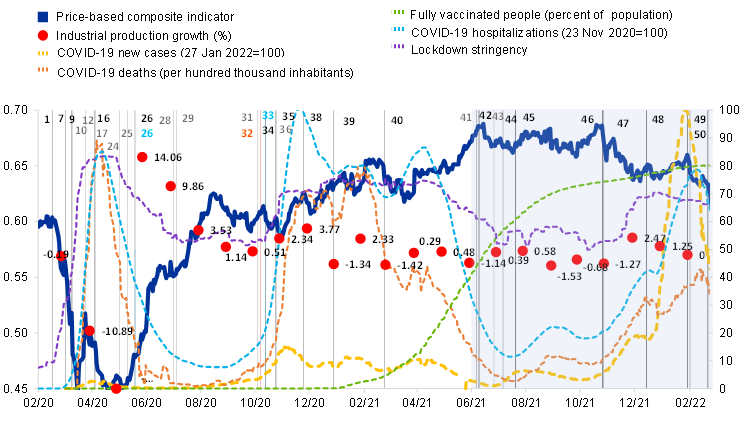
Sources: Price-based composite indicator and industrial production: ECB and ECB calculations; COVID-19 new cases, deaths, fully vaccinated people, hospitalizations, and lockdown stringency index: Our World in Data.
Notes: The price-based composite indicator of financial integration is a high-frequency version (daily readings) of the one by Hoffmann et al. (2019), described in Borgioli et al. (2020). The indicator is calibrated to vary between 0 and 1. The COVID-19 new cases, deaths, and hospitalizations data series are measured as seven day moving averages. Fully vaccinated is the share relative to total population. Industrial production growth (excluding construction) is measured as growth rate to the previous month. Lockdown stringency varies between 0 and 100 (100 = strictest) and is computed as an average of the COVID-19 stringency indexes of all euro area countries, weighted by their 2019 real GDP. It is based on nine response indicators including school closures, workplace closures, and travel bans. PEPP stands for Pandemic Emergency Purchase Programme and SURE for Support to mitigate Unemployment Risks in an Emergency. The chart distinguishes four phases of the crisis, indicated by the grey and light blue shaded areas. The first captures the first wave of infection, with drastic lockdowns and a severe economic downturn (mid-February to early May 2020). The second covers the strong economic rebound when infections had returned to low levels and member countries partly opened up again (early May to mid/late-August 2020). The third spans the severe return of infections in three more waves, but with more targeted lockdowns and a more resilient economy than during the first phase (mid/late-August 2020 to end May 2021). The fourth is characterised by a combination of rising numbers of COVID-19 cases (including Delta and Omicron variants) and a low number of deaths, high vaccination rates and more resilience in financial integration (from late May 2021).
Vertical lines and their numbers mark selected significant events (colours refer to country events: Italy - red, Spain - dark blue, Germany - light blue – or events with euro area-wide relevance: fiscal - light brown, monetary policy and other - black):
1. Closure of Italian schools and universities (4 March 2020), 7. ECB PEPP announcement (18 March 2020), 9. PEPP legal documentation published (25 March 2020), 10. Third European Council with divergent views on coronabonds (26 March 2020), 12. Eurogroup agreement on comprehensive policy response (9 April 2020), 16. ECB collateral rating freeze (22 April 2020), 17. Fourth European Council with endorsement of Eurogroup’s comprehensive policy response and plans for recovery fund (23 April 2020), 24. Franco-German €500 billion European recovery fund proposal (18 May 2020), 25. European Commission €750 billion NextGenerationEU recovery instrument proposal (27 May 2020), 26./26. ECB PEPP expansion and Germany announces major fiscal stimulus package (4 June 2020), 28. Start of special European Council on recovery fund (17 July 2020), 29. End of special European Council on recovery fund with final agreement on size and structure (21 July 2020), 31. First issuance of EU Commission SURE bonds (21 October 2020), 32. S&P upgraded the outlook on the Italian sovereign bond rating from negative to stable (23 October 2020), 33. Germany adopts toughest health restrictions since first lockdown (28 October 2020), 34. ECB hints at December monetary policy stimulus (29 October 2020), 35. BioNTech/Pfizer vaccine announcement (9 November 2020), 36.Second issue of EU Commission SURE bonds (10 November 2020), 38. ECB expands PEPP envelope and announces intention to “preserve favourable financing conditions” (10 December 2020), 39. Announcement of US economic relief package (15 January 2021), 40. ECB temporarily increases PEPP purchases (11 March 2021), 41. Commission successfully placed €800 billion euros of NextGenerationEU bonds (8 June 2021), 42. European Union countries agree to ease travel restrictions over summer (11 June 2021), 43. EU hands out first payments from NextGenerationEU recovery fund (28 June 2021), 44. ECB reformulates inflation goal to 2%, allows overshoot (8 July 2021), 45. ECB extends forward guidance on rates (22 July 2021), 46. ECB Governing Council (28 October 2021), 47. Inflation in the euro area is estimated at 4.1% in October (29 October 2021), 48. Governing Council meeting (16 December 2021), 49. Euro area GDP rose by 0.3% on quarter in the last three months of 2021, slightly less than predicted, after a sharp contraction in Germany's output (31 January 2022), 50. Governing Council follow up from December meeting announcing a gradual reduction of asset purchases and termination of PEPP net asset purchases (3 February 2022) Omitted numbers are relevant events suppressed for readability.
With hindsight, the coronavirus crisis went through a sequence of distinct phases. The above timeline distinguishes four phases of the crisis, indicated by the grey and light blue shaded areas. Phase 1, from 30 January to 25 March 2020, captures the first wave of infections, the sharp lockdown and a severe economic downturn. Phase 2, from 26 March to 7 May 2020, captures the decline in infections, the gradual easing of lockdowns and reopening of countries and the sharp economic rebound. Phase 3, from 8 May 2020 to end-May 2021, captures the surge in infections in three more waves in the wake of declining morbidity rates, the imposition of targeted lockdowns, and economic resilience. Phase 4, starting in early June 2021, is characterised by a combination of the rise in the number of new cases (including the Delta and Omicron variants) together with a low number of deaths, rising vaccination rates and more resilience in financial integration.
3.2 The four main components of the price-based CIFI
The V-shaped move in financial integration at the start of the pandemic is heterogeneous across the four market-specific sub-components (Chart 12). There is a most pronounced V-shaped evolution for the bond market indicator, which declines but then rebounds steadily and resumes its pre-crisis ascent. The banking market sub-index, based on retail bank interest rates, shows a milder V-shape, reflecting the “market centric” rather than “bank centric” impact of the pandemic. The trend was more muted for money markets, revealing resilience, while it exhibited a downward movement for equities. Each component is now discussed in turn.
Chart 12
Sub-indices by market segment
(monthly data, January 1995-October 2021, vertical line marks the start of the pandemic)
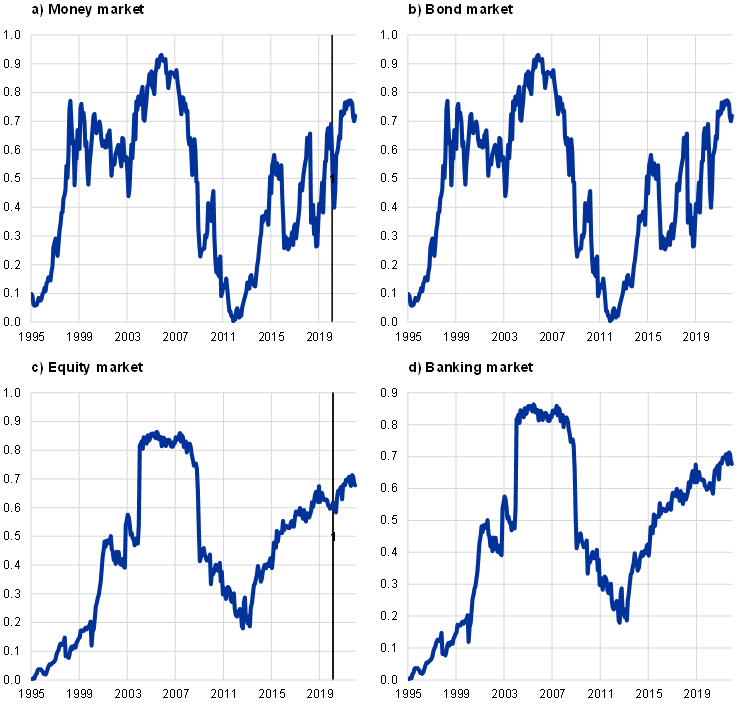
Sources: ECB and ECB calculations.
Notes:
a) The indicator aggregated into the sub-index used to be the cross-country standard deviation of unsecured interbank overnight lending rates based on EONIA rates. With the transition from EONIA to €STR interest rates, data for this indicator from January 2018 now tracks the dispersion in country-level average wholesale euro unsecured overnight borrowing costs of banks located in the euro area as reported for the purposes of calculating the €STR. Data for Greece are excluded to preserve the information content of the indicator.
b) The indicators aggregated into the sub-index are the cross-country standard deviations of two- and ten-year sovereign bond yields (excluding Greece), and the cross-country standard deviation of the bond yields of uncovered corporate bonds issued by non-financial corporations (data are aggregated at country level).
c) The indicators aggregated into the sub-index are the segmentation index and the absolute value of the difference between the cross-sectional dispersions in sector and country index returns. Data for Greece are included.
d) The indicators aggregated into the sub-index are the cross-country dispersions of interest rates on new loans to households (for consumer credit and total loans) and non-financial corporations, and the cross-country dispersions of deposit rates for households and non-financial corporations on deposits with agreed maturity. Data for Greece are included.
Money markets
Forceful liquidity provision to banks through central bank refinancing operations and outright bond purchases swiftly contained the dash for cash at the onset of the pandemic and ensured smooth conditions in money markets subsequently. The money market sub-indicator reflects integration trends only in the unsecured overnight segment and captures the cross-country dispersion of the national components of the euro short-term rate (€STR) (Chart 12, panel a).[90] From its inception in October 2019, the €STR fluctuated in a narrow range between ‑58 and ‑51 basis points. The pandemic outbreak led to a dash for cash, which caused MMFs to hoard cash in overnight bank deposits and the €STR to temporarily rise to ‑51 basis points at the very start of the crisis. In contrast, the commercial paper (CP) market was hit hard, with yields rising as demand for longer maturities evaporated. The large provision of central bank liquidity swiftly alleviated the demand for liquidity buffers and gradually restored smooth conditions in the unsecured segment, although CP issuance has remained subdued since then.
Chart 13
(Daily transactions flows in EUR billion; average over one quarter; 2016 Q3-2021 Q4)

Source: Money Market Statistical Reporting (MMSR) data.
The secured segment proved resilient throughout the crisis and was able to accommodate the demand for cash and high-quality securities. While activity in the unsecured segment remained overall subdued and stable over the last two years, with a trading shift towards shorter maturities during the pandemic, secured borrowing increased, with repo transactions continuing to dominate euro money market activity (Chart 13). Cleared transactions acted as a safe harbour. Dispersion of repo rates across collateral issuer countries continued to decline in 2019-20, before re-opening in the course of 2021. As the spread between the repo rates of different collateral jurisdictions and the ECB’s deposit facility rate is sensitive to the availability of government bonds (Chart 14), the Eurosystem collateral easing measures and securities lending programme proved helpful in alleviating collateral scarcity.
Chart 14
Repo market: secured overnight rates
(Country of collateral issuer; in percentages; daily data; 1 January 2017-28 February 2022)

Source: MMSR.
Notes: Secured rates exhibit considerable seasonality at reporting dates. This is due to regulatory constraints and levies that incentivise commercial banks to limit the amount of deposits on their balance sheet at reporting dates and retain high-quality securities to improve reported regulatory ratios. Examples of incentives to minimise cash holdings and maximise high quality securities at year end include: contributions to the single resolution fund (SRF) and deposit guarantee schemes (DGS); G-SIB scoring; (over) fulfilment of regulatory ratios that are being phased in, such as MREL (phased in from 2020 on); the leverage ratio (implemented in 2021 but with exemptions); the NSFR; taxation and levies (depending on jurisdiction).
Bond markets
The bond market sub-indicator exhibits the most pronounced V-shaped movement of all the segment indicators (Chart 12, panel b). Euro area periphery spreads increased at the start of the pandemic, contracted subsequently as financial conditions eased and then remained stable, benefitting from the Eurosystem asset purchases and the joint funding for recovery spending through the Support to mitigate Unemployment Risks in an Emergency (SURE) and NextGenerationEU (NGEU) programmes (Chart 15). Market participants perceived these programmes as lowering the funding needs of domestic Debt Management Offices (DMOs). The relatively stable spread may, however, be partially conditional on Eurosystem purchases and the overall low level of interest rates, so some widening may be seen when monetary policy accommodation is removed.
A “home bias” towards holding domestic financial assets continues to be an important phenomenon in the euro area. This generates economic inefficiencies by reducing cross-border portfolio diversification and risk sharing. Two boxes discuss reasons for the “home bias” in euro area debt holdings and ways to tackle it, including for green securities. Box 3 assesses the extent to which frictions in the existing debt issuance process produce home bias in debt holdings. The analysis suggests that further reducing transaction costs by harmonising aspects of the debt issuance process, amongst other things, can foster cross-border portfolio diversification. Box 4 illustrates that the green bond market currently displays a higher degree of integration across the euro area than the non-green bond market. However, as soon as domestic green securities are offered, a “green home bias” emerges, reducing the degree of integration over time. Two types of action are needed: to address national differences in insolvency rules, investor protection and taxation; and to advance financial entities’ sustainability disclosure requirements, address the risk of greenwashing and set harmonised standards.
Chart 15
Sovereign risk premium over Germany
(basis points; daily data; 1 January 2020-11 March 2022)
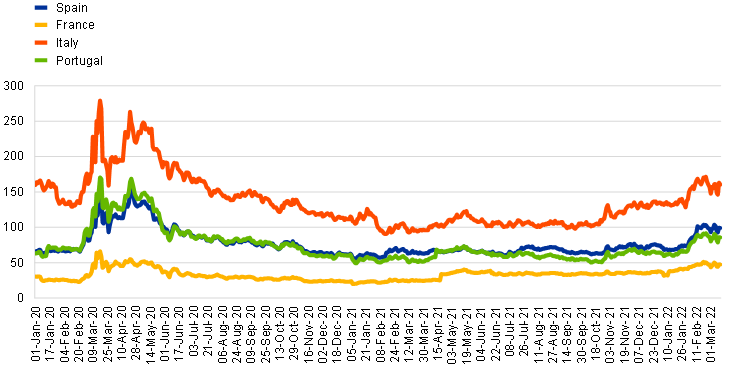
Source: ECB
Note: 10-year government bond yield spreads of selected euro area countries over Germany.
Box 3
Frictions in debt issuance procedures and home bias in the euro area
Frictions in the European Union (EU) debt issuance process could result in allocative inefficiencies, which are associated with higher home bias. In a truly integrated financial market, the issuance, trading, clearing and settlement of a financial instrument should not be affected by the location of the instrument itself or of the counterparties involved in the transaction. However, the European financial market is characterised by complex practices and procedures, along with fragmentation along national borders or along specific channels used for issuance and distribution.[91] As such, the location of issuance could also have an effect on the holdings of debt instruments, which this box aims to analyse further. Specifically, this box assesses the extent to which frictions in the existing debt issuance process produce economic inefficiencies that could affect initial debt distribution and ultimately home bias in debt holdings, with consequences for overall financial integration.
To measure frictions, we focus on transaction costs, which are proxied by links established between central securities depositories (CSDs) allowing for a more efficient post-trading process and in turn reduced costs. Transaction costs cannot be observed directly, but CSD links can serve as a proxy covering some aspects of transactions costs. They allow for a more efficient post-trading process, thus decreasing overall clearance and settlement costs for the investor.[92] More generally, CSDs are mainly responsible for securities settlement and custody and are involved in the process of issuing new securities via their notary service, thus ensuring the integrity of the securities issued. To facilitate cross-border investment, local (national) CSDs can set up legal arrangements (known as links) with other CSDs to allow for the smoother transfer of securities, without requiring their clients to be direct participants in another CSD. In addition, if investors were to hold a bond in a country where their local CSD had no established link, they would face higher transaction costs – a disincentive to cross-border investment. Other ways to facilitate cross-border issuance and distribution, such as through custodian networks, are not captured in the analysis.[93]
Euro area CSDs have established a diverse network of 111 links in total (Chart A). The data on CSD links come from the European Central Securities Depositories Association (ECSDA) and are based on a survey among its members providing a snapshot of all country-pair CSD links among ECSDA members in the EU for the year 2016.[94] The analysis focuses on outbound links, which are securities accounts maintained by local CSDs at a foreign CSD on behalf of their clients.[95] The number of links between CSDs differs across countries; we exploit this difference in our analysis (see below). The two international CSDs, Euroclear Bank and Clearstream Banking Luxembourg, together with the German CSD Clearstream Banking in Frankfurt, have the largest number of outbound links, whereas the CSDs in Finland, Slovakia and Slovenia do not have any outbound links but allow inbound links from foreign CSDs.
Our analysis focuses on home bias as a measure of economic inefficiency, also leading to lower integration, to evaluate whether investors tend to hold a disproportionate share of domestic assets in their portfolio. In contrast to the general home bias literature, we do not use an aggregate home bias per country. Instead, following Fidora et al. (2017)[96], we determine home bias on a bilateral basis from the perspective of the investor country. Bilateral home bias compares (i) an investor country’s actual holdings of foreign bonds issued by the issuer country with (ii) the share of the issuer country’s bonds in total euro area bonds. For example, if investor country A holds a share of 50% of the issuer country B’s bonds, but this issuer country B has a share of 60% in euro bonds, the bilateral home bias between these countries is positive. The data for bilateral home bias come from the Securities Holdings Statistics (SHS) database for the period 2014 to 2020. This dataset allows us to identify both the holding entities’ location and the location of issuance to compute bilateral home bias measures.
Chart A
Stylised euro area central securities depositories network
Outbound links in 2016
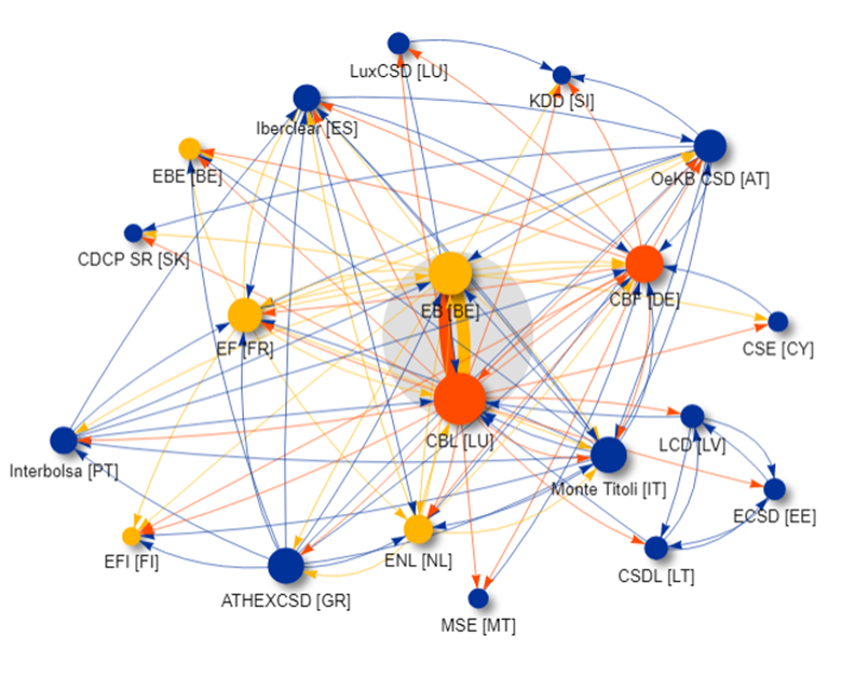
Sources: ECSDA (2016) and ECB calculations.
Notes: The chart shows the network of euro area CSD links that are covered in ECSDA (2016). Some countries have additional CSDs, but these are operated for example by national central banks that are not ECSDA members and are therefore not included in this chart. Ireland does not have a CSD but was covered by the UK CSD (Euroclear UK & Ireland) until 2021.The arrows represent the direction of the link, i.e. from an investor CSD to an issuer CSD (outbound link). In 2016, there were a total of 111 links between euro area CSDs, of which 69 were direct and 42 were indirect or relayed links. Each EA CSD is represented by a circle, the size of which depends on the number of links the CSD has, i.e. the more outbound links a CSD has, the larger the circle is. CSDs belonging to the Euroclear group are denoted by a yellow circle and those belonging to the Clearstream group by an orange circle, while CSDs with blue colouring do not belong to any specific group. The shaded area in the middle of the diagram encompasses the two international central securities depositories (ICSDs) of the euro area, Euroclear Bank (BE) and Clearstream Banking Luxembourg. This highlights the strong link between the two, which takes the form of the “Bridge” (a communication platform facilitating the settlement between the two counterparties). For country pairs with multiple CSDs, the closest link for the specific country pair is included in the analysis.
OeKB CSD = Oesterreichische Kontrollbank Aktiengesellschaft CSD; EB = Euroclear Bank; EBE = Euroclear Belgium; CSE = Cyprus Stock Exchange; CBF = Clearstream Banking AG Frankfurt; ECSD = Estonian CSD; EFI = Euroclear Finland; EF = Euroclear France; ATHEXCSD = Hellenic CSD; LCD = Latvian Central Depository; CBL = Clearstream Banking Luxembourg; CSDL = Central Securities Depository of Lithuania; MSE = Malta Stock Exchange; ENL = Euroclear Netherlands; KDD = Central Securities Clearing Corporation; CDCP SR = Central Securities Depository of the Slovak Republic.
Exploiting the variation in CSD links across euro area countries and employing cross-section and panel estimations, we find that higher transaction costs increase home bias. Our empirical model, which assesses whether lower transaction costs (in the form of CSD links) affect integration (measured by home bias), controls for other factors that could simultaneously affect home bias. These include information costs, proxied by distance between two countries, closeness of economic ties, proxied by common border and bilateral trade, and diversification motive, proxied by GDP correlation, as well as issuer and investor country fixed effects to control for country-specific effects. Given the limited number of changes in the CSD links network and the lack of a full time series, we employ a cross-section analysis for each year and a panel estimation for 2014-2020 using the CSD links for 2016.[97] We find that having a link reduces home bias by about 15 percentage points on average, with the size of the reduction ranging from 3 percentage points to 25 percentage points depending on the model specification (Table A).
Table A
Effect of CSD outbound links on bilateral home bias by bond market segment and year
(basis points)
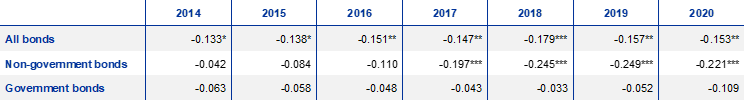
Source: ECB staff calculations.
Notes: The table shows the results from a logit regression on bilateral home bias. Besides the effect of outbound links (direct and indirect) on bilateral home bias, the regression also accounts for other covariates, namely bilateral trade, GDP correlation, distance and common border (not depicted in the table). The regression also includes issuer and investor country fixed effects. The definition of government bonds is based on the classification in the SHS database and includes bonds issued by central, state and local government, whereas non-government bonds are the remaining bonds and include bonds issued for example by financial institutions or non-financial corporates. The coefficients suggest that CSD links are more relevant for the non-government segment, which drives the overall results. The *, ** and *** reflect significance at the 10%, 5% and 1% levels respectively.
Transaction costs seem to play a larger role for non-government bond markets compared with government bond markets. The market size of the government segment is similar to that of the non-government bond segment in the period to 2020. However the sizes of individual government bond issuances are larger than those of non-government bond issuances. Applying this distinction reveals that results are mainly driven by non-government bonds, suggesting that CSD links matter more for non-government bond markets. This suggests that home bias in government bonds seems to be driven less by transaction costs and more by other factors.
The results do not change significantly when a range of robustness checks are conducted. The relationship between CSD links and home bias could also run the other way around: countries with larger capital flows are ex ante more likely to establish links, so that lower home bias leads to more CSD links. To alleviate these concerns over reverse causality, we use a method to account for factors that would make it more likely that a CSD link between two countries exists. We thus implement a “matching of groups” procedure to ensure that both the treatment group (country pair with a CSD link) and control group (country pair without a CSD link) consist of country pairs with similar bilateral capital flows and similar-sized bond markets, so that the CSD link is the only relevant distinction between the two groups.[98]
From a policy perspective, the analysis suggests that further reducing transaction costs and inefficiencies by harmonising aspects of the debt issuance process can help reduce (bilateral) country home bias, thereby fostering European integration. A large body of literature reveals that cross-border diversification of portfolios, implying lower home bias, can benefit investors and facilitate risk sharing across countries.[99] Initiatives to harmonise other aspects of financial markets, such as the SCoRE initiative[100], are showing how this can enable integration, while harmonisation to tackle fragmentation is also an important part of the European Commission’s capital markets union agenda.[101]
Box 4
Home bias in green bond markets
The rapid growth of the European green bond market can help foster the transition to a more sustainable economy. In addition, financing the climate transition could also help to drive further financial integration of European Union (EU) capital markets.[102] It can be expected that these markets will grow given the European Commission’s plan to issue up to €250 billion of green bonds between mid-2021 and 2026 as part of the EU recovery fund, NextGenerationEU. European policymakers have expressed their hope that this market could help foster broader-based capital market integration in the euro area.[103]
Against this background, and given that the level of integration in green bond markets has not yet been explored in detail, this box compares green bond market integration across all euro area sectors and zooms in on the green bond holdings of the euro area banking sector. To assess whether the degree of integration in the green bond market differs from that in the non-green bond market, we first compare home bias[104], a quantity-based indicator for fragmentation, in the green versus non-green bond markets. This is done for the investments of all euro area sectors[105] and for those of the banking sector separately. Once we establish that home bias significantly differs across these two markets, in a second step we aim to understand what drives lower home bias in green bond markets. In particular, we consider whether the lower home bias is driven by shortages in the domestic supply of these bonds because green bond markets are in the early stages of their development.
The analysis is based on the quarterly granular bond-level sectoral holdings data of all euro area investors, for the period from the fourth quarter of 2013 to the third quarter of 2021. The data for sectoral home bias come from the Securities Holdings Statistics by Sector (SHSS) database, and green bonds are identified on the basis of Bloomberg’s green bond label data.
The comparison of the two markets reveals that the green bond market currently displays a higher degree of integration across the euro area than the non-green bond market. However, green home bias is on an upward trend, suggesting that green bond markets are generally becoming less integrated over time. We show that euro area investors have a significantly lower level of home bias in their green bond portfolios compared with their non-green bond market portfolios, implying that green bonds issued in the euro area are more likely to be held cross-border by euro area investors than non-green bonds issued in the euro area. Assessing the level of integration for two different subsamples, i.e. across all euro area investors and for the euro area banking sector, the results point in the same direction in both cases, but with differing magnitude (see Table A). Comparing home bias measures over time, the analysis reveals an upward trend in green home bias (i.e. less integration) for the two subsamples.[106]
Table A
Home bias in green bonds versus the non-green bond market
(total for the period Q1 2014-Q3 2021)

Sources: Securities Holding Statistics, ECB staff calculations.
Notes: The columns headed “All euro area investors” and “Banking sector” show whether there is a statistically significant difference in green bond and non-green bond portfolio home bias at the country level. Investor home bias is calculated as 1 minus the share of the investor's actual foreign bond holdings (numerator) over the optimal foreign holdings share (denominator). The optimal share is the market weight of all euro area countries seen from the viewpoint of the investor’s country, which is computed as the share of foreign bonds in total euro area bonds. Our sample comprises euro area holders and euro area denominated bonds. The green bond home bias measure only takes into account green bonds, both for the numerator and denominator of the measure. Likewise, the non-green bond home bias measure only considers non-green bonds. The means and standard deviations for each segment are calculated across the Q1 2014-Q3 2021 period.
The “Comparison test” row shows the p-value. Results indicate that there is a significant difference in home bias between the green and non-green bond market across all euro area investors and for the euro area banking sectors. Here we present the results from a standard t-test to test for differences in means. However, the Wilcoxon Signed Rank test, which is a non-parametric test particularly suitable for non-normally distributed data (which is the case for some sample year observations) also confirms the significant difference in home bias between the green and non-green markets. As such, the table shows that in both sectors there is a clear and significant difference between the average home bias in the green and non-green markets (0.16 vs 0.49 for all euro area investors and 0.24 vs 0.59 for the banking sector).
An empirical analysis reveals that investors in countries entirely invested in foreign green bond markets due to lack of domestic supply turn to their home market as soon as green bonds become available domestically. Given that investors typically have a preference for their home countries’ assets,[107] we assess whether it is the lack of domestic supply that forces investors to look across borders for green bonds. To check this hypothesis, we employ a fixed effects panel estimation for the aggregate market.[108] The model[109] reveals that investors turn to their domestic green bond markets as soon as these markets become available, as revealed by the positive and significant relationship between domestic green bond market development and home bias (see column 1 of Table B).
Table B
Green bond home bias and supply constraints for all euro area sectors
(Q4 2013-Q3 2021)
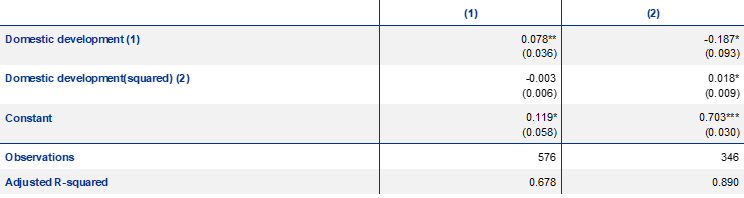
Sources: Securities Holding Statistics, ECB staff calculations.
Notes: Domestic development is the share of domestic green bond issuance over the total domestic issuance. Both specifications include country and time fixed effects (quarterly). Specification (1) captures all country quarter observations, irrespective of whether countries have developed a domestic green bond market (in cases where no market exists, home bias amounts to zero for the specific country-quarter observation), as long as these countries invest in the green bond market abroad in the respective quarter. Specification (2) only considers observations for countries that have already developed a domestic green bond market in the respective quarter. The specification is weighted by the domestic green bond market share, which is equivalent to a country's share in the aggregate euro area green bond market. The *, ** and *** reflect significance at the 10%, 5% and 1% levels respectively.
However, after this initial rise, home bias then increases only slowly as the domestic market develops. This suggests that generally positive integration (lower home bias) of green bond markets only diminishes gradually as domestic markets continue to gain in size. To assess whether dynamics change once domestic markets become available, we run the same fixed effects panel estimation, again positing a non-linear relationship between domestic green bond market development and home bias, and weighting the sample by a country’s share in the aggregate euro area green bond market.[110] The model, which now only considers countries that have already developed a domestic green bond market in the respective quarter, reveals that green bond supply becomes less relevant for home bias: each additional year of domestic green bond market development only marginally increases green bond market home bias, suggesting that the initially positive integration effect overall (lower home bias) diminishes only gradually as domestic markets continue to gain in size (see column 2 of Table B).
The findings suggest that while financing the climate transition could help to drive further financial integration, the generally positive integration trend for green bond markets may only be temporary as the fragmentation in underlying capital market structures and lack of standards become a constraint. National fragmentation – for example in the form of national differences in insolvency rules, investor protection and taxation – and green washing can restrict the growth, integration and resilience of green capital as these markets face the same constraints as those that are currently restricting broader capital markets. Efforts to enhance comparability and standardisation, such as the European Commission’s proposal of a European green bond standard built on the EU taxonomy, should (i) provide investors buying these bonds with comparable and verified sustainability information, (ii) enhance investors’ trust that their investments are sustainable and (iii) ultimately reduce the trend towards more fragmentation in the green bond market. Another example is the planned European single access point (ESAP), a capital markets union policy initiative that will make it easier for investors to identify suitable firms and projects on a cross-border basis, thus improving companies’ access to funding and fostering integration. From a policy perspective, it will be important to further advance financial entities’ sustainability disclosure requirements, address the risk of greenwashing and strengthen green capital markets by fostering measures under the EU capital markets union umbrella that are particularly relevant for the development and integration of green capital markets.[111]
Banking markets
Timely targeted refinancing operations and government guarantee schemes were most likely the drivers of the mild reaction to the pandemic visible in banking market integration. The banking markets integration sub-index shows a milder V-shaped movement in the first half of 2020 following the beginning of the pandemic (Chart 12, panel d). The ECB’s targeted refinancing operations and the government guarantee schemes made it possible to preserve funding at favourable conditions and maintain stable bank lending rates across member countries. The varying scope and strength of government guarantee schemes and fiscal support across euro area countries do not seem to have become a source of fragmentation in retail bank lending markets, probably due to continued monetary policy support and the new European fiscal programmes. Integration of the banking markets continues to follow an upward trend, converging to pre-great recession levels.
Equity markets
Euro area equity market re-integration stalled over the last two years, and even moved backwards slightly according to the latest data (Chart 12, panel c). The gap between cross-country and cross-sectoral dispersion increased as the pandemic had a different impact on economic sectors before partly reverting in 2021 as economic activity began to normalise (Statistical Annex Chart 10). Following a short-lived spike at the start of the pandemic, equity market segmentation increased mildly on account of pandemic-related uncertainty (Statistical Annex Chart 13).
3.3 Financial intermediaries’ contribution to financial integration and risk sharing
International integration has a role to play in the euro area’s financial system. By channelling capital into and out of the economy, the financial system affects trends in financial integration.[112] According to a standard view, investors should hold internationally diversified portfolios to benefit from consumption smoothing opportunities. [113] In particular, the portfolio held in a baseline case should reflect shares of world GDP. For example, when European investors account for about 15% of global GDP, then 15% of their wealth should be invested in Europe and 85% outside it. By contrast, an empirical literature has documented significant evidence for home bias, with a much larger share invested domestically (see Boxes 3 and 4). Nonetheless, the standard model for diversification suggests European investors should have substantial holdings in non-European assets.
Two factors hold back cross-border holdings of assets and liabilities by non-investment fund financial intermediaries. First, the euro area is not yet a single political entity with a fiscal union (such as the US, for example), but the product of an Economic and Monetary Union that leaves significant elements of sovereignty at the level of member countries. This has a bearing on cross-border capital flows within the euro area and with outside countries. There is significant evidence for home bias within the euro area (i.e. more investment in domestic assets than can be explained by their share in eurozone GDP). Second, this is related to consumption smoothing opportunities for euro area investors and households. However, there is also the perspective of euro area non-financial corporations (NFCs). A high degree of financial integration may reduce the funding costs of NFCs and foster investment.
Banks retain their common pronounced focus on domestic lending activities. Slightly above 80% of banks’ loans are to domestic non-monetary financial institutions (non-MFIs) (Statistical Annex Chart 17). Monetary financial institutions’ (MFIs) account for a higher share of loans to non-domestic MFIs (albeit falling from 42% at the end of 2019 to 32% in 2021) and of debt securities held by non-domestic MFIs – slightly below 65% since 2019 (Statistical Annex Charts 18 and 19).
Non-banks have reduced some of the home bias in their investments over time, but ICPFs retain disproportionally high domestic asset holdings (Chart 16). ICPFs’ home bias remained particularly dominant in sovereign bond holdings and least pronounced for equity investments.[114] This could be in large part due to regulations requiring matching between insurance liabilities and investments.
Although ICPFs still hold disproportionally high proportions of domestically issued assets, this home bias has continued to decrease over recent years. While a more diversified investment portfolio strengthens sector resilience, shifts towards a higher share of non-EA investments in the PF sector also reduce the funding available to euro area economies.
Chart 16
Non-bank asset holdings by asset type and area
(percentages of total asset type holdings; year)
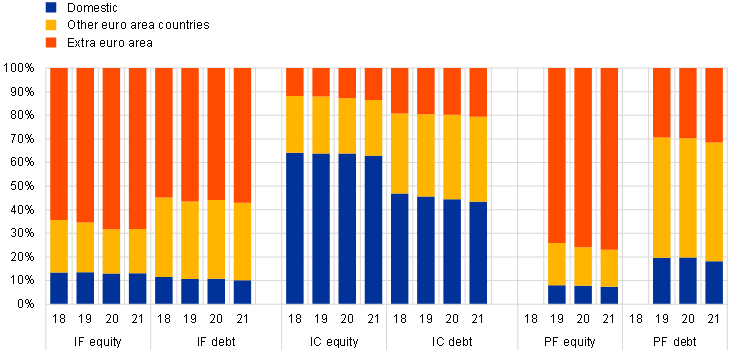
Source: ECB.
Note: Data refers to end of year for 2018-2020 and end of Q3 for 2021.
Progress in facilitating risk sharing through cross-border holdings of liabilities has remained slow among non-bank financial intermediaries as well. As ICPFs continue to target almost solely domestic clients, only IFs facilitate cross-border financing and risk sharing through their liabilities. Around 10% of IC technical reserves and less than 1% of PF claims are held by non-domestic residents, implying only a limited role for the sector in intra-euro area risk sharing (Chart 17).[115]
Chart 17
Non-bank investor base/benefit claims by area and asset type
(percentages of total investment/benefits)
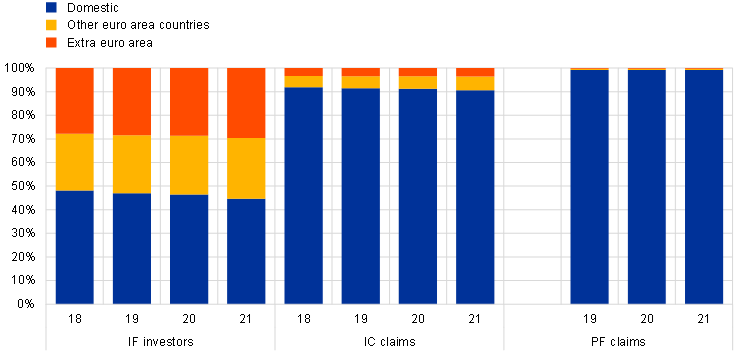
Source: ECB.
Note: Data refers to end of year for 2018-2020 and end of Q3 for 2021.
4 Financial resilience
How resilient is financial integration to large shocks, and how persistent? The discussion above focused on measuring the extent of financial integration, i.e. quantifying it. This section turns instead to the resilience of financial integration, looking at how persistent it is in the face of large shocks. This is a key dimension of the quality of financial integration, which is important for supporting the functioning of the European Economic and Monetary Union. The literature agrees that financial integration through equity investment tends to be more resilient against shocks than integration through debt instruments. Similarly, integration based on debt instruments of longer maturities is less subject to sudden stops (i.e. sharp decreases in gross capital inflows from foreigners) in times of crisis than when shorter maturities predominate.
Overall, equity integration in the euro area has broadly returned to its pre-crisis level, but there are signs it is decreasing. Following a significant drop in the course of 2020, the ratio of intra-euro area cross-border holdings of equities to intra-euro area cross-border holdings of debt instruments has now nearly recovered to the pre-pandemic level (Chart 18, the red line). The rebound observed in the share of intra-euro area cross-border equity holdings was driven by an increase in these investments on account of developments in all sectors except money market funds (the numerator: the blue line). Yet intra euro area foreign direct investment (FDI) as a share of cross-border direct investment and portfolio equity investment has declined sharply over recent years, reaching levels last observed in 2008 and 2010 (Chart 19, the red line). While the pandemic crisis may have contributed to the decline in the indicator, this is a trend that has been observed since 2019. Attention should be paid to fostering high-quality cross-border investment.
Chart 18
Intra-euro area foreign equity investments relative to intra-euro area foreign debt investments
(left-hand scale: EUR trillions; right-hand scale: ratio; Q1 2008-Q2 2021)
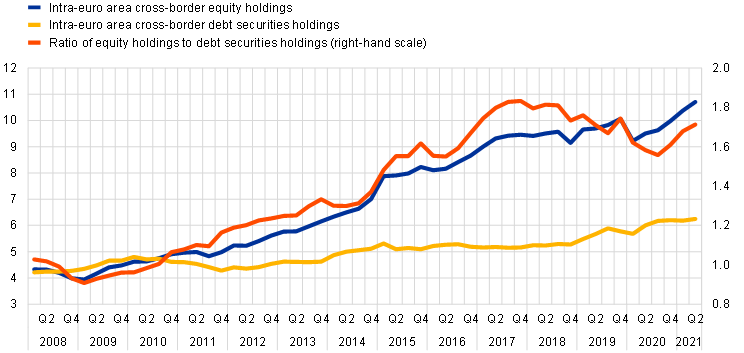
Sources: ECB and ECB calculations.
Notes: Under equity holdings, both portfolio and direct investment holdings are considered. For debt securities, only portfolio investment is considered, since debt securities are not available for FDI (only total "debt instruments"). Even restricting the analysis to portfolio investment only, we still see the rising importance of equities in intra-euro area cross-border holdings. Looking at the sector contribution, we see a general increase in equity holdings for all sectors except money market funds (S123)
Chart 19
Intra-euro area foreign direct investment
(left hand scale: EUR trillions; right-hand scale: ratio; Q1 2008-Q2 2021)

Source: ECB.
Notes: Intra-euro area FDI is calculated as the average of asset and liability positions to account for possible asymmetries. For portfolio investment, only the asset side is used since liabilities are not reported due to the custodial bias.
The quality of debt integration has also deteriorated. Specifically, holdings of intra-euro area cross-border long-term debt instruments have further declined relative to short-term holdings since the onset of the pandemic crisis (Chart 20, the red line). However, this is in line with developments observed since 2014. While intra-euro area cross-border lending reached a record high in the second quarter of 2021, the increase in cross-border retail bank lending was more than offset by the recovery in cross-border interbank lending, which is less resilient. Direct cross-border retail bank lending within the euro area – although it has improved since 2018 – remains limited (Chart 21), pointing to the continued low integration of retail banking markets. Higher cross-border retail lending activities would contribute to increasing the resilience of the European banking sector by allowing further diversification of bank loan portfolios.
Chart 20
Intra-euro area foreign long-term debt investments relative to intra-euro area foreign short-term debt investments
(left-hand scale: EUR trillions; right-hand scale: ratio; Q1 2008-Q2 2021)
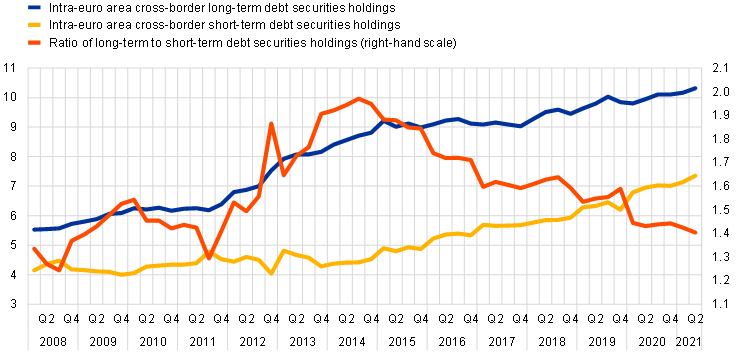
Source: ECB.
Notes: The figures cover not only debt securities liabilities, but also other instruments such as currency deposits and loans (F2 and F4), trade advances and account payables (F81 and F89), insurance, and pensions (F6) and FDI debt instruments (FL). As a convention, F6 and FL are classified entirely as long term liabilities.
Chart 21
Intra-euro area foreign retail bank lending relative to intra-euro area foreign interbank lending
(left-hand scale: EUR trillions; right-hand scale: ratio; Q1 2008-Q4 2021)

Source: ECB.
Notes: The blue line shows the total amount of intra-euro area cross-border bank lending to households and NFCs, i.e. retail bank lending. The yellow line shows the total amount of intra-euro area cross-border lending between MFIs, i.e. interbank lending. The orange line shows the ratio of the two. For more discussion on the interpretation of these indicators, see Special Feature A “Financial integration and risk sharing in a monetary union” in European Central Bank (2016), Financial integration in Europe, Frankfurt, April.
5 Trends in risk sharing in recent years
Despite a common origin, the economic and financial fallout from the COVID-19 crisis has been asymmetric across euro area countries. The increased dispersion (standard deviation) of year-over-year growth rates in real GDP, income, and consumption suggests very heterogeneous effects of the pandemic and thus room for risk sharing (Chart 22).[116]
Chart 22
Dispersion of annual growth rates of real gross domestic product, real gross disposable income and consumption across euro area countries
(quarterly data; Q1 2018-Q3 2021)
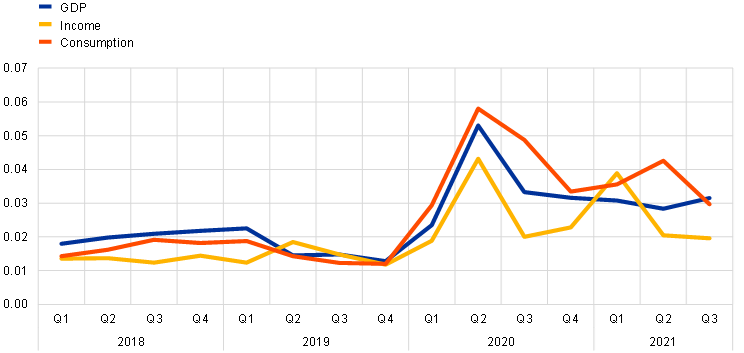
Source: ECB.
For a variety of reasons, it is only possible to offer partial and tentative insights into trends in risk sharing during the COVID crisis. Over the years, the ECB has developed a rich toolkit to examine how risk sharing has evolved.[117] However, several of the key tools have to be estimated with data windows that are significantly longer than the pandemic has been so far. The results therefore mix information from the pandemic with several years preceding it. Moreover, models measuring risk sharing have proven to be relatively sensitive to even small changes in the design of the tools.[118]
The nature of the COVID-19 crisis restricts key private channels of risk sharing, so public risk sharing through governments becomes even more important for macroeconomic stabilisation. In particular, the public health measures and mobility restrictions put in place prevented households from consuming their full standard basket of products and service (durables, transportation, holidays, restaurant meals, entertainment, theatre, museums, etc.). This means that the dynamics of consumption were constrained. Hence standard measures looking specifically at “consumption risk sharing” (i.e., consumption smoothing during shocks, as in Asdrubali et al., 1996) are affected and should be complemented by considering income risk sharing indicators too.[119] At the same time, the risk sharing aspects of public support measures, such as job retention schemes or firm guarantees, may not be accurately reflected in those measures.
The amount of income risk sharing has been relatively stable over recent years, albeit at low levels. Departing from the approach by Lewis (1996) and following Giovannini et al. (2021), we consider a quarter-by-quarter cross-sectional regression of disposable income growth on output growth.[120] Looking at the contemporaneous co-movement between disposable income and output across euro area countries, it appears that overall income risk sharing has been resilient so far throughout this crisis (Chart 23). This is in contrast to the deterioration observed during the great recession and the European sovereign debt crisis. At the same time, the correlation between disposable income and GDP growth is statistically above zero (at a 95% confidence level) for most of our sample period. Thus, the hypothesis of perfect income risk sharing is rejected for almost every time period since the early 2000s.
Chart 23
Co-movement of disposable income and output in the euro area
(percentages; quarterly data: Q4 2003-Q3 2021)
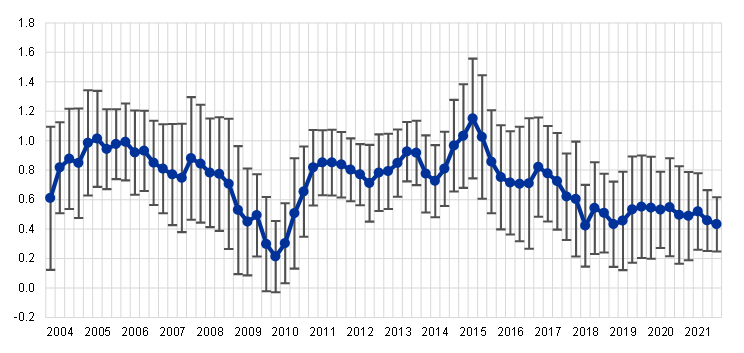
Source: Authors’ calculations using ECB and Eurostat data.
Notes: The chart plots point estimates (dots) and confidence intervals (whiskers) from a panel regression of changes in country per capita gross disposable income on changes in country per capita GDP. Each dot and whisker are estimated for data from the twelve quarters preceding the time indicated on the horizontal axis (rolling window). This implies that for the last observation (Q4 2021) only about half of the information relates to the COVID crisis, and for earlier observations even less. Ireland is excluded due to the major change in its GDP reporting in 2015. The analysis is based on the following countries for which gross disposable income data is available: Belgium, Germany, Greece, Spain, France, Italy, Netherlands, Austria, Portugal and Finland.
Looking at measures of consumption risk sharing, the proportion of unsmoothed country-specific shocks to GDP has been monotonically decreasing, converging towards levels observed prior to 2008. This reveals an improvement in risk sharing, or at least some resilience (Chart 24).[121] In particular, the credit channel – via cross-border borrowing and lending by both individuals and governments – displays an interesting upward trend and is currently the main driver of the increase. The notable strengthening of the credit channel could be explained by the fact that our analysis is based on an 11-year rolling estimation window. This suggests that the negative effects the global financial crisis had on the contribution of the credit channel to consumption risk sharing are starting to wane.[122] The capital channel – primarily via cross-border ownership of productive assets and labour income from abroad – and the price channel – via changes in the domestic consumer price index relative to the euro area average – have become more muted. Box 5 provides a detailed assessment of the capital channel of risk sharing. The fiscal channel, by means of cross-border transfers to both individuals and governments (such as remittances and EU structural funds), is not contributing to risk sharing. The interpretation of developments in the latter channel[123] warrants further analysis, as several innovations were introduced during the crisis to strengthen it (see Giovannini et al., 2021).
Chart 24
Consumption risk sharing in the EA12 (excluding Ireland) and its channels
(percentages; annual data: 2004-2021)
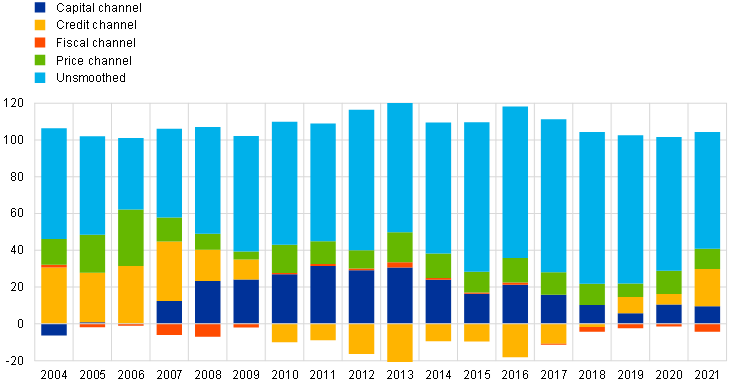
Source: ECB calculations.
Notes: The chart displays, by year, the contribution to the smoothing of country-specific shocks to real GDP growth from capital markets (via cross-border ownership of productive assets), credit markets (via cross-border borrowing and lending), fiscal tools (via public cross-border transfers), and relative prices (via changes in the domestic consumer price index relative to the euro area average index). The respective contributions are calculated using a vector-autoregression (VAR) model whose parameters are estimated over an eleven-year rolling window of annual data, applying the Asdrubali and Kim (2004) approach enhanced for relative price adjustments. The bars display the share of a one-standard-deviation shock to domestic GDP growth that is absorbed by each risk sharing channel. The shares are computed on the basis of the cumulative impact of the shock on the variables capturing each risk sharing channel over a five-year horizon. Year-to-year variations in shares reflect changes in the re-estimated model parameters. The remaining portion represents the portion of the shock to country-specific real GDP growth that remains unsmoothed and is fully reflected in country-specific consumption growth. The individual bars may fall below 0% if one or more of the channels involved has a dis-smoothing effect on country-specific consumption growth. All bars together total 100%. Ireland is excluded due to the major change in its GDP reporting in 2015.
There is an expectation that EU safety nets and the NextGenerationEU (NGEU) scheme are introducing more significant fiscal capacity, and potential for public risk sharing, at the European level. Over the coming years, NGEU can mobilise a funding volume of up to €807 billion at current prices, the equivalent of 6% of 2020 EU GDP.[124] The largest programme within the NGEU, the Recovery and Resilience Facility (RRF), can provide funding to EU Member States in the form of grants of up to €338 billion (2.4% of 2020 EU GDP) and loans of up to nearly €386 billion (2.8% of 2020 EU GDP).[125] Importantly, NGEU allows the EU to issue a significant volume of debt at the European level. The Commission will issue up to €150 billion per year to finance non-repayable grants and loans on favourable terms. All NGEU borrowing will be fully repaid by 2058 from the EU budget using new own resources (e.g. revenues from emissions trading, an EU carbon border adjustment mechanism and corporate taxation) and, if needed, additional national contributions to the EU budget.
NGEU is expected to stimulate fiscal risk sharing, which has been muted to date, and further boost the credit channel, at least for the duration of the programme. First, the allocation key for NGEU funding implies that more will be made available to countries with lower GDP per capita and that have been hit hardest by the pandemic. Almost two-thirds of the RRF funds directed to euro area countries will be absorbed by Italy and Spain, for example. Loans are made available on terms more favourable than market rates for several countries. This redistributive element of NGEU is a strong demonstration of solidarity among Member States. Second, EU debt used to finance NGEU grants and loans is backed jointly by all EU Member States. This implies an additional public, cross-country risk sharing mechanism. Both redistribution and joint debt issuance strengthen the fiscal channel. Third, the capital channel is expected to be strengthened by the cross-country ownership of European bonds. By issuing debt, the EU will become a provider of AAA-rated assets denominated in euro. Beyond fiscal and credit risk sharing, the concrete structural reforms envisaged by NGEU have the potential to enhance the economic resilience of euro area countries, possibly mitigating the impact of asymmetric shocks in the future.
By early 2022, NGEU and its core instrument, the Recovery and Resilience Facility (RRF), had moved from the preparatory phase to implementation. By end-February 2022, the Recovery and Resilience Plans (RRPs) of 22 EU Member States had been adopted with Council implementing decisions, out of 26 plans submitted by all Member States except the Netherlands. The Commission had borrowed €111.5 billion for NGEU financing and pre-financing payments had been made to 21 countries, for a total amount of €56.6 billion. Payments of RRF instalments to Member States had also started, conditional on meeting qualitative milestones and quantitative targets for the planned reforms and investment projects. Of the €401 billion in grants and loans requested by euro area countries, around 30% are expected to be used in 2021 and 2022. RRF funding absorption is expected to peak at 25% in 2023, before falling gradually to below 10% in the last year of the programme in 2026.
While it was designed as a temporary programme in response to the pandemic, the experience with NGEU is expected to have a significant impact on the future debate on fiscal integration in the EU. A more permanent central fiscal capacity could play a key role in enhancing macroeconomic stabilisation in the euro area in the longer run. Whether NGEU will be considered a success, and possibly a blueprint for this capacity, will crucially depend on timely and effective implementation of the reform and investment plans by Member States (ECB, 2022).[126]
Box 5
A deep dive into risk sharing through the capital channel in the euro area – inter- versus intra-regional risk sharing
The coronavirus (COVID-19) crisis has renewed the need for better-integrated capital markets to promote cross-border risk sharing within the euro area.[127] While the pandemic represents a shock common to all euro area countries, its economic consequences are highly asymmetric owing to country-specific factors.[128] In addition to public support measures via fiscal policy to address country-specific effects, private capital markets could continue to mitigate the economic downturn in more severely affected countries and foster their recovery. However, empirical evidence so far suggests that capital markets have played only a limited role and that cross-border financial holdings have made only a weak contribution to risk sharing in the euro area.[129]
Against this background, and following recent policy efforts to promote capital market integration via the capital markets union, this box provides updated evidence of the evolution of cross-border risk sharing in the euro area through the capital channel. Our general empirical setup follows the framework developed by Asdrubali et al (1996)[130], which is based on the decomposition of the cross-sectoral variance of country-specific output growth. This makes it possible to distinguish among different channels of risk sharing, including (i) the capital channel – our main focus – where income is smoothed through income from cross-border investments (this is referred to as “income smoothing”); (ii) the credit channel, where consumption is smoothed through cross-border net borrowing; and (iii) the international transfer channel, with smoothing taking place through supranational fiscal transfers and private remittances.[131] To account for countries’ specificities in a multi-equation dynamic framework, we use quarterly national accounts data and estimate country-specific vector autoregression (VAR) models following, among others, Asdrubali et al. (2018).[132] This allows us to disentangle how income smoothing has differed across euro area country groups. The analysis focuses on ten long-standing euro area countries[133] and investigates the contribution of the capital channel for the period from the first quarter of 2000 to the first quarter of 2021. Our estimates therefore reflect the developments since the great financial crisis (GFC) and account for the first year of the coronavirus (COVID-19) pandemic. At the same time, since our results are based on nine-year rolling windows[134], the estimates associated with one period are also influenced by the preceding nine years.
The countries within our sample show a heterogeneous pattern of cross-border portfolio holdings, which leads us to divide our country sample into two groups. We conduct an analysis of the cross-border portfolio holdings from the Coordinated Portfolio Investment Survey, published by the International Monetary Fund for the ten euro area countries in our sample. Our analysis shows that these holdings differ in terms of both size and evolution. De facto financial integration, measured by total cross-border portfolio assets (containing long-term and short-term debt and equity) as a percentage of GDP, is lower for a group of countries comprising Italy, Spain, Greece and Portugal than for a group of countries comprising Austria, Belgium, Finland, France, Germany and the Netherlands. In our estimates, we therefore distinguish between these two regions, the former country group being referred to as the southern region and the latter as the northern region.
Chart A
Risk sharing via the capital channel
(share of total idiosyncratic shock)
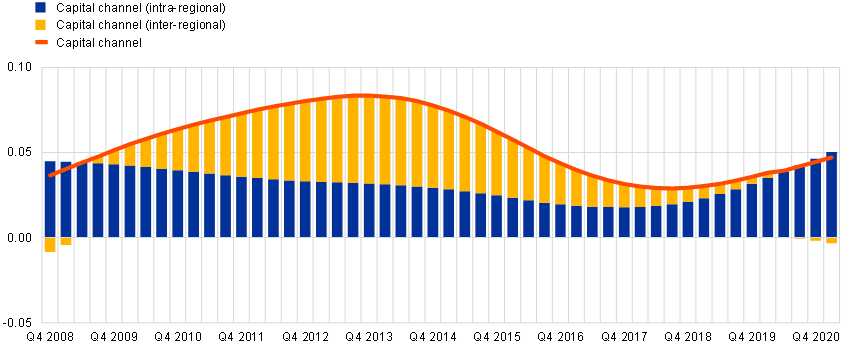
Source: ECB calculations based on Eurostat quarterly national accounts data.
Notes: The solid line indicates the share of the total idiosyncratic shocks that is smoothed out via the capital channel in the ten euro area countries of our sample overall, whereas the bars show the part that is smoothed intra-regionally (i.e. within each of the two regions, blue bars) and the part that is smoothed inter-regionally (i.e. between the two regions, yellow bars). The shares are computed on the basis of the cumulative impact of the shock on the variables capturing the capital channel for the two years after the shock. The contributions of the capital channel are computed using a country-specific vector autoregression (VAR) model. Parameters are estimated over a nine-year rolling window of quarterly data. Therefore, results for Q4 2008, for example, are obtained using a sample covering Q1 2000-Q4 2008. We compute the results for each country and then average over the cross-section using real GDP levels as weights. Qualitative results are robust to estimates without the decomposition of the capital channel.
Overall, risk sharing via the capital channel in the euro area remains rather modest despite a significant improvement after the GFC (Chart A). Our time-varying estimates show that, although it has significantly improved during the last 20 years, the overall smoothing effect facilitated by capital markets is rather modest. By way of comparison, the share of total country-specific shocks to output smoothed by the credit channel was up to five times as large as the corresponding share for the capital channel.[135] In addition, as a novel feature, we distinguish between risk sharing within each of the two country groups, i.e. within each of the two regions (intra-regional risk sharing) and risk sharing across the two regions (inter-regional risk sharing), both at euro area level and separately for the two regions (see next paragraph). The analysis of overall euro area income smoothing (Chart A, solid line) shows that in recent times it has been mainly driven by intra-regional risk sharing (Chart A, blue bars). By contrast, at the beginning of our sample, integration seems to have been higher, as the increase in euro area income smoothing was mainly due to inter-regional risk sharing (Chart A, yellow bars).
Chart B
Risk sharing via the capital channel by country group
(share of total idiosyncratic shock)
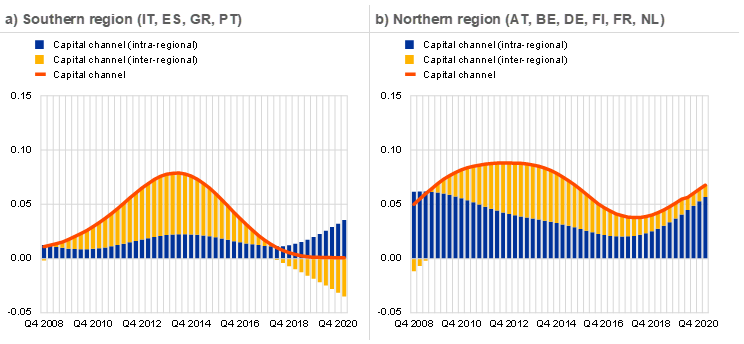
Source: ECB calculations based on Eurostat quarterly national accounts data.
Notes: The solid line indicates the share of the total idiosyncratic shocks that is smoothed out via the capital channel in the southern and northern regions respectively. The bars show the part of the overall capital risk sharing in the southern or northern region that is smoothed intra-regionally (i.e. within each of the two regions, blue bars) and the part that is smoothed inter-regionally (i.e. between the two regions, yellow bars). The shares are computed on the basis of the cumulative impact of the shock on the variables capturing the capital channel for the two years after the shock. The contributions of the capital channel are computed using a country-specific vector autoregression (VAR) model. Parameters are estimated over a nine-year rolling window of quarterly data. Therefore, results for Q4 2008, for example, are obtained using a sample covering Q1 2000-Q4 2008. We compute the results for each country and then average over the cross-section for each of the two regions using real GDP levels as weights. Qualitative results are robust to estimates without the decomposition of the capital channel.
The two regions, southern and northern, show a distinctive pattern both for overall income smoothing and for the extent to which this income smoothing originates in inter- vs intra-regional risk sharing (Chart B). In the southern region, inter-regional risk sharing (Chart B, panel a, yellow bars) drove the improvement in income smoothing in the aftermath of the GFC, but in more recent years risk sharing via capital markets has relied strongly on intra-regional mechanisms (Chart B, panel a, blue bars). Specifically, the decrease in inter-regional risk sharing from the mid-2010s onwards led to a fall in overall income smoothing in the southern region. While intra-regional risk sharing has picked up in recent years, it has not been enough to compensate for the negative contribution of inter-regional risk sharing. By contrast, in the northern region (Chart B, panel b), intra-regional risk sharing fell after the GFC and has only shown a positive trend in recent years. However, it has been at a higher level than intra-regional risk sharing in the southern region. While inter-regional risk sharing has also decreased over the last five years in the northern region, it has not become negative there.
Chart C
Comparison of cross-border intra- and inter-regional financial portfolios in the euro area
(EUR millions)
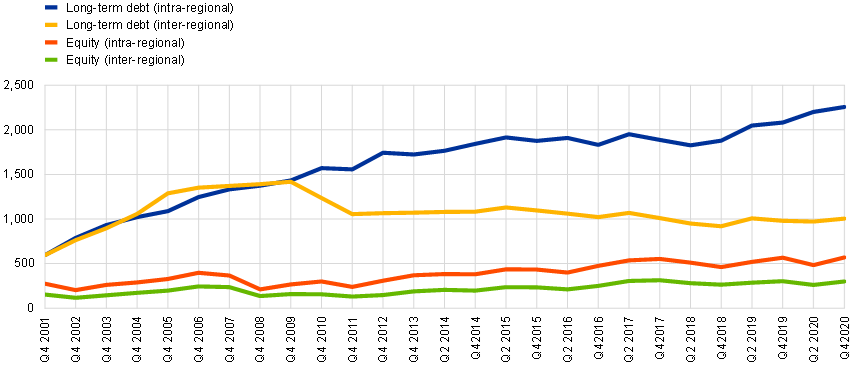
Sources: The International Monetary Fund’s Coordinated Portfolio Investment Survey and ECB calculations.
Notes: Intra-regional financial portfolios include investments within each of the two country groups defined in this box (meaning within the southern region comprising Italy, Spain, Greece and Portugal and within the northern region comprising Austria, Belgium, Finland, France, Germany and Netherlands), while inter-regional portfolios include investments across those two country groups. Data from the Coordinated Portfolio Investment Survey are available from end-2001 until end-2020.
An exploratory analysis suggests that these income smoothing patterns are related to patterns in euro area cross-border financial portfolios (Chart C). In recent years increases in euro area cross-border financial portfolio holdings have relied more on intra-regional holdings than on inter-regional holdings, both for long-term debt and equity. This indicates a need to improve financial integration more broadly within the euro area so that it increases not only within certain country groups but more widely.
Acknowledgements
The Financial Integration and Structure in the Euro Area report is based on regular surveillance activities, analysis and findings from discussions with market participants and academic researchers.
The preparation of the report was coordinated by Philipp Hartmann (DG-R; Coordinator of the Committee on Financial Integration (CFI)) and Philippe Molitor (DG-MF; CFI Secretary) and benefitted from input, comments and suggestions from the ECB’s Directorate General Macroprudential Policy and Financial Stability, Directorate General Research, Directorate General International and European Relations, Directorate General Statistics, Directorate General Market Operations, Directorate General Horizontal Line Supervision, Directorate General Monetary Policy and Directorate General Economics. Comments from members of the Eurosystem Financial Stability Committee are gratefully acknowledged.
The report was endorsed by the Governing Council on 1 April 2022.
Its contents were prepared by Philipp Hartmann, Francesco Paolo Mongelli and Philippe Molitor with valuable input from:
DG-MF: Alexandra Born; Olimpia Carradori, Katharina Cera; Melanie Chaves; Manuela Storz; Claudia Lambert; Michael Wedow;
DG-R: Toni Ahnert; Sarah Mouabbi; Melina Papoutsi; Ana Sofia Pessoa; Jean-David Sigaux; Annachiara Tanzarella;
DG-S: Stefano Borgioli; Urszula Kochanska; Chiara Lelli;
DG-I: Alessandro Giovannini; Donata Faccia; Hanni Schölermann;
DG-HOL: Malte Kristian Jahning; Marie Lafontaine; Massimo Libertucci; Maria Jose Romero Rico;
DG-M: Carolina Alice D’Ambrosio; Maria Encio;
DG-E: Jacopo Cimadomo; Maximilian Freier; Nico Zorell;
D-SSR: Natalia Martín Fuentes.
Non-ECB contributors to boxes:
Franziska Bremus (DIW Berlin);
Wieger Kastelein (De Nederlandsche Bank);
David Cesar Heymann (Bocconi University);
Anouk Levels (De Nederlandsche Bank);
Christian Mücke (Goethe University Frankfurt).
With additional contributions from Jérôme Henry, Lieven Hermans, Franziska Huennekes, Rocco Incardona, Manfred Kremer, Georgi Krustev, Carmen Picon-Aguilar and Mika Tujula.
© European Central Bank, 2022
Postal address 60640 Frankfurt am Main, Germany
Telephone +49 69 1344 0
Website www.ecb.europa.eu
All rights reserved. Reproduction for educational and non-commercial purposes is permitted provided that the source is acknowledged.
For specific terminology please refer to the ECB glossary (available in English only).
PDF ISBN 978-92-899-5237-8, ISSN 1830-7159, doi:10.2866/288287, QB-AJ-22-001-EN-N
HTML ISBN 978-92-899-5238-5, ISSN 1830-7159, doi:10.2866/525604, QB-AJ-22-001-EN-Q
European Central Bank (2020), Financial integration and structure in the euro area, Frankfurt, March.
In view of vulnerabilities revealed during the March 2020 market turmoil, there is a need for authorities to take a holistic and system-wide approach, consider the role of different players, and assess and design policies to address the structural vulnerabilities in the non-bank financial sector. See Holistic Review of the March Market Turmoil, Financial Stability Board, 17 November 2020; ECB Financial Stability Review, November 2021, Section 5.2.2 Strengthening the policy framework for non-banks.
This package contains four follow-ups to the 2020 action plan. See European Commission (2021), Capital Markets Union: Commission proposes new measures to boost Europe's capital markets, press release, Brussels, 25 November.
See Towards a green capital markets union for Europe, speech by Christine Lagarde, President of the European Central Bank, Frankfurt am Main, 6 May 2021; and Born, A., Giuzio, M., Lambert, C., Salakhova, D., Schölermann, H. and Tamburrini, F. (2021), Towards a green capital markets union: developing sustainable, integrated and resilient European capital markets, Macroprudential Bulletin, Issue 15, ECB.
See European Court of Auditors (2022), Investment funds - EU actions have not yet created a true single market benefiting investors, special report 04, Luxembourg, 21 February.
See, for example, the pre-IPO risk capital indicator published by the Association for Financial Markets in Europe (2021), Capital Markets Union: Key performance Indicators – Fourth Edition, October.
For example, CB Insights’ 2020 Global CVC Report suggests that Europe is lagging the United States and Asia also in corporate venture capital.
The European system of accounts (ESA 2010) defines the instruments included in Charts 1 and 2 as follows: Equity is a financial asset that is a claim on the residual value of a corporation, after all other claims have been met. Listed shares are equity securities listed on an exchange. Such an exchange may be a recognised stock exchange or any other form of secondary market. Listed shares are also referred to as quoted shares. The existence of quoted prices of shares listed on an exchange means that current market prices are usually readily available. Unlisted shares are equity securities not listed on an exchange. Other equity comprises all forms of equity other than those classified in the sub-categories listed shares and unlisted shares. In particular, it includes all forms of equity in corporations which are not shares, including the following: (1) the equity in incorporated partnerships subscribed by unlimited partners; (2) the equity in limited liability companies whose owners are partners and not shareholders; (3) the capital invested in ordinary or limited partnerships recognised as independent legal entities; (4) the capital invested in cooperative societies recognised as independent legal entities.
Banks let companies drew elastically on credit lines during the initial stages of the crisis, playing the valuable role of “elastic nodes” in the financial system (see Aramonte S., Schrimpf, A. and Shin, H.S. (2021), “Non-bank financial intermediaries and financial stability”, BIS Working Papers, No 972, Basel, October).
European Central Bank (2021), “Non-financial corporate health during the pandemic”, Economic Bulletin, Issue 6, Frankfurt, September.
Recovery in entries was not uniform across countries, however. See: Criscuolo, C., “Productivity and Business Dynamics through the lens of COVID-19: the shock, risks and opportunities”, paper presented at the ECB Forum on Central Banking 2021
Compared to 2019, it increased by EUR 0.6 trillion and represents a 0.35 times larger share relative to GDP.
See also “Europe needs a fully fledged capital markets union – now more than ever”, ECB Blog post by Luis de Guindos, Vice-President of the ECB, and Fabio Panetta and Isabel Schnabel, Members of the Executive Board of the ECB, 2 September 2020.
European Commission (2021), “The EU economy after COVID-19: implications for economic governance”, Communication from the European Commission, COM(2021) 662 final, Strasbourg, October..
European Commission (2021), “The EU economy after COVID-19: implications for economic governance”, Communication from the European Commission, COM(2021) 662 final, Strasbourg, October.
Disbursements by NextGenerationEU will run until 2026.
See Bongini, P., Ferrando, A., Rossi, E. and Rossolini, M. (2021), “SME access to market-based finance across Eurozone countries”, Small Business Economics, vol. 56(4), pp. 1667-1697l; Hsu, P., Tian, X. and Xu, Y. (2014), “Financial development and innovation: Cross-country evidence”, Journal of Financial Economics, Vol. 112, No 1, pp. 116-135.
See Aghion, P., Boneva, L., Breckenfelder, J., Laeven, L., Popov, A., Olovsson, C., and Rancoita, E. (2022), “Financial markets and green innovation”, ECB Discussion Paper, forthcoming.
See Bongini, P., Ferrando, A., Rossi, E. and Rossolini, M. (2021), “SME access to market-based finance across Eurozone countries”, Small Business Economics, vol. 56(4), pp. 1667-1697l; Hsu, P., Tian, X. and Xu, Y. (2014), “Financial development and innovation: Cross-country evidence”, Journal of Financial Economics, Vol. 112, No 1, pp. 116-135.
See e.g. De Haas, R. and Popov, A., (2021), “Finance and Green Growth”, EBRD Working Paper, No 217, London.
See Kortum, S. and Lerner, J., (2001), Does venture capital spur innovation?, Emerald Publishing Limited, Bingley.
Romain, A. and van Pottelsberghe, B., (2004), “The Economic Impact of Venture Capital”, Discussion Paper Series 1: Economic Studies, No. 18/ 2004, Deutsche Bundesbank, Frankfurt.
See De Haas, R. and Popov, A. (2019), “Finance and carbon emissions,” Working Paper Series, No 2318, ECB, September.
Mazzucato (2021) defines a mission as a cross-sectoral innovation and investment programme conducted in cooperation between the state, economy, society and science. See Mazzucato, M. (2021) Mission Economy: A Moonshot Guide to Changing Capitalism, Allen Lane, London.
Private equity is equity capital provided to enterprises not quoted on a stock market. It includes the following stages: venture capital, growth capital, replacement capital, rescue/turnaround and buyouts. Venture capital is a subset of private equity and refers to equity investments made for launch (seed), early development (start-up), or expansion (later stage venture). For further details see www.investeurope.eu/research/.
See Copenhagen Economics (2021), “Study on Equity Investments in Europe: Mind the Gap”, European Commission, Brussels, February.
Botsari, A., Kiefer, K., Lang, F. and Pal, K. (2021), “Scale-Up Financing and IPOs: Evidence From Three Surveys”, Working Paper 2021/69, EIF Research & Market Analysis, Luxembourg, January.
See Oxera (2020), Primary and Secondary Markets in the EU, European Commission, Brussels, November.
Kraemer-Eis, H., Botsari, A., Gvetadze, S., Lang, F. and Torfs, W. (2019), “European Small Business Finance Outlook”, Working Paper 2019/61, EIF Research & Market Analysis, Luxembourg, December; Copenhagen Economics (2021); The 2020 Global CVC Report, CB Insights Research, New York, March.
See Copenhagen Economics (2021); Lakestar (2021), “The 2 Trillion German Financing Gap”, Zurich, December.
European Commission (2018), “VentureEU: Pan-European Venture Capital Funds-of-Funds programme”; and “Capital Markets Union: unleashing Europe’s potential”, speech by François Villeroy de Galhau, Governor of the Banque de France, Paris, 30 November 2021.
Consolidated balance sheet data coupled with a minimum ownership share threshold of 25% are used to approximate a who-to-whom breakdown for listed, non-listed and other euro area NFC equity – a dissection until now unavailable in euro area financial accounts statistics except for listed equity.
NACE codes C, M and G.
Consistent with the definition of “Other equity F.519” in ESA 2010, this includes the equity of partnerships, cooperative companies, branches and foreign companies.
Financial corporations include banks and investment funds, other financial intermediaries (OFIs), insurance companies (ICs), pension funds (PFs) and mutual funds (MFs), private equity funds (PEs) and venture capitalists (VCs).
OFIs include all financial corporations that are not categorised as Banks and IFs, PFs, MFs, ICs, PEs or VCs.
Foundations and research institutes tend to have a long-term investment horizon and be keen to finance growth-enhancing innovative projects. They are in a position to commit capital to long-term, closed-ended funds and eager to invest in the start-ups and scale-ups these funds support.
The 2020 Global CVC Report.
See footnote Error! Bookmark not defined..
When selecting entities at a consolidated level, PEs and VCs emerge as ultimate owners for less than 1% of the equity of the target euro area NFCs with known ultimate owners. ORBIS does not fully analyse every intermediate ownership link within the fund-of-funds structure.
Stakes taken indirectly, e.g. using investment vehicles, cannot be assessed as ORBIS does not fully analyse fully every intermediate ownership link.
See European Commission (2020), “A Capital Markets Union for people and businesses-new action plan”, Communication from The Commission to the European Parliament, the Council, the European Economic and Social Committee and the Committee of the Regions, COM(2020) 590 final.
The European Commission is scheduled to publish an initiative to ensure greater convergence or minimum harmonisation in targeted areas of insolvency in mid-2022. See European Commission (2021), “Capital Markets Union - Delivering one year after the Action Plan”, Communication from the Commission to the European Parliament, the Council, the European Economic and Social Committee and the Committee of the Regions, COM(2021) 720 final.
See “Towards a green capital markets union for Europe”, speech by Christine Lagarde, President of the European Central Bank, Frankfurt am Main, 6 May 2021.
Investment funds in combination with money market funds have increased their financial assets by a total of €5 trillion since 2019.
Excluding Eurosystem assets.
See Chart 4, panel b in: European Central Bank (2021), Financial Stability Review, Frankfurt, November.
For the previous Data Gap Initiative and an indication of forthcoming work on fintech, see FSB/IMF (2021), G20 Data Gaps Initiative (DGI-2): The Sixth Progress Report – Countdown to December 2021, Washington, DC, October.
See the UN website.
See the Eurostat website.
See IFC Working Group on Fintech Data Issues (2020), “Towards monitoring financial innovation in central bank statistics”, IFC Report, No 12, Bank for International Settlements, Basel, July.
The non-bank financial sector includes investment funds, money market funds, insurance corporations, pension funds, financial vehicle corporations and the residual of other financial institutions.
According to ECB statistics.
Both measures consider debt securities, (securitised) loans and equity but exclude trade credit. While trade credit also represents an important financing source for NFCs, it is excluded from the measures as it is less related to the functioning of financial markets and the financial system. The analysis excludes intra-group financing, relying on several assumptions owing to data gaps.
In practical terms, only (securitised) loans, debt securities and listed shares are considered, as no who-to-whom information is available for unlisted shares and other equity. Box 1 provides further information on the importance of the NBFI sector in private equity markets.
Chart 1.1 a) provides further insights into the financing of NFCs from a flow perspective.
The sectoral breakdown for the fourth quarter of 2013 is applied to the total debt securities amounts in previous quarters. The average share of euro area NFC listed shares in bank and non-bank sectors’ total holdings of listed shares after the fourth quarter of 2013 is applied to the time series of total holdings of listed shares adjusted for valuation effects as explained below. This is done to avoid back-casting the volatile sectoral distribution of transaction data.
All NFC-NFC loans and unlisted equity holdings are assumed to be provided intra-group, whereas listed shares held by other NFCs are assumed not to be held intra-group. NFC-NFC debt securities holdings are negligible. As there is no who-to-whom split available for unlisted equity in euro area accounts data, average estimates from Orbis for 2019 and 2020 are used, and a share of 45% of NFC-NFC unlisted shares and 57% of other equity holdings is applied. The decrease in MB equity finance shown in Chart A is sensitive to the assumption that this share remained equal for the observed time horizon.
This is because the OFI residual cannot be broken down into subsectors. Limited national data show that a significant part of this residual is associated with captive financial institutions (such as holding companies) and special financial institutions, which are set up by large non-financial multinational firms to raise funds (so called financing conduits) and/or to channel funds intra-group (see European Systemic Risk Board (2017), EU Shadow Banking Monitor, No 2, May, Box 1, pp. 13-16; and European Systemic Risk Board (2019), EU Non-bank Financial Intermediation Risk Monitor, No 4, July, pp. 39-41). As a result, it is unclear whether a financing vehicle of an NFC should be classified as pertaining to the NBFI sector or not; if it is classified as pertaining to the NBFI sector, it is likely that the financing is provided intra-group. The missing breakdown of the OFI residual brings the additional caveat that the MB finance measure could underestimate NFC debt security issuances, as it does not include NFC debt security issuances via financing conduits. The ECB’s statistics department is currently working on deriving such estimates.
Retained securitisations are those where the asset-backed securities issued by the securitisation vehicle (i.e. the “financial vehicle corporation”, or “FVC”) are held by the originating bank instead of being sold to other market participants. As the information on the share of securitised loans that are retained is not available in official statistics, an estimate of one-third based on Dealogic data is used. This refers to securitised loans to all sectors, so it is essentially an upper bound. Estimates from Orbis are also used for OFIs holdings of unlisted shares (14%) and other equity (21%), listed shares are again assumed not to be held intra-group.
A similar adjustment in the debt securities time series is negligible. This is explained by valuation effects fading out over time as bonds regularly mature and are rolled over. A further caveat is that data are available with a time lag, but this is less of a concern given that the indicators move quite slowly.
See Popov, A. (2017), “Evidence on finance and economic growth”, Working Paper Series, No 2115, ECB, December and sources therein.
See De Haas, R. and Popov, A. (2019), “Finance and carbon emissions,” Working Paper Series, No 2318, ECB, September; De Haas, R. and Popov, A. (2021), “Finance and Green Growth”, EBRD Working Paper, No 217; and European Central Bank (2021), “Towards a green capital markets union: developing sustainable, integrated and resilient European capital markets”, Macroprudential Bulletin, No 15, October.
See Special Feature B entitled “Integrating euro area corporate bond markets: benefits and potential financial stability challenges” in European Central Bank (2018), Financial Integration in Europe, May; and European Systemic Research Board (2021), EU Non-bank Financial Intermediation Risk Monitor 2021, No 6, August.
See Crouzet, N. (2018), “Aggregate Implications of Corporate Debt Choices”, Review of Economic Studies, Vol. 85; and Darmouni, O. and Papoutsi, M. (2021), The Rise of Bond Financing in Europe and sources therein for a more detailed discussion.
See Special Feature C entitled “Is the home bias biased? New evidence from the investment fund sector” in European Central Bank (2020), Financial Integration and Structure in the Euro Area, March.
See Financial Stability Board (2020), “Holistic Review of the March Market Turmoil”, 17 November.
See European Central Bank (2021), Financial Stability Review, Chapter 3.2, Frankfurt, November.
Low levels of cross-border bank M&A seem to be a global phenomenon, but a special obstacle in Europe may be low valuations and their underlying causes (see ECB, 2020).
See ECB Banking Supervision (2021), Guide on the supervisory approach to consolidation in the banking sector.
See also Hartmann, P., et al. (2017), “Obstacles to cross-border consolidation in the euro area”, special feature in European Central Bank (2017), Financial Integration in Europe, Frankfurt, May.
See Enria, A. and Fernandez-Bollo, E. (2020), “Fostering the cross-border integration of banking groups in the banking union”, The Supervision Blog, 9 October.
See Dermine, J. (2003), “Banking in Europe: past, present and future”, in Gaspar, V., Hartmann, P. and Sleijpen, O. (eds.), The Transformation of the European Financial System, Proceedings of the Second ECB Central Banking Conference, Frankfurt, pp. 31-95.
See for example Enria, A. (2021), “How can we make the most of an incomplete banking union?”, speech at the Eurofi Financial Forum, Ljubljana, 9 September.
EBA (2021), Opinion of the European Banking Authority on the treatment of clients funds under Deposit Guarantee Scheme Directive (EBA/Op/2021/11), Paris, October.
See European Central Bank (2020), Financial Stability Review, Chapters 4 and 5, Frankfurt, May, for a more detailed discussion. These dynamics are not visible in the quarterly data shown in Chart 42 in the Annex.
See Grill, M., Molestina Vivar, L., Mücke, C., O’Donnell, C., O’Sullivan, S., Wedow, M., Weis, M., Weistroffer, C. (2022), “Mind the liquidity gap: a discussion of money market fund reform proposals”, Macroprudential Bulletin, Issue 16, ECB; European Central Bank (2021), “Eurosystem contribution to the European Securities and Markets Authority (ESMA) consultation on the framework for EU money market funds”, Frankfurt, June; ESRB (2021), “Recommendation of the European Systemic Risk Board on reform of money market funds”, Frankfurt, December.
See European Central Bank (2020), Chapter 4.2 for a more detailed discussion.
See European Central Bank (2020), Special Feature C: “Is the home bias biased? New evidence from the investment fund sector” in Financial Integration and Structure in the Euro Area, Frankfurt, March.
Retirement provision in euro area countries typically consists of three pillars: government sponsored pay-as-you-go plans (pillar 1), occupational (funded) pension schemes (pillar 2) and private pensions/life insurance (pillar 3).
See, for example, Albertazzi, U., Becker, B. and Boucinha, M. (2018), “Portfolio rebalancing and the transmission of large-scale asset programmes: evidence from the euro area”, Working Paper Series, No 2125, ECB, Frankfurt, January.
See also European Central Bank (2021), Economic Bulletin, Issue 5, Box 8, Frankfurt, August.
Hoffmann, P., Kremer, M. and Zaharia, S. (2020), "Financial integration in Europe through the lens of composite indicators", Economics Letters, Vol. 194: 109344.
See Borgioli S., C.-W. Horn, U. Kochanska, P. Molitor, and F.P. Mongelli (2020) European financial integration during the COVID-19 crisis, Article, Economic Bulletin, Issue 7, ECB.
Breitenfellner, A. and Silgoner, M. (2020), “Viral divergence’: Heterogenous effects of the COVID-19 crisis in the euro area”, in Konjunktur aktuell, Oesterreichische Nationalbank, Vienna, June, pp. 44-49; Delatte, A.-L. and Guillaume, A. (2020), “Covid 19: a new challenge for the EMU”, CEPII Working Paper No. 2020-08, Paris, July; Hernández de Cos, P. (2021), “The European Central Bank’s monetary policy: response to the pandemic crisis and future challenges”, speech at the Universidad Autónoma de Madrid (English translation of the Spanish original), 3 March 2021.
The early impact of the crisis on financial integration may have been driven by an abnormal demand for money-like instruments at the expense of other assets (FSB 2020), a flight to safety into German government bonds, and a correction of high pre-pandemic asset valuations towards the end of the first quarter of 2020 (ECB 2020b, Section 2); see European Central Bank (2020), Financial Stability Review, Frankfurt, May.
These track the wholesale euro unsecured overnight borrowing costs of banks located in the euro area. Developments in other maturities (term unsecured) and segments (secured) of euro money markets are not captured by the CIFI model.
By way of illustration, see, for example, European Commission (2017), “European Post Trade Forum Report” or European Commission (2020), “Final report of the High Level Forum on the Capital Markets Union - A new vision for Europe’s capital markets”.
See Giddy, I., Saunders, A. and Walter, I. (1996): “Alternative Models for Clearance and Settlement: The Case of the Single European Capital Market”, Journal of Money, Credit and Banking, Vol. 28, No. 4, pp. 986-1000.
However, the use of these intermediaries also entails costs. See Lannoo, K. and Levin, M. (2001): “The Securities Settlement industry in the EU: Structure, Costs and the Way Forward”, CEPS Research Report.
See European Central Securities Depositories Association (2016), “Overview of links in Europe”. Data on links using the same methodology are also available for 2015, but not for the intervening years before the update in 2021.
There are two forms of CSD links: outbound links and inbound links. Inbound links allow foreign CSDs to access the domestic market of another country. CSD links can be further divided into direct and indirect links. Direct links are those in which an investor CSD has a securities account at the issuer CSD, while indirect links imply that another intermediary acts as a sub-custodian, holding assets on behalf of the investor CSD. However, we do not distinguish between direct and indirect links in this analysis.
Fidora, M., Fratzscher, M. and Thimann, C. (2017): “Home bias in global bond and equity markets: The role of real exchange rate volatility”, Journal of International Money and Finance, Vol. 26, Issue 4, pp. 631‑655.
Ideally, we would use a time series of links showing changes such as the establishment of new links. However, only data for 2016 and for 2021 (see updated ECSDA matrix) are available. Given the limited number of changes, we use the data for 2016 links throughout the analysis in this box. The results are robust when using the updated links for 2021 for home bias data for 2020.
We use the nearest neighbour matching procedure (on a one-to-one basis), which means that we select the country pairs closest in terms of their propensity scores based on the observed characteristics (bilateral capital flows and similar-sized bond markets) using the 2014/2015 average values from before the network was identified in 2016. We conduct the analysis without replacement, which means that a neighbour can only be used once. We require common support and impose a tolerance level of 1%, which is known as the caliper.
See, for example, Grubel, H. (1968), “Internationally Diversified Portfolios”, American Economic Review Vol. 58, pp. 1299-1314; Grauer, R. and Hakansson, N. (1987) “Gains from International Diversification: 1968-85 Returns on Portfolios of Stocks and Bonds”, Journal of Finance, Vol. 42, No 3, pp. 721-739; Obstfeld, M. (1992), “Risk-Taking, Global Diversification, and Growth”, NBER Working Paper, No 4093; DeSantis, G. and Gerard, B. (1997), “International Asset Pricing and Portfolio Diversification with Time-Varying Risk”, Journal of Finance Vol. 52, No 5, pp. 1881-1912; and Sørensen, B.E., Wu, Y.T., Yosha, O. and Zhu, Y. (2007), “Home bias and international risk sharing: Twin puzzles separated at birth”, Journal of International Money and Finance, Vol. 26, Issue 4, pp. 587-605.
The CMU Action Plan includes actions to tackle for example the fragmentation of the European post-trade landscape.
This box is based on Levels, A., Lambert, C. and Wedow, M. (2022), “Home bias in the green bond market and the role of sustainability preferences”, mimeo. For additional information on drivers of integration in the euro area, please see also Box 3, “Frictions in the debt issuance procedures and home bias in the euro area” in this edition of the Financial Integration and Structure in the Euro Area report.
See “Towards a green capital markets union for Europe”, speech by Christine Lagarde, President of the European Central Bank, Frankfurt am Main, 6 May 2021.
Home bias measures the degree to which investors overweight domestic bonds and underweight foreign bonds relative to a benchmark portfolio that would weight home and foreign bonds according to their respective shares in the aggregate bond market. More specifically, investor home bias is calculated as 1 minus the share of the investor’s actual foreign bond holdings over the optimal share of foreign holdings. The optimal share is the market weight of all euro area countries seen from the viewpoint of the investor’s country, which is computed as the share of foreign bonds in total euro area bonds. Throughout our analysis, “the investor” refers either to entire country-sectors or to the banking sector. Our sample comprises euro area holders and euro area denominated bonds.
Sectors include, among others (i) deposit-taking corporations, (ii) money market funds, (iii) investment funds, (iv) financial vehicle corporations, (v) insurance corporations, (vi) pension funds, (vii) other financial corporations, (viii) general government, (ix) non-financial corporations and (x) households.
In unreported results, we show that in the period from the fourth quarter of 2013 to the third quarter of 2021, green bond home bias increases from 0.07 to 0.23 (for the aggregate market) and from 0.20 to 0.33 (for the euro area banking sector). This compares with an increase in non-green home bias over the same period from 0.47 to 0.48 (for the aggregate market) and from 0.56 to 0.58 (for the euro area banking sector).
See, for example, French, K.R. and Poterba, J.M. (1991), “Investor Diversification and International Equity Markets”, American Economic Review, Vol. 81, No 2, pp. 222-226; Tesar, L. and Werner, I.M. (1991), “Home bias and high turnover”, Journal of International Money and Finance, Vol. 14, No 4, pp. 467-493; or more recently Karolyi, A.G. (2016), “Home Bias, an Academic Puzzle”, Review of Finance, Vol. 20, No 6, pp. 2049-2078.
Domestic development measures a country's green bond market development. It is expressed by the outstanding amount of green bonds issued by that country as a percentage of the outstanding amount of all bonds issued by that country. In addition, we add a quadratic term for market development to gauge any non-linear trends. In our model, we include investor country fixed effects and time fixed effects to test whether there are any other time-varying macroeconomic developments that could influence investors’ portfolio allocation, besides trends in green bond market development. To account for heterogeneity across countries, we use clustered standard errors at the country level. Finally, as a robustness check, we run our regression model for both the unweighted sample and the weighted sample based on a country’s share in the aggregate euro area green bond market.
The underlying first part of the analysis captures all country quarter observations, irrespective of whether individual countries have developed a domestic market (in cases where no market exists, home bias amounts to zero for the specific country-quarter observation), as long as these countries invest in the green bond market abroad in the respective quarter. This part of the analysis predominantly captures the impact of initial bond market development (from no market to a market) on home bias.
The underlying second part of the analysis only considers observations for countries that have already developed a domestic green bond market in the respective quarter, i.e. issuance of respective countries is non-zero, which leads domestic investors to also invest in the domestic green bond market. This part of the analysis captures the speed of adjustment and dynamics towards larger home bias as domestic markets develop. The weighted model gives greater prominence to countries with a more advanced green bond market but only captures country-quarters for which a green bond market can already be observed.
For a more extensive discussion of policy measures, see Born, A., Giuzio, M., Lambert, C., Salakhova, D., Schölermann, H. and Tamburrini, F. (2021), “Towards a green capital markets union: developing sustainable, integrated and resilient European capital markets”, Macroprudential Bulletin, Issue 15, ECB.
As discussed in Section 3.3 the euro area investment funds sector plays a critical role in this context.
See chapter 5.3 of Obstfeld, M. and Rogoff, K. (1996), Foundations of International Macroeconomics, MIT Press, Cambridge, MA.
See also EIOPA (2021), Financial Stability Report, Publications Office of the European Union, Luxembourg, July.
See European Central Bank (2020), “New pension fund statistics”, Economic Bulletin, Issue 7, Frankfurt, November.
See European Central Bank (2020), “COVID-19 and the increase in household savings: precautionary or forced?“, Economic Bulletin, Issue 6, Frankfurt, September.
See ECB (2020); also Beck et al., “Financial integration and risk sharing in a monetary union”, Special Feature A in European Central Bank (2016), Financial integration in Europe, Frankfurt, April.
Giovannini et al. (2020), “On the measurement of risk sharing in the euro area”, Box 5 in ECB (2020).
Asdrubali, P., Sorensen, B. Yosha, O. (1996), “Channels of interstate risk sharing: United States 1963‑1990”, Quarterly Journal of Economics, Vol. 111, Issue 4, pp. 1081‑1110.
Lewis, Karen K. (1996), "What can explain the apparent lack of international consumption risk sharing?", Journal of Political Economy, Vol. 104, No 2, pp. 267-297; Giovannini, A., Horn C.-W. and Mongelli, F.P. (2021), “An early view on euro area risk sharing during the COVID-19 crisis”, VoxEU.org.
The analysis has structural limitations in fully shedding light on the impact of the pandemic on risk sharing, because the estimates are based on averages over a rolling window of 11 years, making it difficult to capture very recent trends and the impact of policies implemented.
Due to the origins of the global financial crisis, the credit channel is expected to be particularly hit during the relevant period, which is characterised by bank deleveraging.
This channel is defined as the difference between gross national income and gross disposable iIncome, i.e. net international transfers. It therefore captures any transfers made by a resident entity to a non-resident entity without an economic counterpart. This includes both government transfers (e.g. transfers between governments, but also international aid) and cross-border private transfers (e.g. workers’ remittances by migrants and international transfers between private entities to alleviate poverty and the consequences of natural disasters).
Bańkowski et al. (2021), “The macroeconomic impact of the Next Generation EU instrument on the euro area”, Occasional Paper Series, No 255, ECB, Frankfurt, January.
While Member States have made full use of the grant component of RRF entitlements, less use has been made of the loan component. So far seven EU countries have requested loans: three of them (Italy, Greece, and Romania) have requested the full amount they were eligible for, while four countries have applied for a lower share (Portugal, Cyprus, Slovenia, and Poland).
ECB (2022), “Next Generation EU: A euro area perspective”, Economic Bulletin, Issue 1, Frankfurt, February.
This box is based on Martín Fuentes, N., Born, A., Bremus, F., Kastelein, W. and Lambert, C. (2022), “A deep dive into the capital channel of risk sharing in the euro area”, mimeo.
These factors include domestic mitigation strategies and the importance of economic sectors affected to a greater or lesser extent by the COVID-19 pandemic. See, for example, Guerrieri, V., Lorenzoni, G., Straub, L. and Werning, I. (2020), “Macroeconomic Implications of COVID-19: Can Negative Supply Shocks Cause Demand Shortages?”, NBER Working Paper, No 26918; Muggenthaler, P., Schroth, J. and Sun, Y. (2021), “The heterogeneous economic impact of the pandemic across euro area countries”, Economic Bulletin, Issue 5, ECB; or Milesi Ferretti, G. (2021), “The Travel Shock”, CEPR Discussion Paper, No 16738.
See, for example, Beck, R., Dedola, L., Giovannini, A. and Popov, A. (2016), “Financial integration and risk sharing in a monetary union”, Financial Integration in Europe, ECB, April; Poncela, P., Pericoli, F., Manca, A.R.and Nardo, M. (2016): “Risk sharing in Europe”, JRC Working Papers, JRC104621, European Commission, Joint Research Centre, Ispra; Hoffmann, M., Maslov, E., Sorensen, B.E. and Stewen, I. (2019), “Channels of Risk Sharing in the Eurozone: What Can Banking and Capital Market Union Achieve?”, IMF Economic Review, Vol. 67, pp. 443-495; Cimadomo, J., Ciminelli, G., Furtuna, O. and Giuliodori, M. (2020), “Private and public risk sharing in the euro area”, European Economic Review, Vol. 121, Article 103347.
Asdrubali, P., Sorensen, B.E. and Yosha, O. (1996), “Channels of Interstate Risk Sharing: United States 1963-1990”, The Quarterly Journal of Economics, Vol. 111, No 4, pp. 1081-1110.
Owing to the lack of final data for the period since 2020, it is still premature to draw conclusions on how fiscal risk sharing has operated during the COVID-19 pandemic. However, it is reasonable to assume that the common initiatives launched at EU level (NextGenerationEU and its Recovery and Resilience Facility) have probably helped to improve risk sharing within the EU.
Asdrubali, P., Kim, S., Pericoli, F. and Poncela, P. (2018), “New Risk Sharing Channels in OECD Countries: a Heterogeneous Panel VAR”, JRC Working Papers in Economics and Finance, JRC113419, European Commission, Joint Research Centre, Ispra. Other studies estimating separate models for each country include Kalemli-Ozcan, S., Luttini, E.E. and Sorensen, B.E. (2014), “Debt Crises and Risk-Sharing: The Role of Markets versus Sovereigns”, Scandinavian Journal of Economics, Vol.116, No 1, pp. 253-276; or Poncela et al. (2016), op. cit.
We abstract from the potential effects of currency risk and the effects of new countries joining the monetary union by limiting our sample to the ten countries that were part of the euro area over our entire estimation horizon and then excluding Luxembourg and Ireland owing to their particular financial holdings structures as financial centres (see Hoffmann et al., 2019, op. cit.). In addition, Ireland had large revisions in GDP and has also been excluded from other analysis (see Giovannini, A., Horn, C.-W., Mongelli, F. and Popov, A. (2020), “On the measurement of risk-sharing in the euro area”, Box 5 in Financial Integration and Structure in the Euro Area, ECB, March).
A nine-year window is the shortest possible period that allows the shocks to be properly identified.
The contribution of the credit channel has increased in recent years, and while the contribution of the international transfers channel is positive, it remains very small, being less than half of the contribution of the capital channel.
-
5 April 2022