
Euro area monetary and financial statistics - 2018 quality report
Executive summary and main conclusions
This biennial data quality report is a contribution to the European Central Bank (ECB) Statistics Quality Framework (SQF). It relates to statistics produced by the European System of Central Banks (ESCB) and focuses on the collection, compilation and dissemination of euro area monetary and financial statistics (MFS) in 2017 and 2018. Following the basic principles set out in the “Public commitment on European statistics by the ESCB”, this report provides descriptive and quantitative quality indicators. The scope of this report is aligned with the responsibilities of the Working Group on Monetary and Financial Statistics (WG MFS) and is divided into three sections: Section 1, Institutional environment, highlights the recently implemented regulatory updates; Section 2, Statistical processes, presents the main operational undertakings since 2017; and Section 3, High output quality, sets out the quantitative results of the data quality analysis.
With regard to statistical processes, the collection, processing and dissemination of MFS went smoothly in 2017 and 2018. Overall, the data published remained of a very high quality and fit for policy needs. In this context, major developments undertaken during the two-year period are mentioned below.
Among the main regulatory developments, Guideline ECB/2014/15 on monetary and financial statistics, which was amended in 2018, allowed more extensive data transmission to the ECB, covering additional details for loan adjustments related to loan sales and securitisation, notional cash pooling, MFI positions vis-à-vis the Single Resolution Board, data breaking down MFI capital and reserves into sub-categories, and data identifying undertakings for collective investment in transferable securities within investment fund statistics.
In addition, the process for updating Regulation (EU) No 1071/2013 of 24 September 2013 concerning the balance sheet of the monetary financial institutions sector (ECB/2013/33) was initiated, and further work on harmonising national practices and methodological consistency took place. This resulted in an updated version of the Manual on MFI balance sheet statistics, which offers further guidance on the compilation of balance sheet item (BSI) statistics.
Moreover, a new ECB Regulation on statistical reporting requirements for pension funds (PFs) (Regulation ECB/2018/2) was introduced, with the aim of increasing transparency and improving data comparability in this fast-growing sector of the financial industry. At the same time, reflecting the rapid changes in the payments landscape in recent years, and to take account of the recently introduced Payment Services Directive (PSD2), a review of Regulation (EU) No 1409/2013 of 28 November 2013 on payments statistics (ECB/2013/43) was initiated.
Turning to “high output quality”, analyses of revisions were performed to evaluate the reliability of the first releases of euro area monetary aggregates, including the broad aggregate M3, and of the euro area aggregates for MFI interest rate indicators.
As far as the BSI statistics are concerned, the impact of revisions on the month-on-month growth rates of the three main euro area monetary aggregates (M3, M2 and M1) continues to be very limited. Overall, at time lag t+1, at least 76% of all revisions received up to October 2018 had an impact lower or equal to 5 b.p. (0.05 p.p.) on any of the three growth rates published since August 2005. If only the revisions received since the end of 2016 are considered, the ratio increases to 83%. The impact of revisions after one year on any growth rate is, on average, lower than +/-0.72 b.p. since 2005 and 0.26 b.p. since the end of 2016.
In summary, the impact of revisions is sufficiently small that the month-on-month growth rates are fit for policy needs on their initial publication. The revisions received since the end of 2016 have also had a smaller impact on growth rates than revisions in all previous years since 2005 taken together.
Turning to MIR statistics, around 90% of all revisions to MIR indicators were between ‑5 b.p. and 5 b.p. The sample mean of revisions affecting euro area aggregates is equal to 0.007 b.p., while the corresponding absolute mean is equal to 0.03 b.p. The number of revisions is actually very small compared with the number of indicators used for the analysis (106) and the potential number of reference periods revised (from October 2018 back to January 2003, with a monthly frequency). Furthermore, it is worth noting that 13% of the indicators in the study were not revised during the period under analysis.
Overall, in comparison with the number of observations, the number and size of revisions to the MFI interest rate statistics at the euro area level are small, which demonstrates their reliability. The number of exceptional and ad hoc revisions, as opposed to ordinary revisions, shows that MFI interest rate statistics are being continuously updated and thus their accuracy is continuously improving.
Introduction
In line with the mission statement of the Eurosystem[1], the ECB is committed to adhering to values such as credibility, trust, transparency and accountability, which underpin the integrity of the statistical function provided by the Treaty on the Functioning of the European Union (Article 5 of the Statute of the European System of Central Banks and of the European Central Bank[2]). Adherence to high-quality statistical standards is a key factor in maintaining the public’s confidence in ESCB statistics, upon which monetary policy decisions and other Eurosystem tasks are based. It also ensures the comparability of euro area and national statistics at the international level. In the performance of its statistical function, the ESCB is committed to good governance and the highest ethical standards, as well as to executing its tasks in a spirit of cooperation and teamwork.
This report complies with the “Public commitment on European statistics by the ESCB”, which stipulates the common set of principles that govern ESCB statistics. The main principles and elements guiding the production of ECB statistics are also contained in the Statistics Quality Framework and quality assurance procedures. Accordingly, the report has been organised into three sections: the ESCB’s institutional environment, statistical processes and statistical output. Section 1 describes the regulatory framework that applies to the data collection necessary for the production of euro area monetary and financial statistics (MFS); Section 2 highlights the processes governing the production of MFS and gives an overview of selected quality improvement initiatives; and Section 3 is dedicated to specific data analyses in the context of quality assessment of the statistical output.
The ESCB statistical function collects all relevant data in order to produce and disseminate reliable, timely, consistent and accessible statistics in the areas under the ESCB’s responsibility. The main purpose of euro area MFS is to support the monetary policy of the ECB and other tasks of the Eurosystem and the ESCB. They also support other policies of the European Union. The statistics comply with European and internationally agreed standards, guidelines and good practices. The data collection frameworks for euro area MFS cover national central banks (NCBs), credit institutions, insurance corporations (ICs), pension funds (PFs), money market funds (MMFs), investment funds (IFs) and financial vehicle corporations (FVCs), among others. They provide statistics on MFI balance sheet items, as well as on ICs, PFs, FVCs and IFs. MIR statistics are also provided, as are statistics on payments with and the issuance of electronic money in the euro area. The scope of this report is aligned with the responsibilities of the Working Group on Monetary and Financial Statistics (WG MFS). In contrast to the previous report published in 2016, this report does not address developments related to analytical credit datasets (AnaCredit), the Register of Institutions and Affiliates Database (RIAD) or money market statistical reporting (MMSR), which have since been placed outside the WG MFS’s mandate.
Statistics on MFI balance sheet items are among the core statistics used by the ECB for the conduct of monetary policy. They provide crucial information on monetary developments in the euro area (e.g. monetary aggregates) and on the business of MFIs in general (e.g. outstanding loans to and deposits of households and non-financial corporations (NFCs)). MIR statistics are important for the analysis of the monetary policy transmission mechanism and the pass-through of official and market interest rates to retail bank interest rates. They also provide information on the degree of integration of the retail banking markets in the euro area. As regards data accessibility and dissemination, the main indicators of monetary developments are published on a monthly basis in pre-announced press releases[3] and regular ECB publications such as the Economic Bulletin[4]. They are also made available with additional details in the Statistical Data Warehouse (SDW)[5] on the ECB’s website. High-quality euro area MFS have been compiled and published since the start of Stage Three of Economic and Monetary Union in 1999; in 2017 and 2018, around 60 statistical press releases were issued each year in a timely and punctual manner in line with the advance release calendar.
1 Institutional environment
1.1 Current regulatory framework
The concepts underlying the main elements of the statistical requirements, concerning those statistics covered in this report, are set out in international statistical standards, namely the globally used System of National Accounts and the European system of national and regional accounts (of which the SNA 2008 and the ESA 2010 are, respectively, the latest versions). Adherence to these standards fosters international comparability of national and euro area statistics, and ensures a sound methodological background for the aggregation of data.
According to Article 5 of the Statute of the ESCB and of the ECB, the ESCB may collect the statistical information necessary to carry out its tasks, including those in the areas of monetary policy, financial stability and banking supervision purposes, either from the competent national authorities or directly from economic agents. To carry out the functions of the Eurosystem, the ECB may adopt legal instruments that have a direct effect on certain economic agents resident in the euro area, such as MFIs and other financial corporations (see S.12 in the ESA 2010).
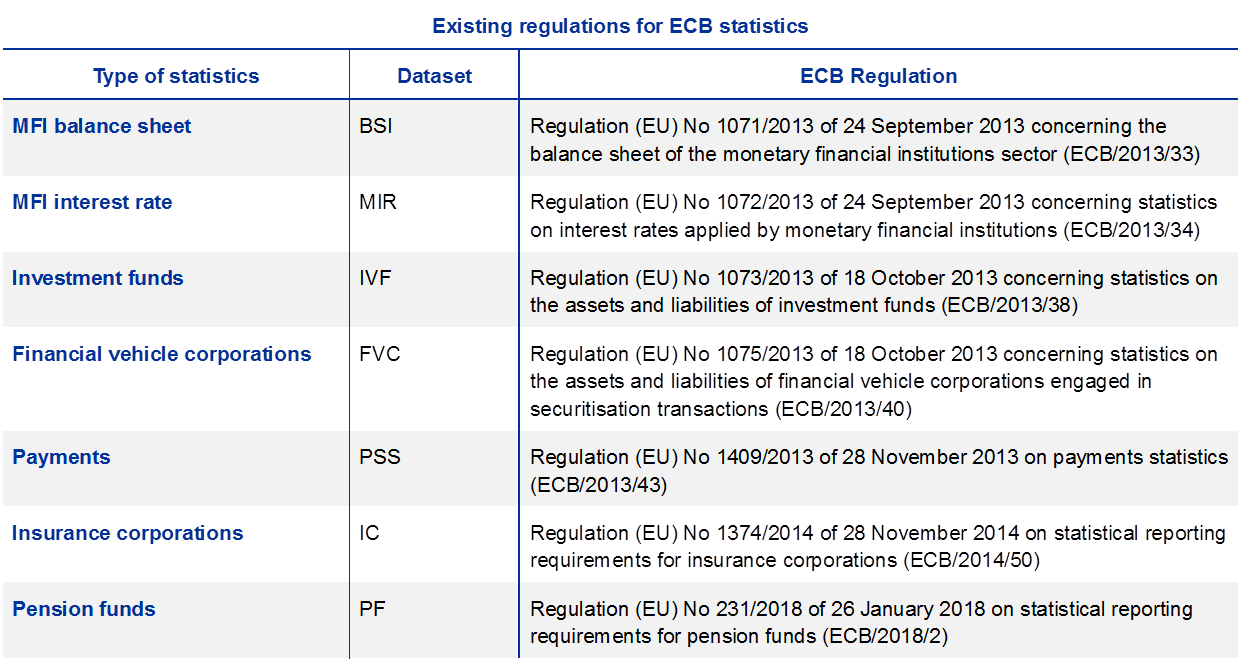
The Governing Council of the ECB adopts regulations setting out statistical requirements that are binding on the euro area entities to which they are addressed. ECB regulations are “directly applicable”, meaning that they do not need to be transposed into national law. These regulations instruct reporting entities on, for example, statistical reporting requirements in terms of definitions, classifications, frequency and timeliness. Table 1 illustrates the relevant ECB regulations for the collection of statistics addressed in this report. In addition, the NCBs may issue national instructions with regard to reporting addressed directly to them (so-called “primary reporting”).
The ECB also adopts guidelines that are binding on members of the Eurosystem. Statistical guidelines instruct central banks on what data must be submitted to the ECB, by when, in what format, etc. Where the relevant statistics are not the subject of a regulation, a guideline informs euro area central banks of the ECB’s needs, leaving some discretion as to the choice of source for the data, provided that certain standards are met. Guideline ECB/2014/15 is the instrument applicable to the area of MFS statistics. In addition to providing the framework for NCBs to transmit data collected under the relevant regulations to the ECB, the Guideline also includes other specific requirements for which NCBs provide data on a best effort basis, based on the data available to them. This includes statistics relating to agents that are not subject to regulation requirements (e.g. consolidated banking data and some other financial intermediaries) and also statistics that complement existing regulation requirements (e.g. undrawn credit lines provided by MFIs and a separate identification of IFs that are undertakings for collective investment in transferable securities (UCITS) in accordance with the UCITS Directive).
The regulatory framework is amended on a regular basis to keep the statistics fit for use against a background of financial innovation and developing user needs. The following sections outline the main recent developments.
Existing regulatory framework for ECB statistics
1.2 Developments relating to MFI balance sheet items statistics
Statistics on MFI BSIs were enhanced via an amendment of Guideline ECB/2014/15 in 2018. This amendment added, among other items, available monthly data on securitisations and other transfers of loans to households broken down by purpose, notional cash pooling, and sub-components of capital and reserves. Under the Guideline, NCBs are requested to provide available data but, as these are not requirements imposed through a regulation on reporting agents, the data are not yet complete or fully harmonised. The new items in the Guideline are being considered for the update of the BSI Regulation ECB/2013/33, in addition to other requests from ESCB users of the MFI balance sheet statistics. This Regulation update takes place in the context of other ongoing statistical initiatives, including AnaCredit and the Integrated Reporting Framework (IReF), and is foreseen to contain a limited number of new requirements compared with the 2013 recast of the Regulation.
Furthermore, the WG MFS and the Working Group on AnaCredit have established the Expert Group on linkages between AnaCredit, BSI and MIR (EG ABM) in order to investigate comparisons and synergies between these datasets. The EG ABM is expected to make recommendations for improving the compatibility of AnaCredit, BSI and MIR data in the updates of the respective regulations.
1.3 New ECB Regulation on PF statistics and related parts of Guideline ECB/2014/15
In order to remain fit for purpose and meet users’ needs in a changing world the ECB’s macro statistics also continue to evolve. A new ECB Regulation on statistical reporting requirements for pension funds (PFs) (ECB/2018/2) was published on 17 February 2018[6]. It is aimed at increasing transparency and improving data comparability in this fast-growing sector of the financial industry. The Regulation will remedy shortcomings in the current non-harmonised and incomplete quarterly statistics on PFs published since June 2011, in particular the limited dissemination of transaction data due to insufficient data quality.
From the start of the project, the ECB has carefully assessed the potential impact of the Regulation with a view to containing the costs incurred in compliance. Through sustained cooperation with NCBs and, via them, with reporting agents and their industry associations, the ECB applied its “merits and costs procedure” in accordance with the principles and procedures set out in Council Regulation (EC) No 2533/98 to ensure that the reporting burden on PFs is contained and that the data are collected and compiled in a cost-effective way.
To this end, and taking into account the proportionality principle in particular, the reporting requirements as set out in the initial proposal were significantly streamlined, especially for smaller PFs. PFs will also report to the European Insurance and Occupational Pensions Authority (EIOPA). With a view to minimising the reporting burden for the industry, the relevant EIOPA and ECB bodies have cooperated closely to agree on the definitions, set up the methodological framework and prepare the transmission format for both ESCB statistics and supervisory reporting. A very high level of convergence between these reporting requirements and the data content and other features of the Regulation, such as timeliness and coverage, has been achieved. This will allow a single data flow for reporting by the industry, should this be decided at the national level by the respective NCBs and national competent authorities (NCAs).
The ECB attaches the utmost importance to stakeholders’ understanding of this innovative statistical project. This is why, among other things, it has published the draft Regulation on its website, along with informative web pages on the project’s rationale and design. This was done following an “in principle” agreement by the Governing Council of the ECB and provided the general public with the opportunity to make observations. As part of the consultation, a public hearing by teleconference was also held. The ECB received 13 written responses, all with relevant input. Following the public consultation and the response from the European Commission, the ECB analysed and gave due consideration to all comments received, subsequently amending the draft Regulation.
Following the assessment, an amended draft of the Regulation was forwarded to the Governing Council of the ECB and adopted as the ECB Regulation on statistical reporting requirements for PFs on 26 January 2018. The Regulation was published in the Official Journal (OJ) of the European Union on 17 February 2018.
In addition, Guideline ECB/2014/15 will be further amended in the course of 2019, in order to align the reporting requirements for PFs with the provisions of Regulation ECB/2018/02 on statistical reporting requirements for PFs, which entered into force on 26 January 2018. The new provisions in the Guideline are therefore based on the data definitions and the respective reporting obligations of Regulation ECB/2018/02.
It is also relevant to note that the Guideline already provides for the reporting of statistical information on PFs, which are transmitted by the NCBs to the ECB on the basis of data available at the national level. In order to ensure a smooth transition to the new requirements, the amended Guideline will provide that NCBs report statistical information on PFs for the third and fourth quarters of 2019 in accordance with both the Guideline and the requirements stemming from Regulation ECB/2018/2.
1.4 Updating the regulation on payments statistics
The compilation of annual payments statistics on the basis of Regulation ECB/2013/43 (the “Regulation”) commenced in 2015 (as of reference year 2014). These statistics have provided a unique source of information on payment instruments and systems that have allowed the ECB to monitor developments in the retail payments market following the implementation of the Single Euro Payments Area (SEPA). This information has also been in considerable demand by the industry, academia and the press.
Reflecting the rapid changes in the payments landscape in recent years, and having regard to the commitment to review ECB statistical regulations every five years, the ECB has now embarked on a review of the Regulation. In this context, users have presented a comprehensive set of new requirements comprising indicators related to new types of payment services and payment service providers (PSPs) introduced recently in the updated Payment Services Directive (PSD2)[7]. Moreover, since the beginning of the reporting under the Regulation on payments statistics, the Interchange Fee Regulation (IFR)[8] has entered into force. This had an impact, in particular, on the definition of cross-border card payments used in the reporting. Furthermore, to support the Eurosystem’s role as a catalyst for European financial market integration, information on innovative payment solutions (e.g. contactless card payments and digital wallets) was also required. The requirements also include a set of indicators on payment fraud for the purpose of oversight of payment instruments carried out by the Eurosystem[9].
To achieve an integrated reporting process and to avoid duplication, consideration is also being given to other requirements for payments statistics. These include data to support the Eurosystem’s forecasting exercises and the compilation of the euro area balance of payments.
The update of the Regulation on payments statistics is now subject to a systematic assessment of the merits and costs of enhanced data collection[10]. This approach ensures that new or enhanced statistics are sufficiently justified by high-priority policy needs and it provides incentives to search for the most cost-effective solutions, with the aim of keeping the burden placed on the reporting agents to a minimum. A public consultation on the draft updated regulation is planned for the beginning of 2020, before it is submitted for final approval by the Governing Council.
2 Statistical processes
2.1 Update on manuals on MFI balance sheet and IF statistics
The ECB published updated manuals on IF statistics (2017) and MFI balance sheet statistics (2019). The manuals are a useful resource for reporting agents, compilers and users of the statistics, and the new versions reflect the changes that were implemented in the regulatory framework for these statistics. Their purpose is to provide a common understanding of the reporting requirements by further clarifying and illustrating these requirements, mainly through the use of extended definitions, explanations of the underlying concepts and examples. As such, these manuals may supplement the information contained in ECB legal acts, but the guidance they provide is not in itself legally binding.
The manual on IF statistics published in December 2017[11] is an update of the first version published in May 2009. The new version reflects changes in the regulatory and statistical framework for European IFs during this period. In particular, it includes a new chapter providing guidance for exchange traded funds and private equity funds, for which separate reporting was introduced in Guideline ECB/2014/15.
The manual on MFI balance sheet statistics published in January 2019[12] is an update of the first version published in April 2012. The new version reflects the changes in the regulatory framework since the previous version, as well as amendments to the compilation and presentation of key statistics. Most notably, this includes the derivation of the key series on MFI lending, which are adjusted for the impact of securitisations and other loan transfers and the impact of notional cash pooling[13], and the correction applied to the monetary aggregates for tri-party repos involving central clearing counterparties. The manual also reflects the continued efforts of the WG MFS to enhance standardisation and harmonisation of BSI reporting practices across countries, such as those identified in the Survey of national practices published in 2015[14], for example by introducing guidance on the treatment of margin deposits, collateral repossessed in the case of loan defaults, renegotiated loans, loans sold at a discount, capital and reserves, and many other borderline issues.
2.2 New statistics on insurance corporations
An ECB regulation (ECB/2014/50) on statistical reporting requirements for ICs (the “IC Regulation”) was published in the OJ on 20 December 2014 and entered into force on 9 January 2015.
In order to minimise the reporting burden on the insurance industry, the IC Regulation allows NCBs to derive the statistical requirements, to the extent possible, from data reported for supervisory purposes under the EU’s Solvency II framework[15]. While a large part of the information required under the IC regulation can be derived from data provided for supervisory purposes, some data required purely for statistical purposes have to be collected in addition (so-called ECB “add-ons”).
All euro area countries, with the exception of three (who have set up a separate dedicated statistical data collection), derive the statistical requirements from Solvency II data and ECB add-ons. A mapping document providing guidance on how to derive the ESCB requirements from supervisory reporting and the ECB add-ons has been prepared by the ECB and the NCBs and will be published in due course.
To further simplify the reporting process from ICs to the NCBs, NCBs have the option to implement a single reporting flow for statistical and supervisory data, using reporting templates prepared by the ECB in close cooperation with EIOPA, which consolidate the statistical and supervisory data requirements (so-called “unofficial reporting templates including ECB add-ons”). The ECB add-ons have also been integrated in the technical reporting framework set up by EIOPA, based on the Data Point Model (a structured representation of the data) and eXtensible Business Reporting Language (XBRL).
The ECB Guideline ECB/2015/44 amending Guideline ECB/2014/15 on monetary and financial statistics (the “MFS Guideline”) was published in the OJ on 1 April 2016[16] and sets out the statistics on ICs to be transmitted from NCBs to the ECB. The requirements for IC statistics consist of detailed quarterly balance sheet information in terms of outstanding amounts, revaluation adjustments and reclassification adjustments as of the first quarter of 2016, and annual information on premiums written, claims incurred and commissions as of reference year 2016.
The first quarterly reporting of IC statistics by NCBs to the ECB in line with the IC Regulation and MFS Guideline took place in early July 2016. Since then, quarterly data have been reported to the ECB on a regular basis. NCBs transmit the quarterly IC data to the ECB ten working days after the deadlines specified in the IC regulation, which amount to eight weeks after the end of the reference quarters in 2016, and are brought forward by one week per year thereafter. The steady state of five weeks will be reached for the reference quarters in 2019.
There have so far been two transmissions of annual IC statistics by NCBs to the ECB, which took place in early June 2017 for reference year 2016 and in mid-May 2018 for reference year 2017. NCBs transmit the annual IC data to the ECB ten working days after the deadlines specified in the IC regulation, which are 20 weeks after the end of reference year 2016 and are brought forward by two weeks per year thereafter. The steady state of 14 weeks will be reached for reference year 2019.
Quarterly euro area IC statistics, in accordance with the IC Regulation and MFS Guideline, were published for the first time in February 2017 for the third quarter of 2016. Earlier quarters were not published due to data quality issues. The first publication of data included information on the balance sheets of ICs broken down by type (i.e. reinsurance ICs, life ICs, non-life ICs and composite ICs), covering basic balance sheet totals (on assets and liabilities) and further details on IC holdings of debt securities, equity and IF shares. Information was initially only published for stocks. As data quality improved, the publication of data was expanded step-wise. In April 2017 information on transactions in securities was added as of the fourth quarter of 2016. In September 2017 the information on ICs was expanded substantially to cover, among other things, more breakdowns on the geographical counterparty split of most asset items and maturity splits for deposits and loans, as well as the first publication of a reduced set of national data for euro area countries. In December 2017 the first annual growth rates were published given the availability of one year of data.
As data quality further improves the publication of IC data will be expanded to cover, for example, more information on transactions, further breakdowns especially for liabilities, annual data on premiums, claims and commissions, and more national data.
In order to ensure and further improve the data quality of insurance corporation statistics, the ECB also regularly cooperates closely with EIOPA. Furthermore, joint workshops with experts from the ECB, EIOPA, national supervisory authorities, NCBs and industry representatives have been held on a yearly basis since late 2016 as a forum to exchange views and discuss reporting issues among all stakeholders. These workshops have also led to concrete actions contributing to improvements in data quality, in particular the introduction of additional validations in the XBRL taxonomy.
2.3 Payments statistics (based on Regulation ECB/2013/43 and Guideline ECB/2014/15)
The compilation of annual payments statistics by the ESCB since 2014 has been based on Regulation ECB/2013/43 following the implementation of SEPA and the complementary update of the MFS Guideline in 2014 (Guideline ECB/2014/15). Under this Regulation, payments statistics have been produced annually for the period 2014‑2017. The production process has improved each year and this has facilitated the timely publication of these statistics
Payments statistics continue to be a subject of interest to academics and researchers. There is broad interest in what these statistics can reveal about developments in retail payments in Europe generally, but more especially in specific national markets, depending on the focus of the research. Therefore, it is important also to consider the ways in which these statistics can be disseminated and shared with policymakers, researchers and the public at large. Consequently, to improve the dissemination process, in line with ECB policy, the press release was this year published in HTML format.
The coverage of payments statistics has improved with the implementation of the enhanced reporting framework, as the reporting population previously consisted mainly of credit institutions, and the data could be derived from external data sources. Under the Payments Regulation, all payment service providers resident in the euro area are obliged to report directly to their respective NCB.
3 High output quality
The Public commitment on European Statistics by the ESCB and the Statistics Quality Framework set forth concepts that underlie the high output quality of the statistical data collected by the ECB. “High output quality” refers to the following characteristics: relevance, accuracy and reliability (including stability), timeliness (including punctuality), consistency and comparability, and accessibility and clarity.
The ECB’s internal compilation procedures include a wide range of quality checks of the national contributions received and of the euro area aggregates compiled. These checks are designed to detect potential problems in the national data, which may have negative effects on the quality of the output statistics. These quality checks can be grouped into four main categories: (1) completeness[17], internal and intra-period consistency[18]; (2) plausibility; (3) external consistency; and (4) revision studies to monitor the magnitude of data revisions, in particular for monetary aggregates and monetary interest rates.
This section focuses on presenting the results of the quantitative checks performed in order to analyse the magnitude of the data revisions affecting the compilation of monetary aggregates and MFI interest rates. During the period covered by the last quality report, from October 2014 to October 2016, various additional quality checks were added to the MFI balance sheet statistics as a response to the implementation of ECB Regulation (ECB/2013/33) concerning the MFI sector. In contrast, in the period from October 2016 to October 2018 covered by this quality report, only a few new data quality checks were introduced. The overall quality of published data has remained very high and stable over time. This ensures that collected statistical data contributed reliable information for the ECB’s policy needs in 2017 and 2018.
3.1 Quality measures based on revisions to MFI balance sheet and interest rate statistics
The revision analysis in this section evaluates the reliability of first releases. This is an important quality feature, alongside compliance with harmonised definitions, the timely incorporation of methodological changes and consistency with other statistics. It should be noted that a small number of revisions to the first release of the data is not necessarily an indicator of high data quality as revisions are primarily intended to improve statistics. They also tend to mitigate the impact of trade-offs between different output quality characteristics (e.g. the timeliness and accuracy of the reported data).
The revision practice for MFI balance sheet and MIR statistics allows any data release to be revised in order to keep the statistics up to date and relevant. The only restriction is that revisions to the monthly BSI data have to be submitted by NCBs when quarterly MFI balance sheet statistics are submitted, to ensure consistency between the monthly and the quarterly statistics. BSI data collected on a quarterly basis provide more detailed breakdowns and can thus, in principle, lead to the detection of errors in the monthly BSI data and to corresponding revisions. Exceptional revisions owing, for example, to reclassifications and improved reporting procedures, can be done at the time of any release.
A distinction is made between “ordinary” and “exceptional” revisions. Data are generally considered “provisional” at first release; therefore, ordinary revisions can be expected in the next monthly update at t+1. Exceptional revisions owing, for example, to reclassifications and improved reporting procedures, can be done at the time of any release and can go back as far as 2003 depending on the indicators.
3.1.1 Revisions of euro area MFI balance sheet statistics
In the following analysis, the vintages in the ECB’s SDW, covering data for the reference periods June 2005 to August 2018, have been used to analyse how the monthly revisions received between August 2005 and October 2018 at t+1, t+3, t+6 and t+12 months have cumulatively impacted the monetary aggregates and their components after their initial publication in press releases[19].
This revision analysis updates the analysis given in the 2016 Quality Report by extending the data range by 24 months.
3.1.1.1 Revisions of euro area monetary aggregates
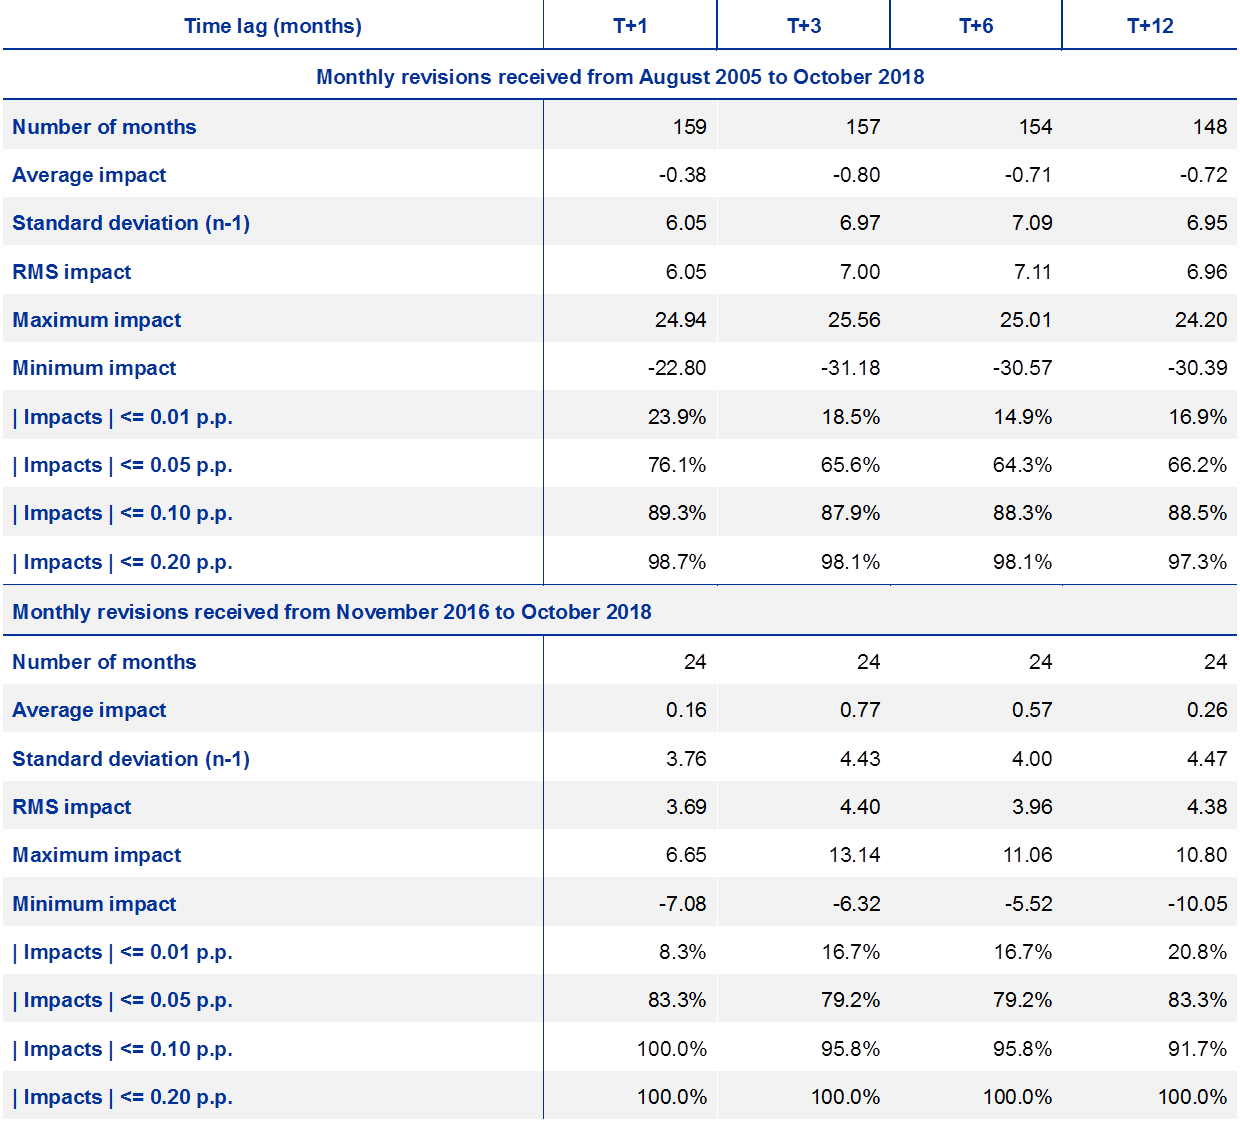
In general, the impact of the cumulative revisions on all published monetary aggregates, including the broad aggregate M3, continue to be very small/unnoticeable in monthly growth rates of the monetary aggregates. Moreover, the impacts of the revisions received (measured by root mean square (RMS), as defined below) from November 2016 to October 2018 continue to be smaller for all monetary aggregates in comparison with the reception period from August 2005 to October 2018.
As growth rates are published to one decimal place, changes lower than 0.05 p.p. do not affect the published figures in practice. In that regard, approximately 66% of all M3 month-on-month growth rates remained practically unchanged for all revisions received from August 2005, as their cumulative impact at t+12 was lower than 0.05 p.p. in absolute terms (see Table 2). This is an increase of 3 p.p. in comparison with the period from August 2005 to October 2016 covered in the previous quality report. Considering the same reception period, 89% and 97% of the initially published growth rates saw changes a posteriori below 0.10 p.p. and 0.20 p.p. respectively.
Interestingly, the revisions were substantially lower for the reception period from November 2016 to October 2018, as 83%, 92% and 100% of the initially published M3 growth rates were impacted by changes below 0.05, 0.10 and 0.20 p.p. respectively (see Table 2). In comparison with the period November 2014 to October 2016, this represents an increase of 4.0 p.p. and 0.0 p.p. respectively.
Using the same 0.05 p.p. metric, at time lag t+1, the figure for unchanged M3 growth rates is 76% since August 2005 (83% since August 2016). At time lag t+3, the figure for unchanged growth rates is 66% since August 2005 (79% since June 2016). At time lag t+6, the figure for unchanged growth rates is 64% since August 2005 (79% since March 2016).
With regard to revisions received since August 2005, the bias (simple average) vis-à-vis early estimates for month-on-month M3 growth rates varies between ‑0.004 p.p. at time lag t+1 and 0.007 p.p. at t+12 (see Table 2), which are negligible values.
The RMS of the total impacts on the M3 growth rate ranges between 0.061 p.p. at time lag t+1 and 0.07 p.p. at time lag t+12. This is also small, as an RMS impact of 0.07 p.p. represents 15.0% of the RMS differences observed between monthly growth rates during the same reception period (i.e. with reference periods from June 2005 to September 2017)[20].
It is worth noting that the impacts of the cumulative revisions received from November 2016 had, in general, a smaller effect on the M3 growth rate than in previous years, namely the RMS impact at t+12 is 0.04 p.p. compared with 0.07 p.p. for all revisions received from August 2005. This lower number may partially be related to M3 growth rates being less volatile in recent years, as the RMS of the differences between the monthly M3 growth rates is also significantly lower. For revisions received since November 2016, the RMS of differences is 0.316 p.p., compared with 0.466 p.p. for revisions received since August 2005 (on the t+12 corresponding ranges). However, a slight improvement is still apparent in the RMS impact of cumulative revisions (up to t+12) received since November 2016 when compared with the RMS differences observed between growth rates during the corresponding reference period (from October 2015 to September 2017), resulting in a ratio of 13.9%. This ratio of 13.9% is to be compared with the 15.0% ratio above. Both figures are too small to hinder a proper analysis and interpretation of the monthly variations seen in month-on-month M3 growth rates.
Impact of cumulative revisions on the initially released M3 growth rates
(hundredth of percentage points)
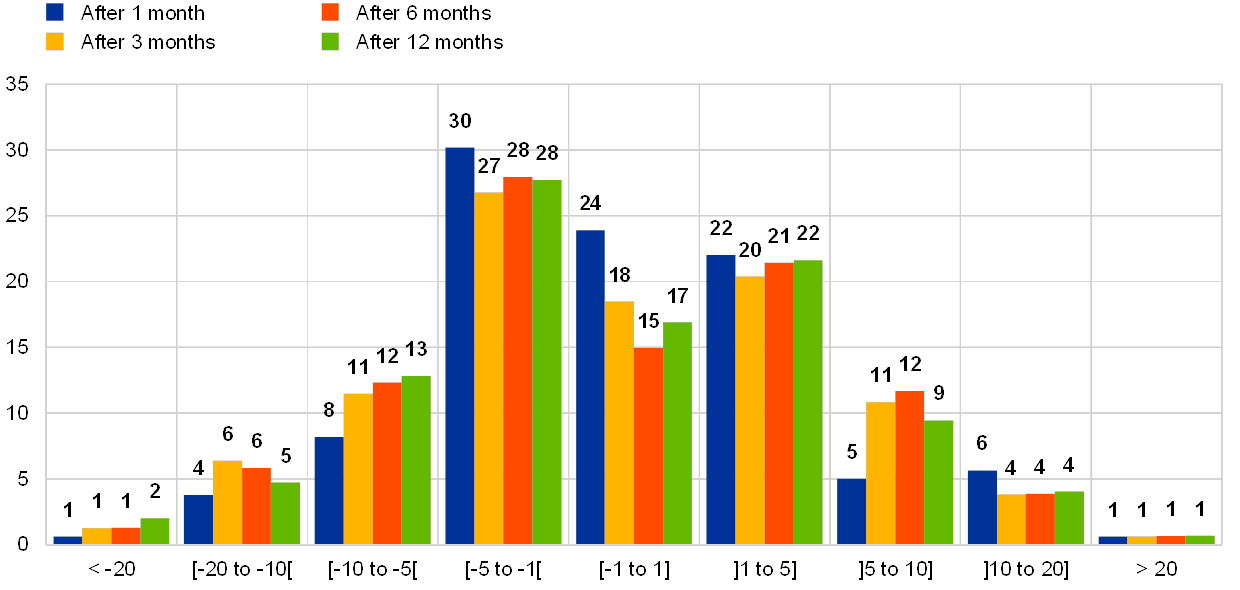
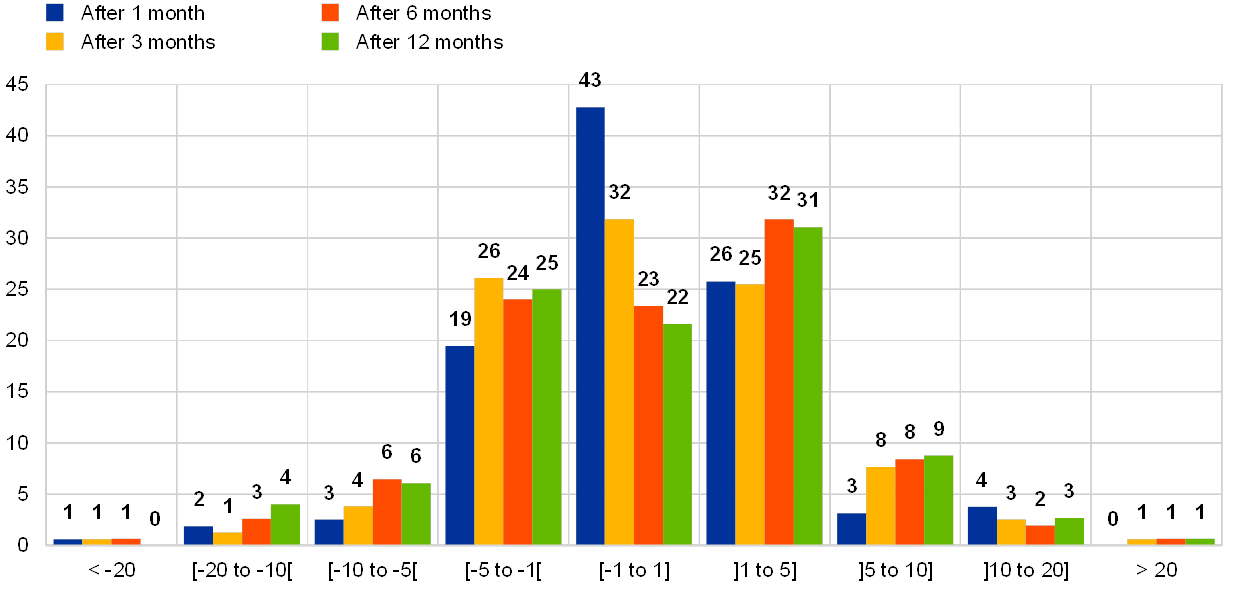
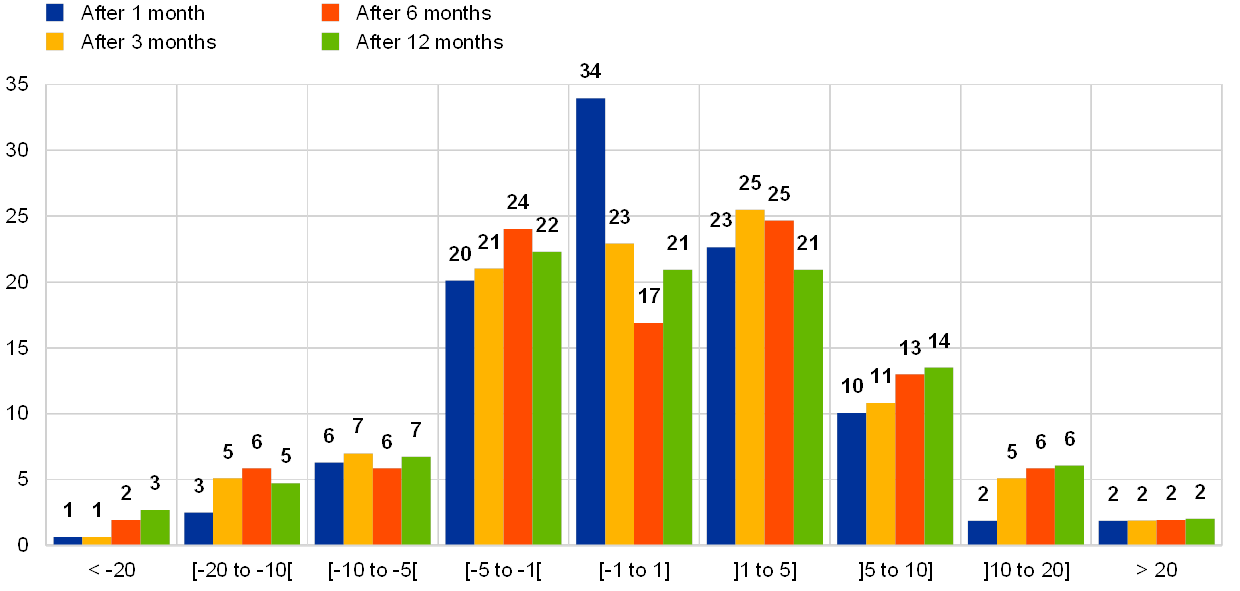
Regarding the development of revisions over time, one would expect that the initial revisions should usually take place early, mostly within the first three months following initial release, and that no significant further revisions would then be received in the subsequent periods. This situation is verified in practice, as depicted in Charts 1 and 2. It is more prominent for the revisions received from November 2016 (see Chart 2), which show a narrowing of the distribution compared with the situation when all revisions since August 2005 are considered.
Impact of cumulative revisions received monthly from August 2005 to October 2018 on the initially released M3 growth rates
(number of occurrences averaged over 100 months)
Impact of cumulative revisions received monthly from November 2016 to October 2018 on the initially released M3 growth rates
(number of occurrences averaged over 100 months)

As shown below, similar conclusions can be drawn with regard to M1 and M2 growth rates. While M1 growth rates show, overall, behaviour similar to that of M3 growth rates, M2 growth rates are less impacted by revisions than M3 growth rates.
Regarding the month-on-month M2 growth rate, the RMS impacts of the cumulative revisions received from August 2005 range between 0.043 p.p. at time lag t+1 and 0.052 p.p. at time lag t+12 (see Table 3). These values are smaller (i.e. better) than the RMS impacts measured for the M3 growth rate. Regarding the revisions received from November 2016, the RMS impacts are 0.027 p.p. at t+1 and 0.035 p.p. at t+12, which are even smaller. This is a significant improvement compared with the period from November 2014 to October 2016, when the respective RMS impacts were 0.035 p.p. at t+1 and 0.046 p.p. at t+12. All in all, the impact of revisions to the month-on-month M2 growth rates has been marginal.
Impact of cumulative revisions on the initially released M2 growth rates
(hundredth of percentage points)

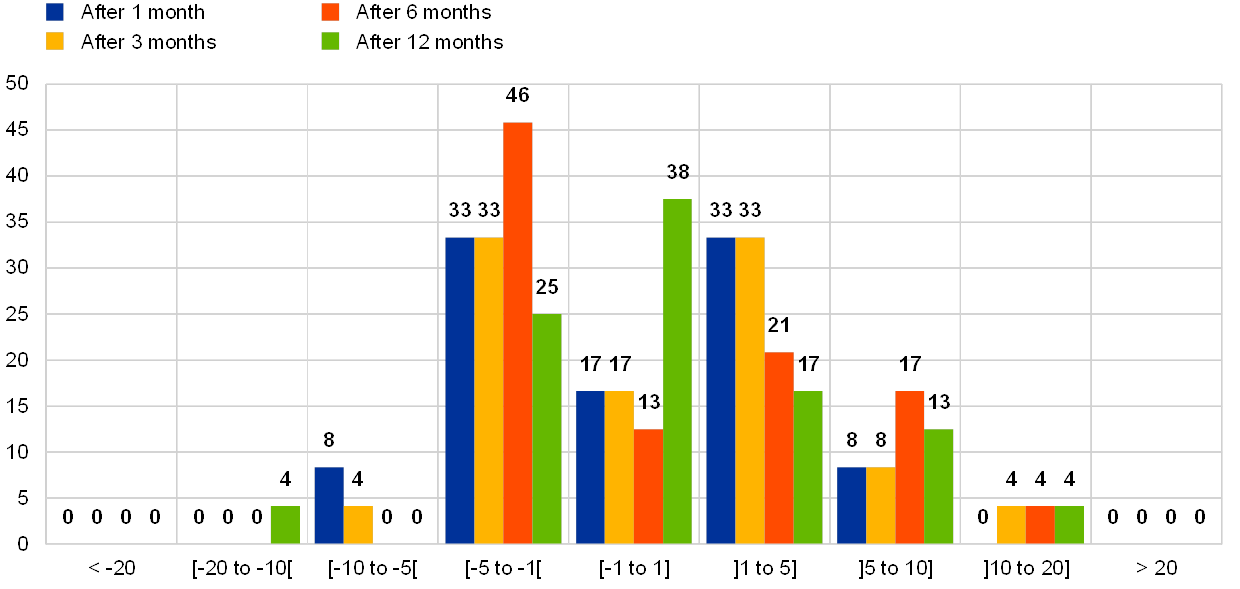
As shown in Chart 3, there are usually no significant further revisions impacting M2 growth rates after the initial release. This is even more evident when looking at the cumulative revisions received since November 2016, as the revisions with impacts higher than 10 b.p. disappear entirely (see Chart 4). Furthermore, 88% of the initially published M2 growth rates were impacted by changes below 0.05 percentage points.
Impact of cumulative revisions received monthly from August 2005 to October 2018 on the initially released M2 growth rates
(number of occurrences averaged over 100 months)
Impact of cumulative revisions received monthly from November 2016 to October 2018 on the initially released M2 growth rates
(number of occurrences averaged over 100 months)
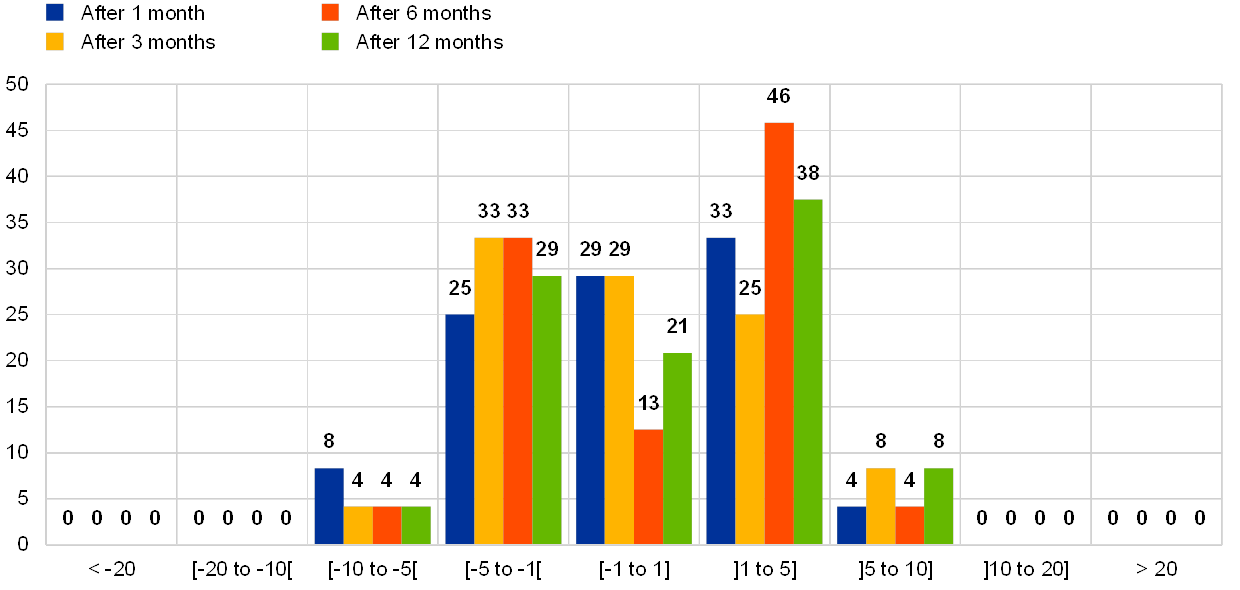
Table 4 summarises the impacts of cumulative revisions on the month-on-month M1 growth rate. Regarding the revisions received since August 2005 with a time lag of t+12 that had an impact on the growth rate in excess of 0.10 p.p. in absolute terms, a larger percentage can be observed for the M1 growth rate than for the M2 or M3 growth rates. Indeed, the figures are 16%, 7% and 12% for the M1, M2 and M3 growth rates respectively. The situation improves when only the revisions received from November 2016 are considered: the figures are then 8%, 0% and 8% for the M1, M2 and M3 growth rates respectively.
A significant improvement concerns the RMS impact, which is 0.083 p.p. when considering all cumulative revisions up to t+12 from August 2005, dropping to 0.048 p.p. when the same observation is made for revisions from November 2016.
Impact of cumulative revisions on the initially released M1 growth rates
(hundredth of percentage points)

The improvement in the impact of revisions to the M1 growth rate that can be observed since November 2016 can also be seen by comparing Chart 5 and Chart 6.
Impact of cumulative revisions received monthly from August 2005 to October 2018 on the initially released M1 growth rates
(number of occurrences averaged over 100 months)
Impact of cumulative revisions received monthly from November 2016 to October 2018 on the initially released M1 growth rates
(number of occurrences averaged over 100 months)
3.1.1.2 Revisions of components of euro area monetary aggregates
The following graphs present the cumulative impacts of revisions to the components of the euro area monetary aggregates as they develop over time.
For the sake of conciseness, only the impacts of the revisions at time lags t+3 and t+12 are shown. Since no more significant revisions are expected after t+3, the cumulative impacts of all revisions at t+12 are not expected to bring additional changes to the revisions, which is indeed the case, as shown in the following graphs (see Charts 7 to 9): all lines plotted at t+3 and at t+12 for the same components are very close.
The same reference period is used for all graphs, namely from January 2008 to August 2018. This time range was selected to provide a clear picture of the overall trend in the impacts of revisions on the growth rates. It shows that impacts have generally decreased since 2011.
Chart 7 shows the impact of revisions distributed over the two components of the M1 monetary aggregate, namely “currency in circulation” and “overnight deposits”. As expected, there are almost no revisions to currency in circulation. In the recent period we can observe some very small peaks, but most of them, for example those in August 2016 and December 2017, are confirmed as ordinary revisions, which are revisions provided after one month to adjust figures initially released as provisional. In contrast, revisions of overnight deposits are more prominent. In the period from November 2016 to August 2018, however, the magnitude of these revisions remained within the scope observed in the past, with a small peak observed in July 2017.
Impacts of revisions to M1 components at t+3 and t+12 months
(hundredths of a percentage point)
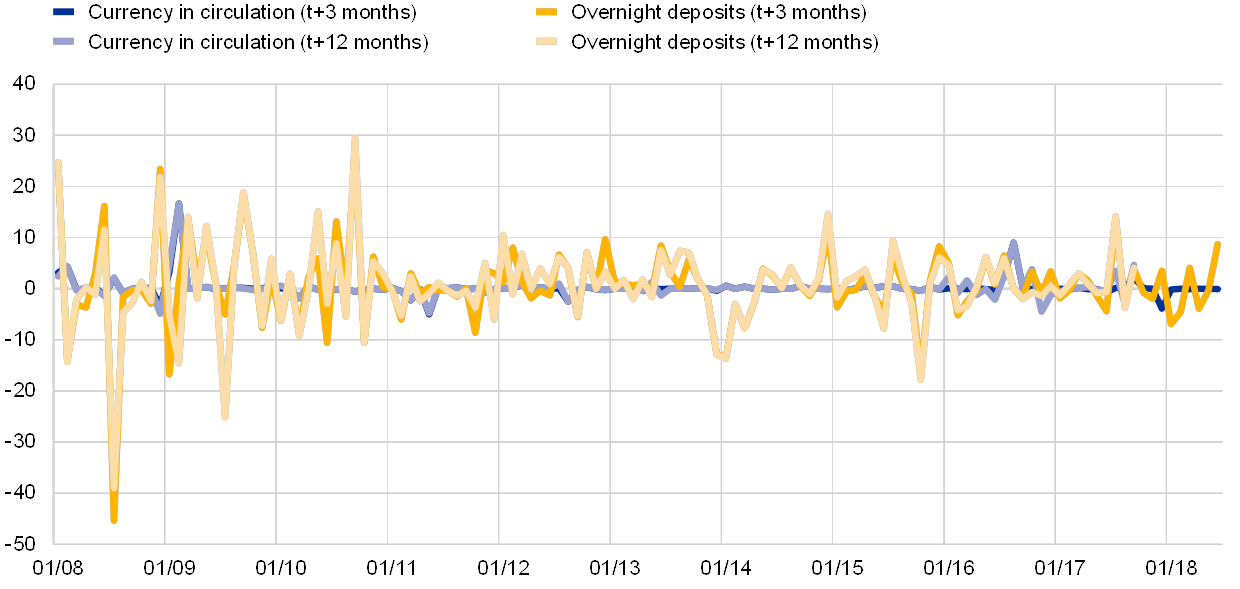
Chart 8 shows the impact of revisions distributed over the two components of M2‑M1, namely “deposits with an agreed maturity of up to two years” and “deposits redeemable at notice of up to three months".
With regard to revisions for reference periods after November 2016, the two peaks in May 2017 and January 2018 were due to regular revisions provided one or two months after the reference period.
Impacts of revisions to M2‑M1 components at t+3 and t+12 months
(hundredths of a percentage point)
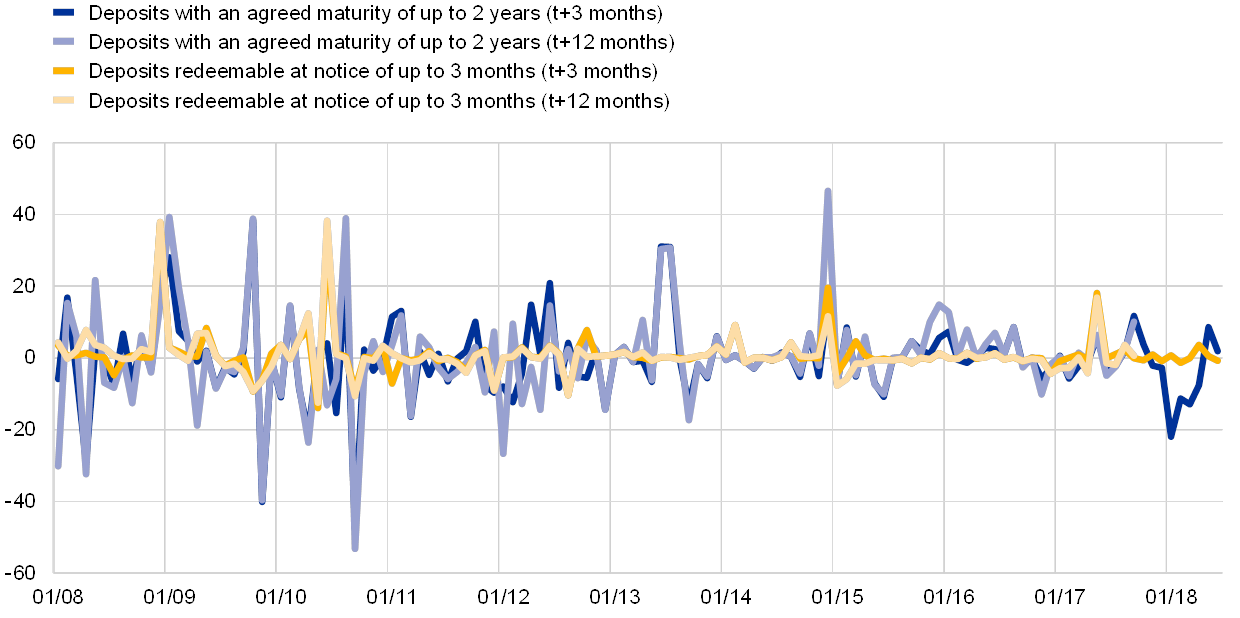
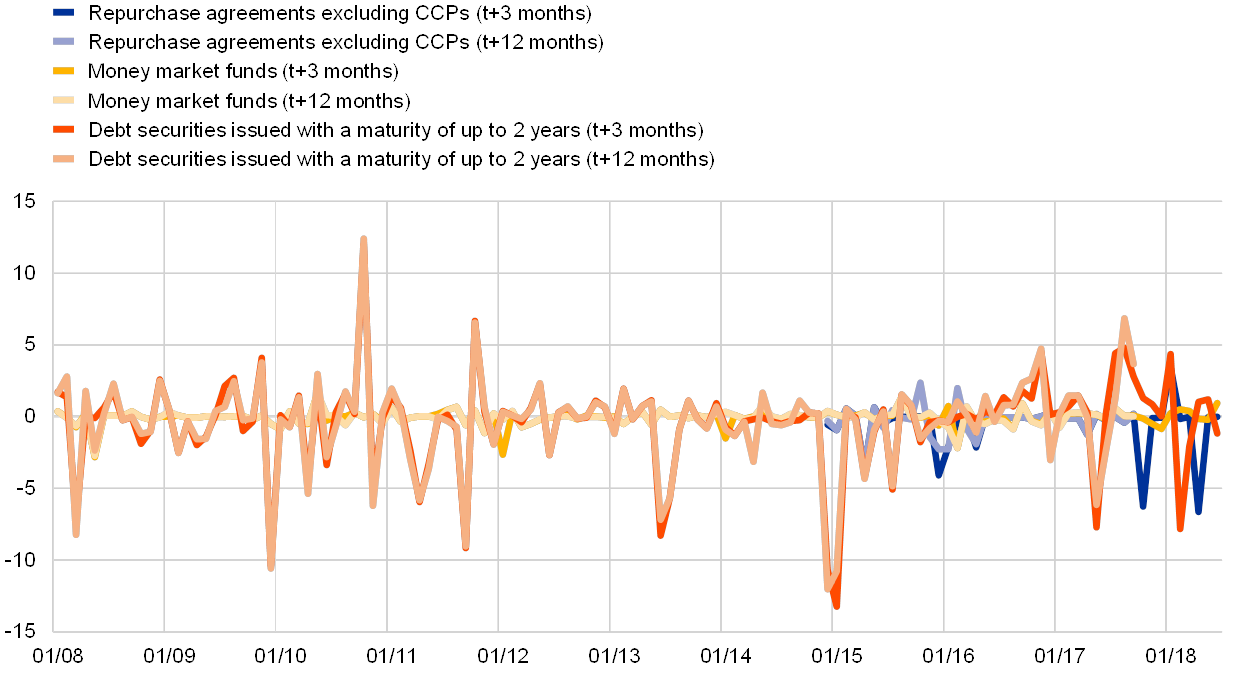
Chart 8 shows the impact of revisions distributed over the three components of M3‑M2, namely “debt securities issued with a maturity of up to two years”, “money market funds” and “repurchase agreements excluding repos with central counterparties”. The latter component was introduced with the Regulation in 2014 and replaced the old series on “repurchase agreements”. This is also why these series start only in December 2014.
With regard to revisions after November 2016, we observe that “debt securities issued with a maturity of up to two years” is still the item responsible for the largest revisions of M3‑M2. Of the three series, “money market funds” is typically the least revised, followed by “repurchase agreements excluding CCPs”, which is revised more often, and for larger values, than the old series “repurchase agreements”. These revisions must also be seen in the context of relatively large flow movements and relatively small outstanding amounts in the underlying series[21]. This leads to volatile month-on-month component growth rates with ultimately little impact on the growth rate of the broad M3 monetary aggregate.
Impacts of revisions to M3‑M2 components at t+3 and t+12 months
(percentage points)
3.1.1.3 Contributions of revisions in instruments to overall M3 revisions
In order to assess the contributions of individual instruments to the revisions of M3, the share of each instrument in the aggregate needs to be taken into account. Chart 10 shows the breakdown of contributions to M3 revisions. The largest contributions to the overall M3 revisions primarily stem from “debt securities issued with a maturity of up to two years”, “overnight deposits” and “money market funds shares/units”.
Breakdown of contributions to M3 revisions
(hundredths of a percentage point)

3.1.1.4 Overall assessment of revision analysis of the BSI statistics
The analysis shows that revisions to the month-on-month growth rates of both M3 and M2 for the euro area continue to be very limited. Overall, for M3 at t+1, 76% of all revisions received since August 2005 have had an impact on the growth rates of less than or equal to 0.05 p.p., which is the metric for an unchanged growth rate. This ratio is 83% for all revisions received since November 2016. At t+3, the ratio for unchanged growth rates is 66% for revisions received since August 2005 (79% for those received since November 2016). At t+6, the ratio is 64% for revisions received since August 2005 (79% for those received since November 2016) and at t+12 the ratio is 66% (83% for revisions received since November 2016). When comparing results for revisions received since November 2016 with the period covered by the last quality report from November 2014 to October 2016, we observe a slight improvement, with an increase of 4 p.p. for time lags t+3 and t+12, signalling a more stable state with fewer revisions resulting from the implementation of ECB Regulation ECB/2013/33. Furthermore, the average impact of revisions on the M3 growth rate after one year is ‑0.0072 p.p. for those received since August 2005 and +0.0026 p.p. for those received since November 2016. Notably, no revisions were received since November 2016 that exceeded 0.20 p.p. for any of the three monetary aggregates.
The concentration of revisions to the M1 month-on-month growth rate between ‑0.05 and +0.05 p.p. is 77% at t+1 and 64% at t+12 for those received since August 2005 (83% and 79%, respectively, for those received since November 2016). Although a larger number of revisions exceeding 0.20 p.p. in absolute terms could be observed for M1 than for M2 or M3 for those received since August 2005, this is no longer an issue for those received since November 2016. Among the M3 components, revisions to debt securities issued are most frequent but have little impact on M3 owing to the fact that the share of this instrument in broad money is below 1%.
3.1.2 Revision analysis of the euro area MFI interest rate statistics
In the following revision analysis for MFI interest rate statistics, monthly data received from euro area NCBs between November 2016 and October 2018 covering reference periods from January 2003 to October 2018 have been used to analyse revisions to euro area aggregates. Only revisions equal to or greater than 1 b.p. have been considered for the purpose of the analysis, as revisions of less than 1 b.p. are not visible in the published data.
As shown in Chart 11, revisions to the euro area aggregates for MFI interest rate indicators are generally very small and follow the expected pattern of a higher concentration of revisions in the lower range (-5 to +5 b.p.) with a short time lag (t+1)[22]. This means that after an initial revision has taken place, which usually happens in the month after the first release (i.e. “ordinary revisions”) or shortly thereafter, there are usually not many significant revisions in subsequent periods[23].
Revisions of euro area aggregates of MFI interest rate statistics
(x-axis: size of the revision in basis points; y-axis: number of occurrences)
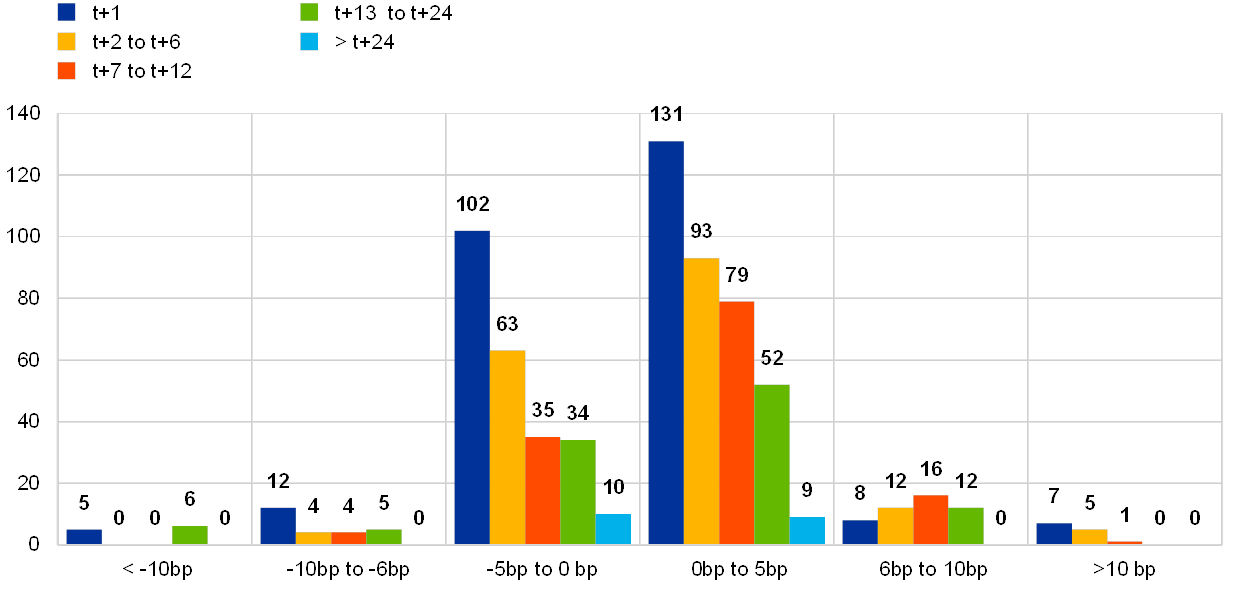
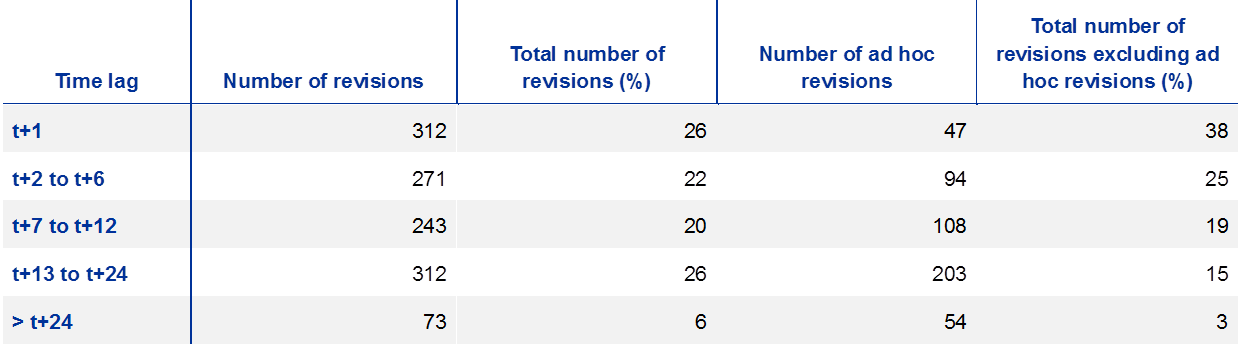
Around 90% of all revisions are concentrated between ‑5 b.p. and 5 b.p. (see Table 6). With respect to the time lag, a substantial number of revisions happen in the month after the initial release (ordinary revisions). Other revisions can be divided as follows: 22% correspond to the period of 2 to 6 months preceding the current reference month, 20% correspond to the period of 7 to 12 months preceding the current reference month, 26% of revisions refer to the period of the previous 13 to 24 months and 6% are revisions to statistics that extend beyond 24 months from the reference month (see Table 5). In addition, several NCBs have sent revisions of several time series by reporting agents with an impact on euro area aggregates for at least 12 reference periods in a single monthly transmission. This category of revision is considered “ad hoc” in this analysis, owing to the exceptional reasons for their occurrence and their particular characteristics.
Number of revisions per time lag
Number of revisions per range
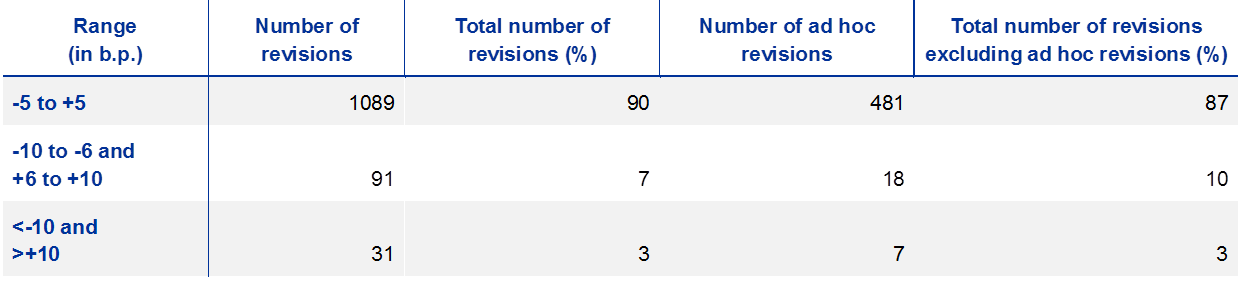
The sample mean of revisions affecting euro area aggregates is equal to 0.007 b.p., while the corresponding absolute mean is equal to 0.03 b.p.
The number of revisions is actually very small compared with the number of indicators used for the analysis (106)[24] and the potential number of reference periods revised (from October 2018 back to January 2003, with a monthly frequency). Furthermore, it is worth noting that 13% of the indicators in the study were not revised during the period under analysis.
Overall, in comparison with the number of observations, the number and size of revisions to the MFI interest rate statistics at the euro area level are small, which demonstrates their reliability. The number of exceptional and ad hoc revisions, as opposed to ordinary revisions, shows that MFI interest rate statistics are being continuously updated and therefore their accuracy is continuously improving.
3.2 Quality measures under preparation
3.2.1 Comparing SHS with BSI
Following previous initiatives, cross-checks were carried out, using granular data on securities holdings (provided in the Securities Holdings Statistics Database, SHSDB), with the relevant positions in monetary and financial statistics. When considered necessary, there was a follow up with the NCBs. Such exercises proved to be very useful and the comparison yielded a higher quality in both MFS and SHS data, as some discrepancies in the datasets were identified and corrected.
Furthermore, in 2017, the WG MFS and the Working Group on Security Statistics invited their members to contribute jointly to a fact finding questionnaire on the analysis of MFI BSI data on the residency of the counterparties of securities issued by euro area MFIs. The aim of this exercise was to assess whether data collected in the context of the security holdings statistics by sector (SHSS) initiative can be used as an alternative source for breaking down the issuance of MFI securities according to the holder’s residency, instead of using the memorandum items in the BSI statistics. The latter are mostly based on estimates carried out either by the NCBs or the ECB.
The outcome of this study revealed synergies between the use of SHSS and the derivation of the relevant BSI memorandum items. Thus, the use of SHSS is perceived by many NCBs to be particularly beneficial. Additionally, amended Guideline ECB/2016/23, introduced in October 2018 (i.e. with a reference period of the third quarter of 2018), brings additional efficiency gains in the use of the SHSS to estimate BSI memorandum items, using the new features for identifying own holdings and non-ISIN securities. The WG MFS will continue liaising with its members to foster further methodological issues related to the completion of the above-mentioned BSI memorandum items, as well as investigating further the possibility of using available SHS data to compile these data or to improve their quality.
3.2.2 MIR statistics – synthetic mean absolute error
Following the entry into force of Guideline ECB/2014/15, the synthetic mean absolute error (MAE) was introduced as a measure of sample quality in MIR statistics. In particular, if an NCB applies sampling when selecting the reporting population and selects the largest institutions in each stratum, the actual synthetic MAE should not exceed a time-varying MAE threshold assuming a 10 b.p. error difference in each stratum and indicator. The maximum random error is used as a measure of the sample quality if the NCB applies random sampling in the selection of reporting institutions and should not exceed 10 b.p., on average, at a confidence level of 90%.
According to the provisions set out in the aforementioned Guideline, NCBs should check the representativeness of their sample at least once a year. If there are significant changes in the reference reporting population, these must be reflected in the sample. Moreover, at maximum intervals of three years, NCBs must carry out a regular review of the sample. A new estimate of the sample quality is provided after each round of maintenance of the sample.
© European Central Bank, 2019
Postal address 60640 Frankfurt am Main, GermanyTelephone +49 69 1344 0Website www.ecb.europa.eu
All rights reserved. Reproduction for educational and non-commercial purposes is permitted provided that the source is acknowledged.
For specific terminology please refer to the ECB glossary (available in English only).
PDF ISBN 978-92-899-3642-2, ISSN 1831-4147, doi:10.2866/489902, QB-BD-19-001-EN-NHTML ISBN 978-92-899-3864-8, ISSN 1831-4147, doi:10.2866/1782, QB-BD-19-001-EN-Q
- [1]The Eurosystem is the central banking system of the euro area. It comprises the ECB and the NCBs of the EU Member States that have adopted the euro. The mission statement of the Eurosystem.
- [2]Protocol of the Statute of the European System of Central Banks and of the European Central Bank.
- [3]For further details, see: https://www.ecb.europa.eu/press/calendars/statscal/mfm/html/index.en.html.
- [4]Available at: https://www.ecb.europa.eu/pub/economic-bulletin/html/index.en.html.
- [5]Available at: http://sdw.ecb.europa.eu/reports.do?node=1000003503.
- [6]ECB Regulation on statistical reporting requirements for pension funds (ECB/2018/2).
- [7]Directive (EU) 2015/2366 of the European Parliament and of the Council of 25 November 2015 on payment services in the internal market (OJ L 337, 23.12.2015, p. 35).
- [8]Regulation (EU) 2015/751 of the European Parliament and of the Council of 29 April 2015 on interchange fees for card-based payment transactions (OJ L 123, 19.5.2015, p. 1).
- [9]Concerning the information on payment fraud, the EBA published guidelines on fraud statistics under PSD2 on 18 July 2018, covering payment transactions and fraudulent payment transactions for payment instruments and services reported by the issuing PSP and, in the case of card payments, also by the acquiring PSPs. It is envisaged that a single reporting line will be established from the reporting agents via the NCBs and NCAs to the EBA and ECB that would satisfy the reporting requirements laid down in both the revised regulation and the EBA Guidelines. To this end, the ECB and the EBA aligned the definitions and methodology of the EBA Guideline with the forthcoming ECB regulation.
- [10]The ECB’s merits and costs procedure in the field of European statistics.
- [11]Manual on investment fund statistics.
- [12]Manual on MFI balance sheet statistics.
- [13]Notional cash pooling is a service provided by some banks that allows corporations to externalise intragroup cash management and thus manage their global liquidity effectively with lower costs.
- [14]Survey of national practices regarding MFI balance sheet statistics.
- [15]See also: http://ec.europa.eu/finance/insurance/solvency/solvency2/index_en.htm.
- [16]OJ L 86, 1.4.2016, pp. 42 ff.
- [17]Completeness check: enables missing series to be detected.
- [18]Internal consistency checks: verify that all linear constraints are correctly applied in the data received, for example, that balance sheet balances and totals and sub-totals add up; intra-period consistency checks: verify, for example, that the sum of monthly transaction values equals the quarterly values and that end-year stocks equal end-December stocks.
- [19]The cut-off date for the analysis was the end of October 2018. The most recent data available are therefore for the reference period September 2018 (data are received with a one-month lag). As revisions may, at best, apply to data from the previous month, the most recent reference period available for this analysis is August 2018.
- [20]Regarding the time range that corresponds to the time lag t+12 (for which the impact of all revisions up to the time lag t+12 can be analysed), the RMS of the differences between the monthly M3 growth rates was 0.466 p.p., which is 6.7 times the RMS impact of cumulative revisions.
- [21]Attention must be given to the ranges of the impact scale of revisions displayed in the graphs. For (M3‑M2) the range goes up to 14.0 p.p., for (M2‑M1) it goes up to 0.4 p.p. and for M1 is goes up to 0.25 p.p.
- [22]The distribution of revisions of euro area aggregates of MFI interest rate statistics that is displayed in Chart 11 does not include ad hoc revisions.
- [23]The revision policy set out in Article 17 of Guideline ECB/2014/15 recognises that NCBs may need to revise the previous reference month’s data. It provides that revisions applied to data prior to the previous reference period, which are considered exceptional, should always be accompanied by explanatory notes.
- [24]The analysis covers the 117 rate indicators defined in Regulation ECB/2013/34 and Guideline ECB/2014/5. Of these, 11 indicators, which are totals or aggregates of sub-indicators, have been removed so as to avoid double-counting of revisions.