
How much capital should banks hold?
27 January 2021
Episodes such as the current coronavirus (COVID-19) crisis might lead to a significant rise in borrower defaults and, consequently, weakness in the banking sector. Having well-capitalised banks makes the financial system more resilient to such episodes. We assess how much capital would be optimal for banks to hold, taking into consideration the risk of banking crises driven by borrower defaults (which we term “twin default crises”).
We find that, in the context of our model, bank capital requirements of around 15% provide the optimal trade-off between lowering the frequency of banking crises caused by borrower defaults and maintaining the availability of credit in normal times. While the exact figure depends on a number of assumptions, it is higher than the Basel III minimum and than the optimum implied by macroeconomic frameworks that underestimate or neglect the impact of borrower default on bank solvency.
Introduction
How do banking crises occur and how can bank capital requirements and other macroprudential policies help reduce the frequency and severity of these crises? Since the global financial crisis in 2008-2009, the field of macroeconomics has made big strides in integrating banking and financial frictions into standard analytical frameworks. This has helped deliver new quantitative insights into this question. Nevertheless, more than a decade after the financial crisis, the optimal level of bank capital requirements remains an open question.
To assess the optimal level of capital requirements, it is crucial to quantify their benefits and costs. Higher capital requirements reduce the probability of banking crises at the expense of restricting the supply of bank credit in normal times. To evaluate this trade-off we provide a framework that captures well the behaviour of the economy not only in normal times but also during periods of banking crises driven by bank equity declines (Baron, Verner and Xiong, 2019).
One specific challenge that has not been addressed in the current debate is to properly quantify the channels via which borrower defaults lead to bank insolvency. In Mendicino, Nikolov, Ramirez, Suarez and Supera (2020), we develop a structural general equilibrium model of bank default risk and undertake a quantitative exploration of the role of borrower defaults in generating rare but severe episodes of bank failures, which are associated with large output losses. We show that underestimating the impact of borrower defaults on bank solvency biases downwards the optimal level of bank capital requirements.
The mechanism
In our framework, banks’ solvency problems arise endogenously from high default rates among their borrowers. Loans have limited upside potential because healthy borrowers merely repay the contractually agreed amount including interest. However, they carry significant downside risk due to the possibility of default. Although we are not the first to point out this asymmetry in returns (e.g. Nagel and Purnanandam (2019)), we explore its implications in a quantitative general equilibrium model. The asymmetric returns on bank loans lie at the heart of our mechanism.
Figure 1 below shows how this insight operates in a simple model of a bank holding a portfolio of loans. The left panel shows the return on the loan portfolio as a function of the average productivity of the borrowing firms. We can clearly see how the return on the portfolio is insensitive to borrower productivity when the latter is high, but it deteriorates sharply as productivity falls. The right panel of Figure 1 shows the distribution of the rates of return banks receive on loans. They are highly skewed to the left: this means that the most likely outcome is that most borrowers repay fully; but there is a long left tail of very low returns due to high borrower defaults. The key observation is that this left skewness in the distribution of bank loan portfolio returns arises endogenously due to the non-linear returns of bank loans (or, more generally, debt contracts), even when the shocks to the productivity of borrowing firms have a standard log-normal distribution. In other words, bank returns are asymmetric even if the shocks that affect borrowers are fully symmetric.
Figure 1
Bank asset returns as a function of the borrowing firms’ productivity (left panel) and the probability distribution of banks’ asset returns (right panel) when asset risks stem from borrower default

Source: Mendicino et al (2020).
The asymmetry shown in the chart arises endogenously in our model and implies that bank balance sheets are more sensitive to recessions than to booms. Most of the time, therefore, banks are very stable and safe but a sufficiently deep recession can push them to insolvency. Capturing this fact allows our model to match the economy’s behaviour in normal times while generating rare but severe “twin default” crises – i.e. episodes of high firm defaults that result in bank solvency problems and deep recessions. During such episodes bank solvency is much more sensitive to the health of its borrowers. The probability of bank default also becomes more highly correlated with GDP growth.
One way of representing the non-linear relationship between firm and bank default risk and GDP growth is through quantile regressions. Rather than focusing on average co-movements as ordinary least squares regressions do, quantile regressions allow for a different relationship at different points in the distribution of defaults and economic activity. They are a good way to describe the non-linearities in economic relationships in the data.
The results in the left panel of Figure 2 below indicate that the impact of firm default on bank default in the data (red line) is higher when banks are more fragile and their probability of default is already elevated. The black line shows that the model replicates this non-linear relationship very closely. In addition, the right panel of Figure 2 shows that there is a strong negative link between GDP growth and bank default at lower quantiles of GDP growth (i.e. in recessions). This is consistent with the importance of financing conditions as a determinant of the economy’s downside risk (Adrian, Boyarchenko and Giannone, 2019). Our model (black line) can mimic these non-linearities well thanks to the non-linear structure of bank asset returns, which also determines its ability to reproduce the frequency and severity of episodes of high firm and bank defaults and the associated deep recessions.
Figure 2
The non-linear relationship between firm defaults, bank defaults and GDP growth in the euro area: 1992-2016
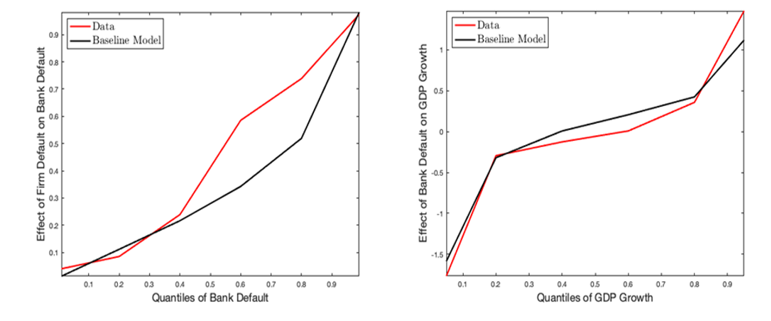
Source: Mendicino et al (2020). The y-axis shows the coefficients of a regression of Bank default on Firm default (left panel) and of GDP growth on Bank Default (right hand side)
Implications for the optimal level of capital requirements
Having built a model of banking crises driven by borrowers’ defaults, we use it to analyse the optimal level of bank capital requirements, i.e. that keeps the banking system safe without imposing unduly large output costs. We find that, at this optimal level, the probability of a banking crisis is considerably reduced because the banking sector is more robust to economic shocks. This is beneficial because crises are costly and reduce welfare significantly when they occur. However, higher capital requirements also entail costs in normal times because they increase loan interest rates and lower investment and output. The optimal level of bank capital requirements takes these costs into account.
The black solid line in Figure 3 below shows how social welfare changes with bank capital requirements. Higher capital requirements impose a trade-off between reducing the probability of twin default crises and maintaining the supply of bank credit in normal times. According to our model, a capital requirement of approximately 15% is optimal.[2] Compared with the 8% (pre-financial crisis) capital requirement, welfare is higher at the optimal level because the gains from the reduction in the probability of bank defaults outweigh the losses from imposing higher funding costs on banks. Once the capital requirement exceeds 15%, however, the negative effect of elevated borrowing costs for firms dominates and welfare declines.
Figure 3
Welfare effects of bank capital requirements

Source: Mendicino et al (2020). The y-axis shows the level of Social welfare, measured as the welfare of the representative household in the model. The Merton-type model is a version of our model which assumes that banks’ rate of return on loans is log-normally distributed.
Crucially, the frequency and severity of banking crises driven by borrower defaults is a key determinant of the optimal level of capital requirements prescribed by the model, and ignoring it biases the optimal level downward. To show this we build a variant of our model that mimics the commonly used Merton-type approach to bank default risk.[3] This variant does not capture the non-linearity in bank asset returns and, hence, the frequency and severity of twin default crises observed in the data.
The blue dashed line in Figure 3 reports the impact of capital requirements on welfare under this alternative Merton-type approach to bank asset returns.[4] Even though, at the pre-financial crisis (baseline) capital requirement the ex-ante probability of bank default is calibrated to be the same in both models, it turns out that the optimal capital requirement is around 5 percentage points lower in the Merton-type approach. This is because in our model bank insolvencies are driven by borrowers’ defaults. This means that bank insolvencies involve very large deadweight losses and severe contractions in economic activity. In contrast, the Merton-type approach understates the costs associated with bank default and, hence, biases downwards the net benefits of higher capital requirements.
Conclusions
While our paper does not directly address the COVID-19 crisis, its focus on banking crises driven by borrowers’ defaults makes it very relevant in the current context. The ongoing severe losses experienced by bank borrowers could, if they result in corporate defaults, spill over to banks and result in severe weakness in the banking sector. Our results stress how bank capital regulation can have a crucial role in mitigating the feedback loop between borrowers’ and banks’ default risk. The efforts to increase bank capital ratios since 2010 have enhanced banks’ and the overall economy’s protection against such a crisis. Our results also indicate that the welfare losses from having capital ratios above what is socially optimal are smaller than the losses from having capital ratios below the optimal levels prescribed by our model. This is due to the very high costs of the banking crises that capital buffers help to prevent. It is therefore important to rebuild bank capital buffers once the COVID-19 crisis has softened in order to make sure that banks and the economy remain protected against future adverse economic shocks.
References
Adrian, T., Boyarchenko, N. and Giannone, D. (2019), “Vulnerable growth”, American Economic Review, 109(4), 1263-89.
Baron, M., Verner, E. and Xiong, W. (2020), “Banking crises without panics”, Quarterly Journal of Economics, forthcoming.
Nagel, S. and Purnanandam, A. (2020), “Banks’ risk dynamics and distance to default”, The Review of Financial Studies, 33(6), 2421-2467.
Mendicino, C., K. Nikolov, J. Rubio-Ramirez, J. Suarez, and D. Supera (2020), “Twin Default Crises”, ECB Working Paper No. 2414.
Merton, R. C. (1974), “On the pricing of corporate debt: The risk structure of interest rates”, Journal of Finance, 29, 449-470.
- The article was written by Caterina Mendicino (Lead Economist, Directorate General Research, European Central Bank), Kalin Nikolov (Lead Economist, Directorate General Research, European Central Bank), Juan Rubio-Ramirez (Emory University), Javier Suarez (CEMFI) and Dominik Supera (Wharton School, University of Pennsylvania). The authors gratefully acknowledge the comments of Michael Ehrmann, Luc Laeven, Simone Manganelli, Alberto Martin and Louse Sagar. The views expressed here are those of the authors and do not necessarily represent the views of the European Central Bank or the Eurosystem.
- This is higher than the Basel III minimum which is equal to 10.5% once the 2.5% Capital Conservation Buffer is fully loaded.
- Since Merton (1974), standard models of default assume a log-normal distribution of asset returns.
- In a Merton-type formulation it is generally assumed that bank asset risk is caused by exogenous log-normal shocks to bank asset returns.