
Natural gas dependence and risks to euro area activity
Published as part of the ECB Economic Bulletin, Issue 1/2022.
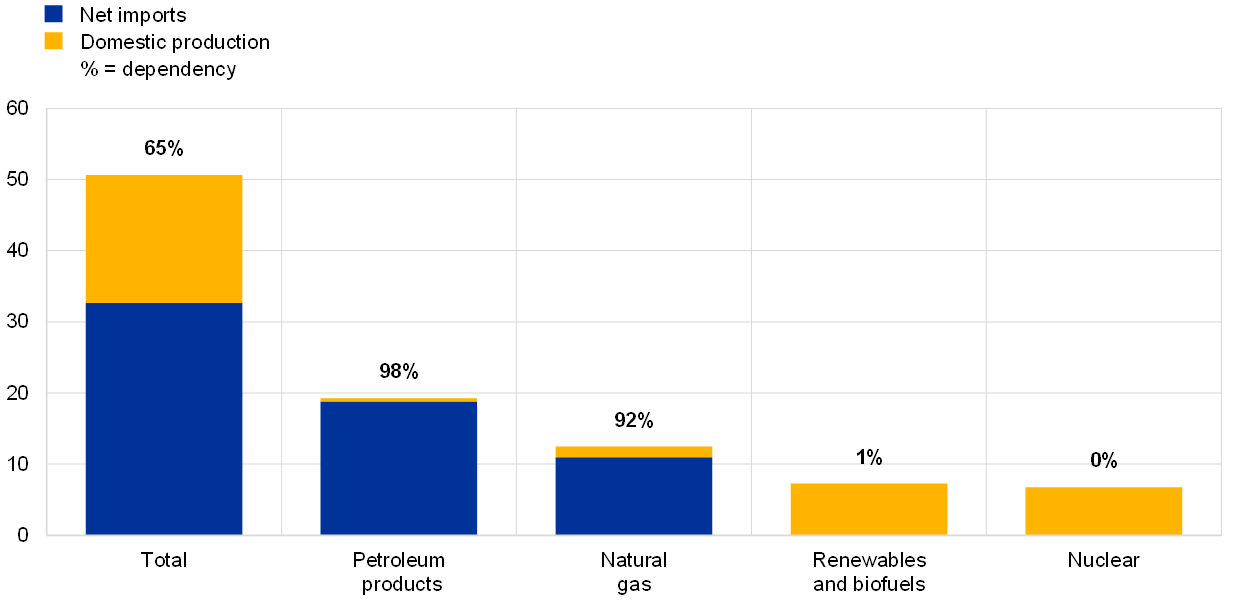
Natural gas is the second most important primary energy resource in the euro area, after petroleum-based products. It is the most important source of energy in the manufacturing sector, and more than 90% of the gas consumed in the euro area is imported. The euro area is heavily dependent on imports of both petroleum-based energy products and natural gas, while renewable energy and nuclear energy are predominantly domestically produced (Chart A, panel a). From an economy-wide perspective, petroleum-based energy is the most consumed, reflecting mainly its use in the transport sector. Gas is, by contrast, the primary energy source most consumed in the industrial sector and by (non-transport) services and households (Chart A, panel b). Gas also acts as the key marginal energy resource in electricity generation, given the flexibility of gas-fired power plants and the overall gas infrastructure (e.g. network interconnections, storage capacity and liquified natural gas terminals) in responding to fluctuations in electricity demand. The transition towards renewables – where supply depends on variable weather patterns – has increased this reliance. This box examines the impact of gas price increases and a possible rationing shock on economic activity in the euro area.
Chart A
Energy dependency and energy use by primary fuel type in the euro area
a) Euro area energy dependency
(millions of terajoules)
b) Use by primary fuel type in 2019
(energy use as a percentage of total use)

Source: Eurostat (energy balances).
Notes: Dependency refers to the ratio of net imports to gross available energy. Intra-euro area trade is not included.
Significant increases in natural gas prices can dampen economic activity through both the consumption channel and the intermediate goods channel. In the case of the consumption channel, higher gas – and electricity – prices reduce households’ real disposable income and purchasing power (as a result of the deterioration in terms of trade due to the increased cost of imported energy), and thus private consumption. As for the intermediate goods channel, gas is an input in the production processes of many firms. Chart B reports the use of natural gas by industrial sectors (relative to economy-wide output) classified according to the Statistical classification of economic activities in the European Community (NACE2), distinguishing between transformation use (when one form of energy is transformed into another) and end use (when energy is consumed). Besides the energy sector itself, which mostly transforms natural gas into other forms of energy, other large-scale users of gas are producers of chemicals, basic metals, non-metallic minerals (glass, cement, ceramics, etc.) and food and beverages.
Chart B
Gas use by industrial sector in 2019
(terajoules per unit of industry output)

Sources: Eurostat (energy supply and use tables) and ECB staff calculations. The sectors are classified according to the Statistical classification of economic activities in the European Community (NACE Rev. 2).
Supply chain linkages amplify the reaction of goods producers and services providers to gas price increases. Amplification occurs because more than two-thirds of energy consumption is attributable to indirect use embedded in the earlier stages of production. Chart C shows the 25 most energy-intensive sectors in the euro area measured by share of input from the electricity, gas, steam and air conditioning industries, after disentangling direct sourcing of input from indirect use via other sectors’ inputs. Many industrial sectors have a sizeable direct use (especially mining and the metal and minerals sectors). Others mostly use electricity and gas indirectly, especially downstream industrial sectors such as those related to fabricated metals, food, textiles, electrical equipment, machinery and equipment, and motor vehicles) but also services sectors (transport-related, water supply, and accommodation and food). The overall input from the electricity, gas, steam and air conditioning supply industries is particularly relevant for the basic metals, mining and quarrying, paper and printing, and chemical sectors.
Chart C
Direct and indirect gas and electricity use by sector
(percentage of total output in 2018)

Sources: OECD Trade in Value Added (TiVA) database 2021 and ECB staff calculations.
Note: The chart shows the 25 most energy-intensive sectors measured by the share of input from the electricity, gas, steam and air conditioning industries, classified according to the United Nations International Standard Industrial Classification for All Economic Activities (ISIC), Rev. 4.
Regarding supply disruptions, the direct and indirect impact of a hypothetical 10% gas rationing shock on the corporate sector is estimated to reduce euro area gross value added by about 0.7%. To assess the effect of supply rationing, we assume, for illustrative purposes, a 10% fall in the output of the electricity, gas, steam and air conditioning supply sector for production processes in all other sectors. As shown in Chart B, this sector is by far the largest direct consumer of gas and its activity largely consists of distributing natural gas and transforming it into electricity. The effects are computed by comparing the value added derived from an input-output structure with full coefficients and the value added derived from an hypothetical input-output structure where the final and intermediate supply to the euro area of the electricity, gas, steam and air conditioning supply sector are rationed by 10%. It should be noted that the scope of this exercise is limited in that it does not consider the impact of price changes, complementarity, substitution or second-round and general equilibrium effects. Chart D reports the estimated losses for euro area countries. The accounting exercise suggests that gross value added in the euro area could be 0.7% lower in this rationing scenario, with losses being particularly significant for countries where production relies more heavily on gas and where the production of the electricity, gas, steam and air conditioning supply industry itself represents a considerable share of value added.
Chart D
Impact of a 10% cut in the gas supply on gross value added according to input-output simulations
(percentage difference in value added)

Sources: OECD Trade in Value Added (TiVA) database 2021, Eurostat and ECB staff computations.
Note: Impacts on countries are estimated by comparing the output derived from an input-output structure with full coefficients and the output derived from an input-output structure where the output of the electricity, gas, steam and air conditioning supply sector for production purposes in the euro area is 10% less.
An alternative framework for assessing the macroeconomic impact of gas price increases is to use general equilibrium models with a rich energy representation. The rich energy block of the National Institute Global Econometric Model (NIGEM) permits an illustrative assessment of the impact of the ongoing surge in gas (and oil) prices on euro area activity. NIGEM distinguishes between four types of energy: oil, gas, coal and renewables. While there is no mechanism for direct quantity rationing, simulated impacts for activity are possible by imposing shocks to global energy prices using current profiles from spot and futures prices. NIGEM-based estimates suggest that a permanent one standard deviation increase in natural gas prices from the first quarter of 2021 would result in a deviation in euro area GDP of around 0.2% from baseline levels over the standard three-year projection horizon (in the absence of policy and exchange rate effects).
Illustrative counterfactual simulations based on the surge in oil and gas prices since the start of 2021 suggest a significant negative impact on euro area activity in 2022, peaking in the first quarter. At the data cut-off date for the December 2021 Eurosystem staff projections, euro area oil and gas spot prices and futures suggested that euro area natural gas prices would likely peak in the first quarter of 2022 at almost 600% above their first quarter 2021 levels, before declining significantly thereafter.[1] Conditioning on these paths[2], and under standard simulation assumptions excluding exchange rate and policy feedback, mechanical simulations using NIGEM suggest that the current surge in oil and gas prices could reduce euro area output by around 0.2%, compared with baseline levels of GDP (Chart E), by the end of 2022. While the proportional impact of increases in gas prices is typically substantially lower than the impact associated with rising oil prices, the extraordinary magnitude of the gas price increases seen in energy futures makes gas prices the main driver of the adverse impact on euro area GDP this time.
Chart E
Simulated impacts of ongoing energy price developments on euro area GDP
(percentage deviation from baseline levels)
Sources: Bloomberg, National Institute Global Econometric Model (NIGEM) and ECB staff calculations.
Note: The chart shows the simulated impact of deviations in energy prices from first quarter 2021 levels on euro area GDP, net of exchange rate and policy effects.
- While the increases in oil prices compared with their level in the first quarter of 2021 (which is broadly equivalent to the nominal averages seen over the course of 2017-19) are in line with historical patterns (as last seen in the run-up to and wake of the global financial crisis), the surge in recent gas prices is well outside earlier deviations. At the time of drafting, gas prices remained highly volatile, despite spot prices in January falling to around half of their December futures values.
- The profiles used in these simulations reflect the quarterly averages of the profiles shown in Chart A of Box 3 entitled “Developments in energy commodity prices and their implications for HICP energy price projections" in the December 2021 Eurosystem staff macroeconomic projections for the euro area, published on the ECB’s website on 16 December 2021.