
Scarring effects of the COVID-19 pandemic on the global economy – reviewing recent evidence
Published as part of the ECB Economic Bulletin, Issue 7/2021.
The recession caused by the coronavirus (COVID-19) pandemic weighed on potential output across advanced economies and emerging market economies, but whether it will have a temporary or lasting impact remains to be seen. Taking a production function approach perspective, the decline in potential output can be explained by (i) smaller contributions from production factors (employment and capital), and/or (ii) lower technological gains (i.e. the efficiency with which inputs are combined). Although strong policy responses, particularly in advanced economies, cushioned the overall economic impact of the COVID-19 pandemic, there is still a risk of long-term output scarring. This relates, for instance, to hysteresis effects, as many workers have been at least temporarily excluded from the labour market, potentially resulting in skills losses and/or a permanent exit. While job retention schemes during the pandemic preserved employment and shielded productive but fragile firms, they might have partly hindered labour reallocation and hampered productivity. This box reviews evidence on the scarring effects of the COVID-19 shock and compares recent data relevant for determining the evolution of potential output with developments in the aftermath of the Great Recession.
The falloff in global investment stemming from the COVID-19 shock was short-lived and led to a slower accumulation of physical capital stock, although this was less pronounced than during the Great Recession. The surge in uncertainty regarding the economic outlook coupled with lockdown measures led to a reduction in new investment. In the first two quarters of 2020, world (excluding euro area) gross fixed capital formation declined by around 10% compared with the last quarter of 2019. This led to a slowing of aggregate growth in capital stock by 0.5 percentage points, although this was largely recovered in subsequent quarters (Chart A). By comparison, the Great Recession saw a much greater cumulative decline in global capital accumulation, although it occurred at a slower pace.
Chart A
Cumulative change in capital input
(percentage points)
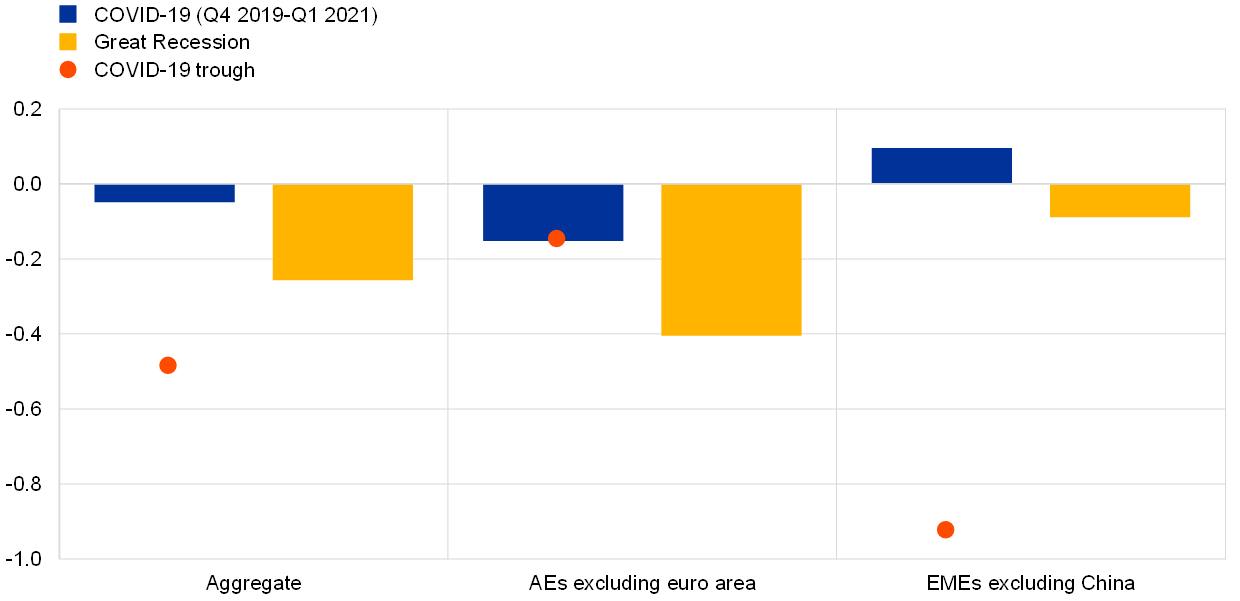
Sources: National sources and ECB calculations.
Notes: The blue bars refer to the change between the fourth quarter of 2019 and the first quarter of 2021, while the red diamonds depict the change between the fourth quarter of 2019 and the trough in the second quarter of 2020. The yellow bars refer to the change between the average for the period 2005-07 and the average for the period 2008-10. Advanced economies (AEs) include Canada, Japan, the United Kingdom and the United States. Emerging market economies (EMEs) include Brazil, India, Mexico, Russia, Turkey and South Korea.
By contrast, the contraction in hours worked during the pandemic was much stronger than during the Great Recession owing to both larger employment losses and reduced working hours per employee. Widespread lockdown measures prevented individuals from working as businesses closed or reduced operations, while school-related closures increased the need for childcare at home. In 2020 aggregate working hours declined by 8% compared with 2019, approximately 2.5 times more than during the Great Recession. This was due to a decline of equal proportion in employment and number of hours worked per employee.[1] The labour market deterioration was widespread across countries, but somewhat more pronounced in emerging market economies. By comparison, during the Great Recession, the reduction in total hours worked occurred mostly as a result of employment losses and was larger in advanced economies (Chart B). As the recovery takes hold, unemployed and marginally attached[2] workers are partly reabsorbed into employment, as indicated by the decline in the unemployment rate and the rise in the participation rate (Chart C).
Chart B
Changes in total hours worked
(percentage changes; percentage point contributions)

Sources: The Conference Board, World Bank and ECB calculations.
Notes: In order to isolate changes in hours worked from demographic trends, the measure used is the total number of hours worked over the year divided by the working age population. COVID-19 refers to the change between 2019 and 2020, while the Great Recession refers to the change between the average for the period 2005-07 and the average for the period 2008-10. Advanced economies (AEs) include Australia, Canada, Denmark, Japan, Norway, New Zealand, Sweden the United Kingdom and the United States. Emerging market economies (EMEs) include Brazil, China. India, Mexico, Russia, South Korea and Turkey.
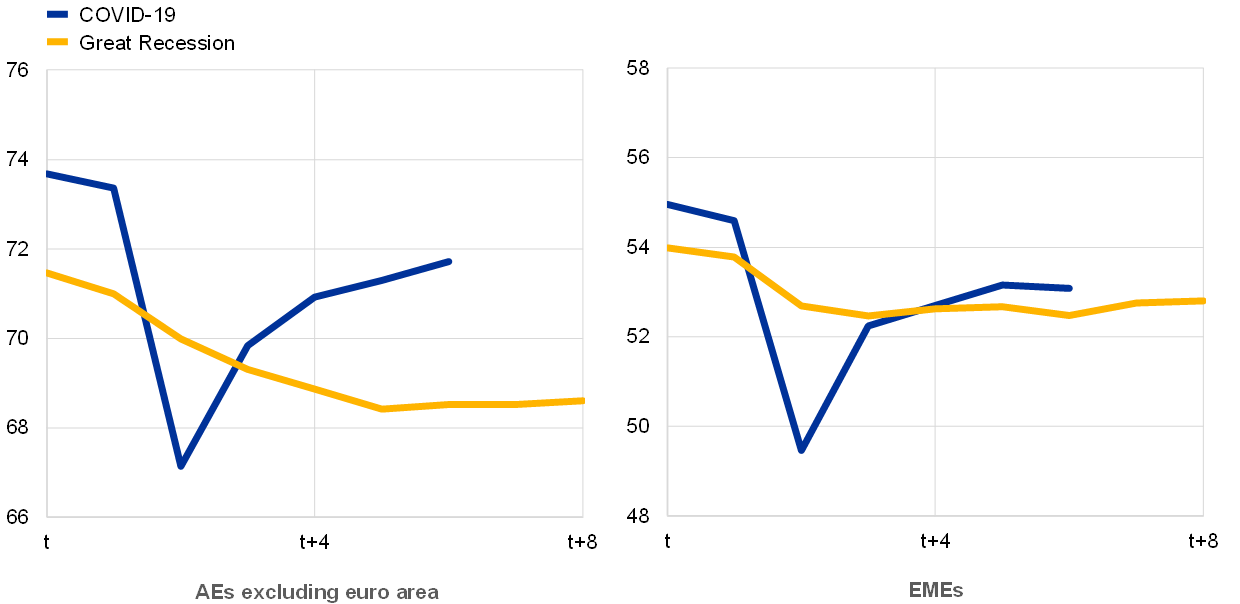
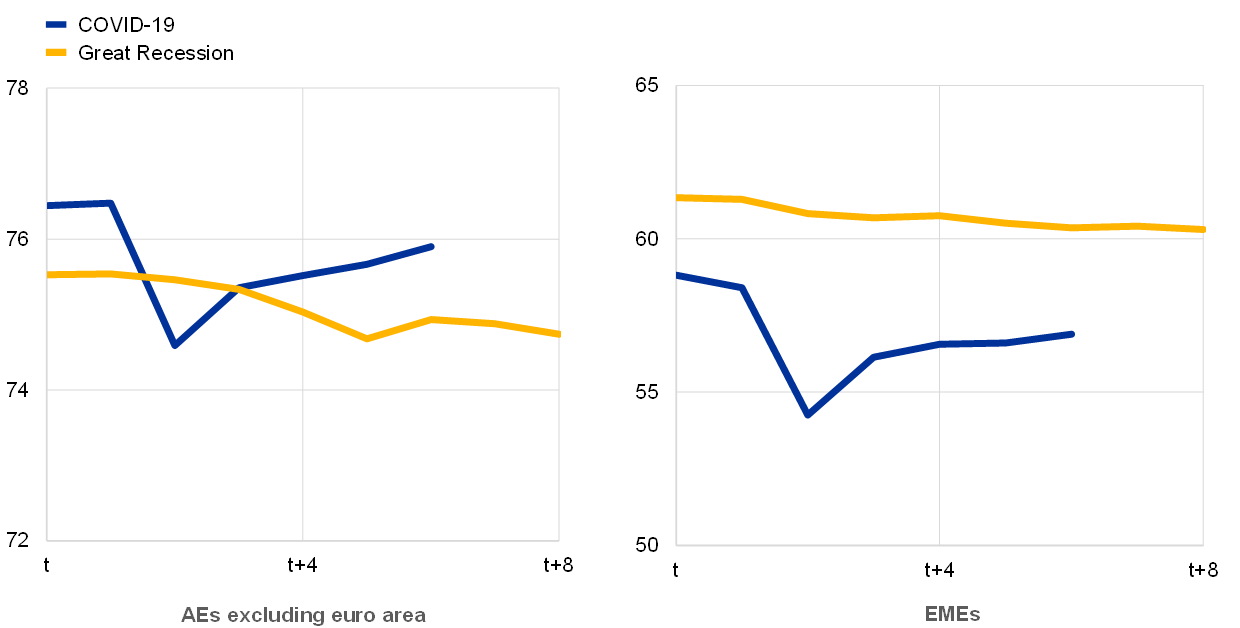
Chart C
Labour market developments
a) Employment rate
(percentages of working age population)
b) Actual and long-term unemployment rate
(percentages of labour force aged 15-64)

c) Labour force participation rate
(percentages of labour force aged 15-64)
Sources: National sources, Organisation for Economic Co-operation and Development and ECB calculations.
Notes: t=Q4 2019 for COVID-19 and Q3 2008 for the Great Recession. The advanced economies (AEs) aggregate is calculated as the weighted average across Australia, Canada, Denmark, Switzerland, Japan, New Zealand, Norway, Sweden, the United Kingdom and the United States (Australia, Canada, Switzerland, the United Kingdom and the United States for long-term unemployment). The emerging market economies (EMEs) aggregate includes Brazil, India, Mexico, Turkey, Russia and South Korea. Long-term unemployment is defined as being unemployed for 12 months or more (over 27 weeks for the United States). For Brazil and India, data refer to the labour force participation rate for all ages. The latest observations refer to the second quarter of 2021.
The weakness in the labour market translates partly into lower potential employment. People who entered early retirement schemes or left the labour market to meet childcare needs (i.e. who are interested in working, but not searching for work) are considered to lower the potential labour force participation rate and thus potential employment. This effect is likely to be temporary, at least in part, and to last until schools re-open fully, which will release parents from childminding, allowing them to re-integrate into the labour market.[3] Because mothers, in particular of younger children, were more prone to take over childcare responsibilities, the impact on potential employment is likely to be driven by a decline in labour force participation by women. Where available, data suggest that the decline in labour force participation of mothers contributed by around 20% to the decline of total prime-age labour force participation.[4] At the same time, recessions can incentivise people to prolong their education or return to education for some years as a preferred alternative to being underemployed or unemployed. This would add downward pressure on labour force participation in the short term but raise productivity in the longer term.
Lasting damage to the labour market may arise from hysteresis effects if people remain out of work for longer, loose their skills or become discouraged. This phenomenon is likely to be concentrated in the hardest hit industries (for example, contact-intensive industries). However, strategic investment directed towards sectors that exhibited stronger bottlenecks coupled with the fact that some sectors are likely to expand as a result of new opportunities for business created by the recession (for example, chemicals, pharmaceuticals and logistics) could mitigate such adverse effects. Long-term unemployment in advanced economies increased by around 1.5 percentage points, which is less than during the Great Recession (Chart C, panel b). To the extent that the increase in long-term unemployment translates into a higher rate of structural unemployment[5] and participation rates do not fully recover, lower labour input is likely to remain a long-term drag on potential output going forward.
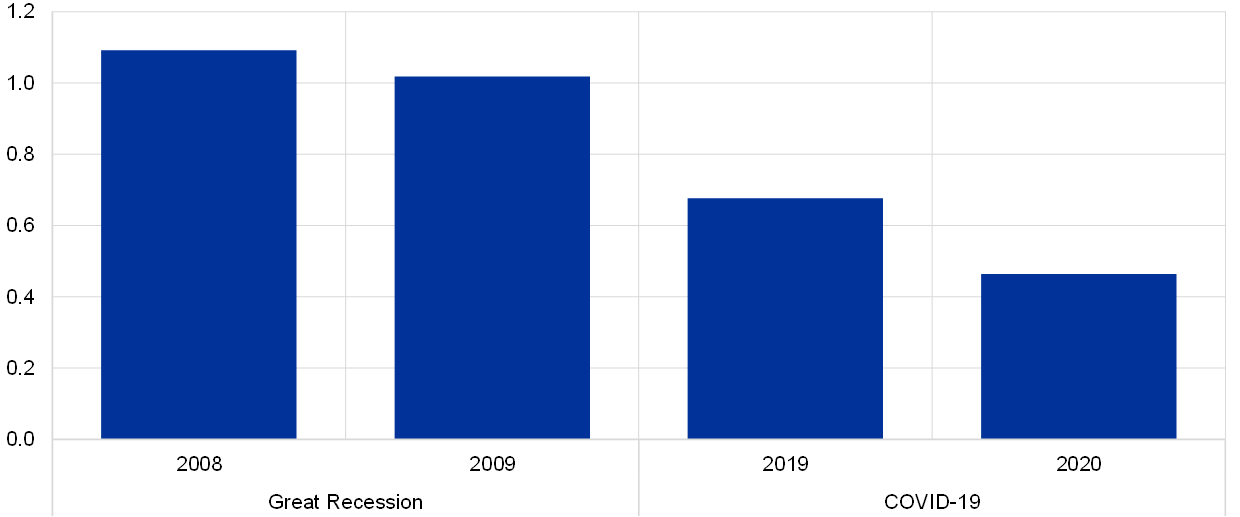
Total factor productivity (TFP) has also been suppressed by the COVID-19 shock, although its “residual” nature and inherited cyclicality requires cautious interpretation. In 2020 aggregate trend TFP growth fell by 0.2 percentage points compared with 2019, a decline similar to that seen during the Great Recession (Chart D).[6] Despite the significant uncertainty related to quantification of this unobserved variable, the balance of economic arguments suggests that the pandemic impaired the global efficiency of combining factors of production. Lower productive efficiency could be related to a less dynamic entry of new firms, amid heightened uncertainty about the economic environment and limited exit of inefficient firms in view of generous policy support. Moreover, supply chain disruptions increasingly lead to a less efficient reallocation of resources. Adjustments to the new remote working systems are also costly. On the positive side, progress with automation and digitalisation could improve efficiency, but such effects are likely to take longer to materialise fully.
Chart D
Trend total factor productivity growth
(percentages)
Sources: National sources and ECB calculations.
Notes: The global trend for TFP growth is computed by aggregating the trend TFP growth rates across nine economies (Brazil, China, India, Japan, Mexico, Russia, South Korea, Turkey and the United States) using GDP PPP weights. The country-specific trend TFP growth rates are obtained using a standard Cobb-Douglas Production Function Approach.
Overall, the level of global potential output has declined during the pandemic, albeit less than during the Great Recession and mostly on account of temporary factors. While investment was impaired, the drop was rather short-lived. Furthermore, the weakness in labour markets temporarily lowered potential employment and there are indications that TFP growth declined. Looking ahead, the prospects for global potential output depend on the adjustment to the post-pandemic economic landscape and, importantly, on the phasing-out of policy support measures. Far-reaching monetary and fiscal policy stimulus helped avert a wave of bankruptcies and mass unemployment. Accordingly, a premature withdrawal of policy support could be costly and hamper the economy’s potential output (for example via inefficient bankruptcies[7] and capital retirement).Employing the right mix of labour market policies will be key to promoting an equitable and sustained recovery from the COVID‑19 crisis and will help workers avoid becoming permanently detached from the labour market.
- In order to isolate changes in hours worked from demographic trends, the preferred measure is the total number of hours worked over the year divided by the working age population. For emerging market economies, this figure was already on a downward path prior to the Great Recession, implying a larger reduction in working hours during the reference period shown in the chart for the Great Recession compared with the decline that occurred between 2009 and 2008 only.
- The US Bureau of Labor Statistics defines marginally attached workers as “persons who are not in the labor force, want and are available for work, and had looked for a job sometime in the prior 12 months. They are not counted as unemployed because they had not searched for work in the prior 4 weeks, for any reason whatsoever. The marginally attached are a group that includes discouraged workers.”
- See, for example, Furman, J., Kearney, M.S. and Powell III, W., “The role of childcare challenges in the US jobs market recovery during the COVID-19 pandemic”, NBER Working Paper, No 28934, June 2021; Bauer, L., “Mothers are being left behind in the economic recovery from COVID-19”, Up Front, Brookings Institution, 6 May 2021; International Labour Organisation, “Fallout of COVID-19: Working moms are being squeezed out of the labour force”, 27 November 2020.
- Despite a generally lower level of participation rates. See, for example, the ILO-UN Women study, which found that, based on data for 84 countries, the labour force participation rate of prime-age men is 95%, while prime-age women have a labour force participation rate of 52%.
- As measured by the non-accelerating inflation rate of unemployment (NAIRU).
- See Box 4 of this issue of the Economic Bulletin for a description of euro area developments in labour productivity during the COVID-19 pandemic.
- See, for example, Financial Stability Board, “COVID-19 support measures: Extending, amending and ending”, 2021.