
The implications of savings accumulated during the pandemic for the global economic outlook
Published as part of the ECB Economic Bulletin, Issue 5/2021.
The coronavirus (COVID-19) pandemic has led to the accumulation of a large stock of household savings across advanced economies, significantly above what has historically been observed. Owing to their large size, the savings accumulated since early 2020 have the potential to shape the post-pandemic recovery. The central question is whether households will spend heavily once pandemic-related restrictions are lifted and consumer confidence returns, or whether other motives (e.g. precautionary, deleveraging) will keep households from spending their accumulated excess savings. In this box we consider a set of non-euro area economies and conclude that, on the balance of economic arguments, any reduction in the stock of excess savings as a result of higher consumption is likely to be limited in the medium term. However, given the considerable uncertainty surrounding this central scenario, this box also looks at two alternative savings scenarios and assesses their implications for the global economic outlook using the Oxford Global Economic Model.
The accumulation of large savings stems from the distinctive features of the COVID-19 pandemic and the policy responses. In contrast to previous economic recessions, the containment measures adopted in response to COVID-19 saw a significant suppression of consumer spending opportunities, leading to a sizeable contraction in private consumption. This was partially offset by the extraordinary policy measures deployed by governments in the form of either income or employment support, which cushioned the negative impact on personal disposable income (Chart A, panel a). These two factors, together with the high uncertainty regarding future income and the risks of permanent scarring effects, led households to save at unprecedented rates during 2020, resulting in the accumulation of a large stock of excess savings.
In 2020, the stock of household savings accumulated across five large advanced economies[1] in excess of historical values amounted to an average of 6.7 % of GDP and 9.5% of disposable income (Chart A, panel b). Of these countries, the United States held the largest stock at the end of 2020 (USD 1.5 trillion, or 7.2% of US GDP), but other countries also held sizeable amounts of excess savings. The stock of excess savings accumulated between early 2020 and the end of the year is estimated by calculating the cumulative difference between real savings and a counterfactual scenario where the saving ratio is assumed to have remained equal to the pre-pandemic average throughout the year. Similarly, our central scenario assumes that, up to the end of 2023, the stock of excess savings remains close to the level observed prior to the start of 2021, while the saving ratio is assumed to converge back to the pre-pandemic average.
Chart A
Private final consumption expenditure and excess household savings
a) Private final consumption expenditure breakdown
(annual percentage change, percentage points)
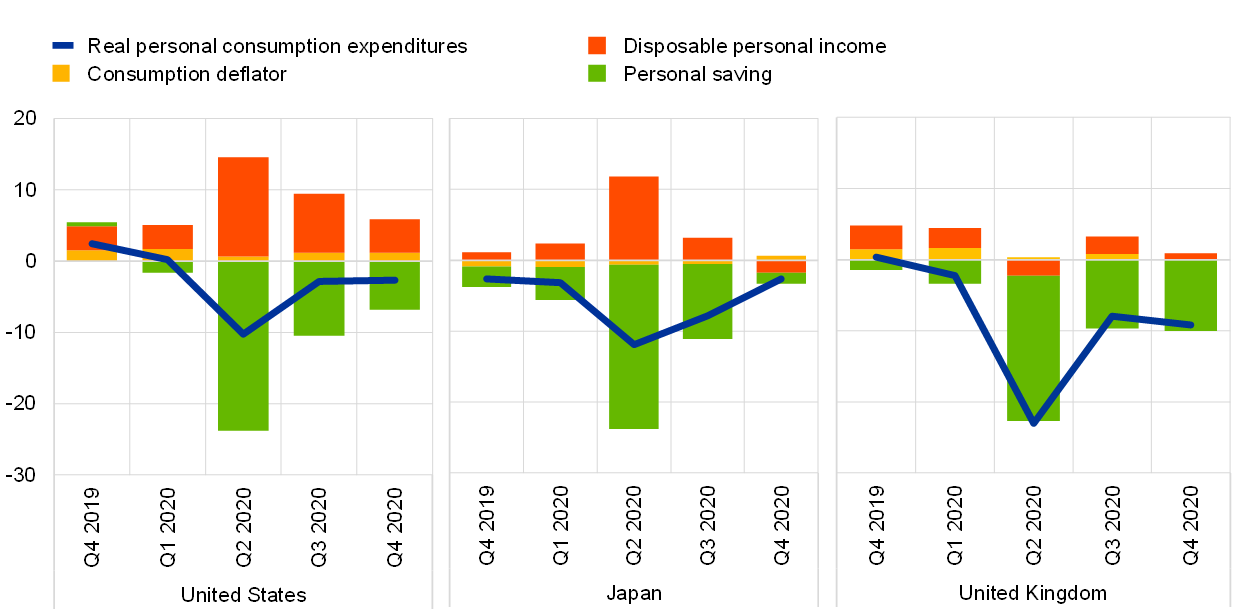
b) Excess household savings in the fourth quarter of 2020
(percentages)

Sources: National sources and ECB calculations.
Notes: The advanced economies (AE) aggregate is calculated as the weighted average of excess savings across the five countries shown in the chart. “US” refers to the United States, “UK” to the United Kingdom, “JP” to Japan, “CA” to Canada and “AU” to Australia.
Several arguments support the central scenario that households will prefer to hold most of their accumulated excess savings rather than using them to purchase consumption goods. We review these arguments briefly below, before illustrating the macroeconomic implications of two alternative savings scenarios.
First, the savings accumulated during the pandemic have mostly accrued to high-income households, who have a lower marginal propensity to spend out of income or wealth compared with low-income households.[2] In the United Kingdom, for instance, survey-based data show that high-income households increased their savings during the pandemic, while lower and middle-income households saved less or even dissaved. Similarly, in the United States there is evidence that the distribution of excess savings across income groups is heavily skewed in favour of high-income households and that these savings are held mostly in liquid form, i.e. currency and deposits (Chart B, both panels). A similar situation holds in the euro area, where the accumulation of savings during the pandemic has been concentrated among older and higher-income households (for details, see Box 4 in this issue of the Economic Bulletin). In Japan, available data likewise suggest that savings have accumulated mainly among middle and high-income households. In general, high-income households are likely to have saved more during the pandemic, as they experienced lower income losses than low-income households and tend to allocate a higher share of their consumption basket to the services that were most constrained during the lockdowns. For example, available data indicate that, before the pandemic, UK households in the top income decile devoted close to 40% of their expenditures to services such as transportation, recreation, hotels and restaurants.[3]
Chart B
Financial assets and liabilities of households
a) US checkable deposits and currency across income quintiles
(USD trillions; percentiles)

b) Financial assets and liabilities of households
(USD billions; GBP billions; JPY trillions)
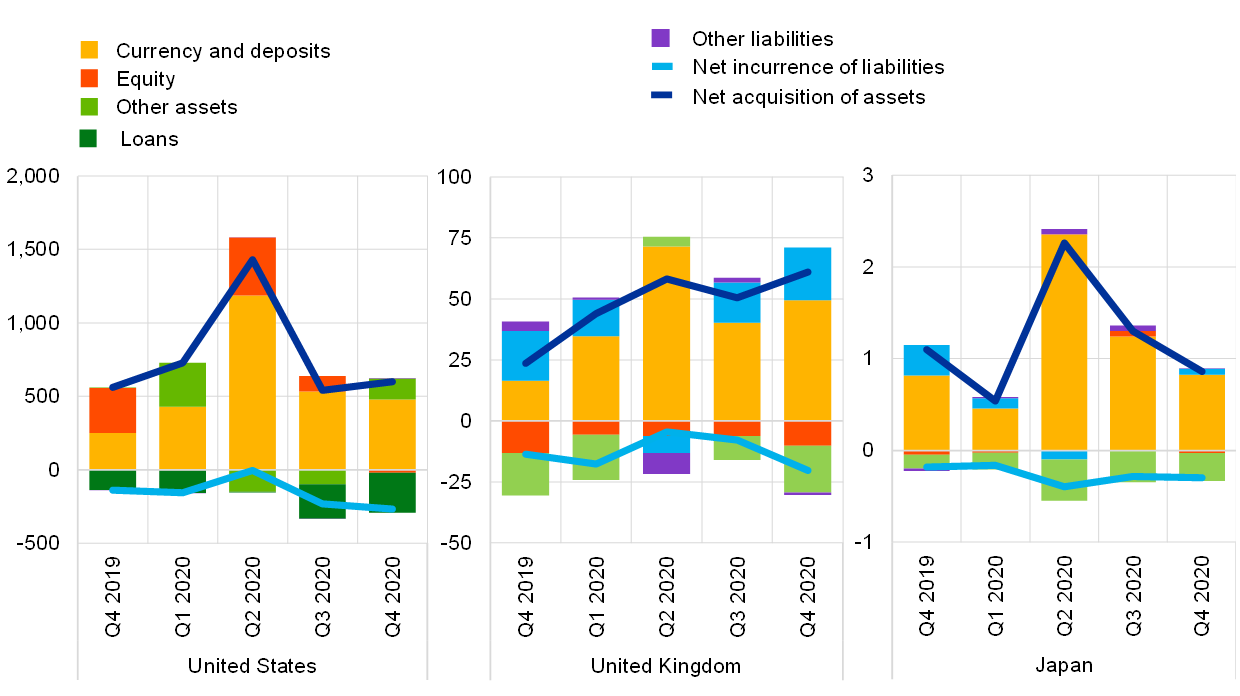
Sources: US Federal Reserve System (panel a); national sources and ECB calculations (panel b).
Second, households may use part of their accumulated savings to repay debt or to invest in assets. With regard to financial accounts, the accumulation of large savings has been associated with a surge in household bank deposits during the lockdowns. Prior to the end of 2020 only a small proportion of these savings had been used to repay debt or purchase assets such as equities (Chart B, panel b). This liquidity preference could partly reflect high uncertainty among households, in addition to reduced availability of consumption opportunities amid persisting COVID-19-related restrictions. As uncertainty recedes, a larger proportion of savings could be channelled towards investments or debt repayment. In the United States, the Federal Reserve Bank of New York’s Survey of Consumer Expectations suggested that most of the funds received by households in the form of stimulus cheques would go towards savings (41%) and debt payments (34%), while only about 25% would be used for consumption.[4] In the United Kingdom, the 2020 H2 NMG Survey suggested that only 10% of households whose savings rose planned to spend them, while 70% favoured continuing to hold their savings in bank accounts.[5] The remainder planned to use their savings to pay off debts, invest or top up their retirement plans.
Third, Ricardian equivalence effects may weigh on households’ propensity to consume, all else being equal.[6] The considerable income support provided to households and other policy measures taken during the pandemic led to a strong dissaving in the public sector and an associated increase in public debt. In the future, Ricardian equivalence effects may arise, to the extent that households expect tax rises aimed at reducing the public debt accrued during the COVID-19 shock and are thus less inclined to consume their accumulated excess savings. In this regard, it is worth noting that both the US Government and the UK Government have announced personal income tax increases, which are expected to weigh on households’ propensity to consume.
Fourth, the scope for sizable pent-up demand appears limited. While the easing of mobility restrictions and the progressive reopening of contact-intensive sectors will relieve household demand for consumption of related services (e.g. travel, restaurants and cultural activities), the latter are less prone than consumption goods to massive bouts of pent-up demand.[7] In particular, while consumers might have an incentive to switch to more expensive services (e.g. holidays and restaurants), there is a limit on the extent to which they can catch up in terms of missed consumption. In addition, as the pandemic-related containment measures severely limited consumption opportunities in the services sector, part of household spending switched towards consumption of goods. Data on real personal consumption expenditures of US households show that spending on durable and non-durable goods bounced back quickly after falling considerably in April 2020; by the end of the second quarter of 2020, overall spending had returned to the levels observed at the end of 2019 and has subsequently continued to grow. Expenditures on services, while recovering at a slower pace, stood at around 5% below pre-pandemic levels by March 2021.
Nonetheless, uncertainty around the relative strength of the factors that could influence how much of the accumulated savings is spent remains high. On the one hand, a gradual but lasting re-opening of economies, as the pandemic is brought under control, would lead households to de-accumulate savings at a faster pace than assumed in our central scenario, reflecting the fact that these savings were forced to a certain extent as the response to the pandemic curtailed consumption opportunities. Being held mostly in liquid assets, savings could be spent very easily. The resumption of contact-intensive activities such as shopping and dining will restore spending opportunities that were previously unavailable, in particular for high-income households that devote a larger share of their consumption basket to such activities. Moreover, as the recovery progresses and employment prospects improve, precautionary motives for saving, which played an important role in 2020, may also become less relevant as households regain confidence about their economic and health prospects (Chart C). On the other hand, setbacks in bringing the virus under control, prolonged restrictions, new lockdown measures and weaker labour market prospects could lead households to further accumulate savings, compared with the central scenario, and thus delay the recovery.
Chart C
Breakdown of household savings by motive
(percentages of disposable income and percentage points contribution)
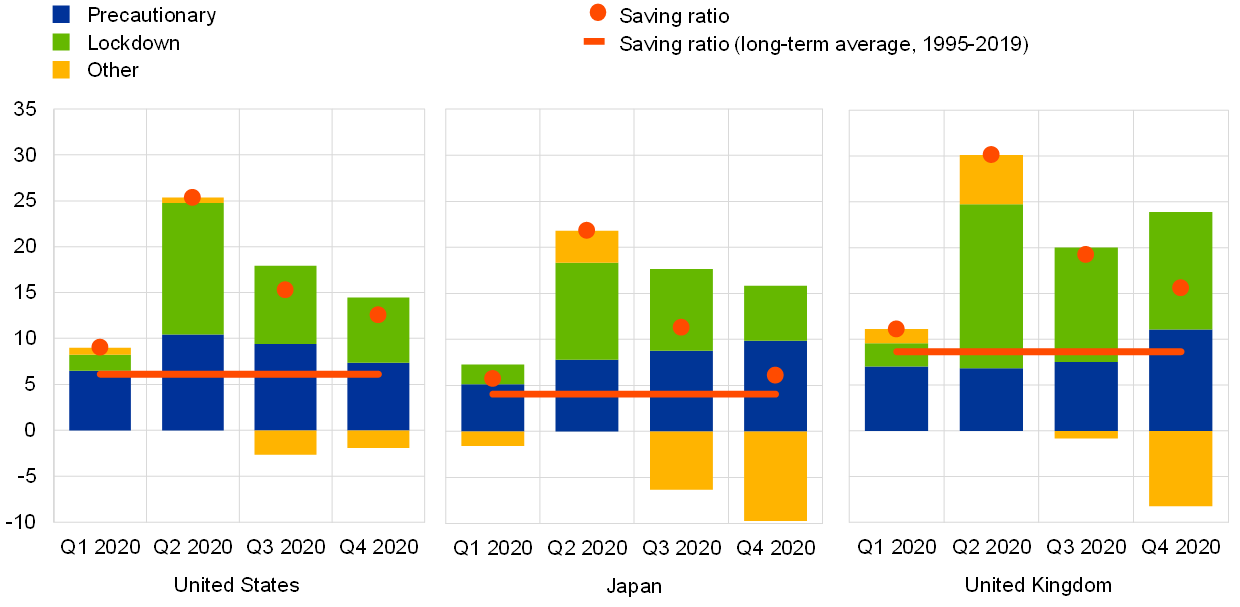
Sources: National sources and ECB calculations.
Notes: The analysis covers the period from the first quarter of 1995 to the fourth quarter of 2020. The ratio of household savings to disposable income in 2020 (red dots) is modelled in an ordinary least squares (OLS) framework and is expressed as a function of its own lag, the unemployment rate, economic confidence and country-specific lockdown measures, as captured by the Goldman Sachs Effective Lockdown Index.
Chart D
Scenario projections for the household saving ratio and stock of excess household savings
(percentages of disposable income (left panel); percentages of GDP (right panel))
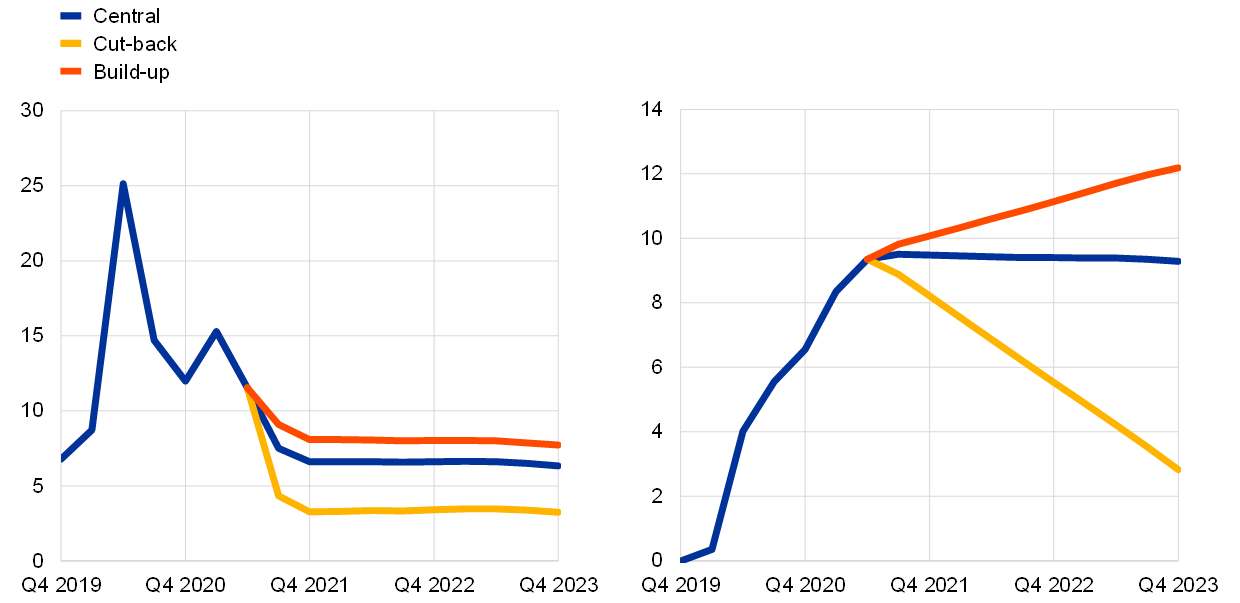
Sources: ECB calculations based on the Oxford Global Economic Model.
Note: Results are aggregated using weighted GDP.
To assess the macroeconomic implications of alternative savings scenarios for the United States, the United Kingdom and Japan, we consider two alternative scenarios[8] for the stock of excess savings. These are (i) a “cut-back” scenario, which assumes that the stock of excess savings accumulated by the second quarter of 2021 will decrease by 70% over the next two and a half years, and (ii) a “build-up” scenario, which assumes that the saving ratio will return to pre-pandemic levels only in the fourth quarter of 2023, implying that households will increase their current excess savings by a further 30%. As a result, average excess savings in these economies would decline to 2.7% of GDP in the cut-back scenario and increase to 12.6% of GDP in the build-up scenario by the end of 2023 (Chart D). We use the Oxford Global Economic Model to quantify the effects of the two scenarios on the global macroeconomic outlook.[9]
Chart E
Macroeconomic impact of alternative household savings scenarios on GDP and CPI in the “cut-back” and “build-up” scenarios
(percentage deviation from central scenario level)
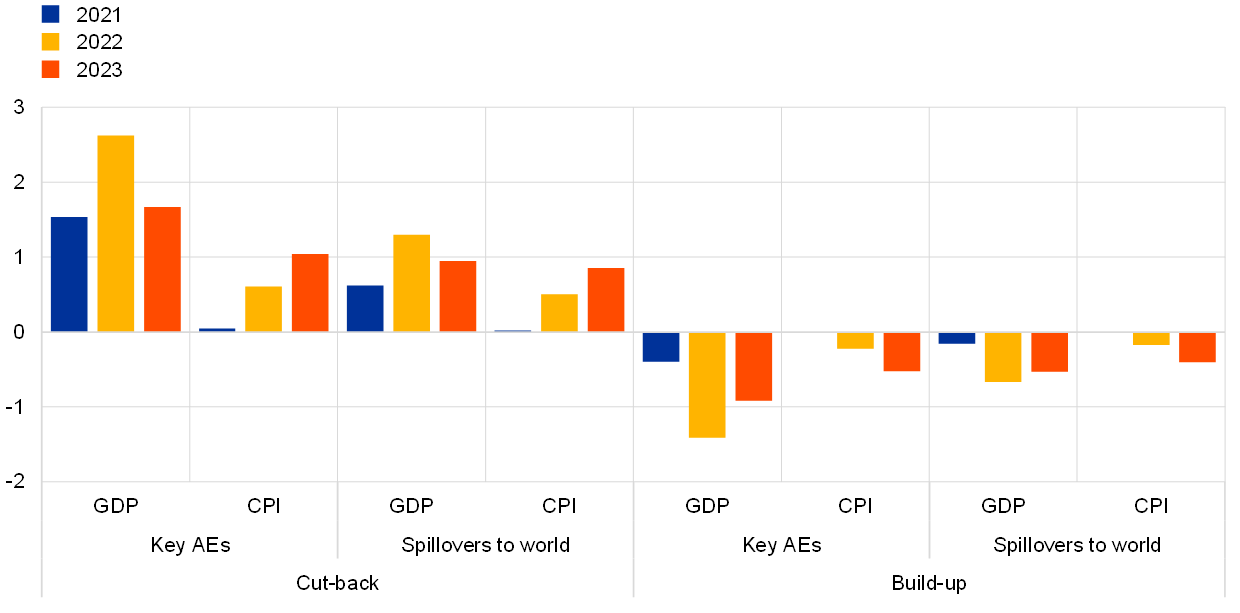
Sources: ECB calculations based on the Oxford Global Economic Model.
Notes: The impact on GDP and CPI in key advanced economies (AEs) is the GDP-weighted average impact across the United States, the United Kingdom and Japan; spillovers are assessed using the Oxford Global Economic Model, where “world” refers to the global economy, including the United States, the United Kingdom and Japan.
In the cut-back scenario, the faster reduction of savings in the form of higher private consumption supports aggregate demand and a pick-up of inflation. In key advanced economies, real GDP is projected to peak at 2.6% above the central scenario level in 2022 (Chart E). This positive boost would be partly counteracted in 2023 by stronger imports becoming a drag on GDP. The increase in aggregate demand would also support price pressures, which would gradually increase over the projection horizon and translate into higher inflation rates (1% above the central scenario level in 2023). The global impact would be significant, with world real GDP standing at 0.6% above the central scenario level in 2021, 1.3% above in 2022 and around 1% above in 2023. Global inflation would also increase, with consumer prices rising to around 0.9% above the central scenario level in 2023, supported by global demand conditions.
In the build-up scenario, households continue to accumulate savings, resulting in a more subdued pick-up in private consumption, a delayed recovery and limited disinflationary pressures. Continued high savings by households over a longer period would translate into lower aggregate demand and inflation. Domestic GDP would therefore recover more slowly than assumed in the central scenario and world GDP would stand at 0.2% below the central scenario level in 2021, 0.7% below in 2022 and around 0.5% below in 2023 (Chart E). The impact on global inflation would be limited. It is worth noting that despite the downside risks to global output, the build-up of household savings may yield longer-term gains in terms of stronger household balance sheets (e.g. lower leverage) to withstand future adverse shocks.
The analysis presented in this box illustrates the risks to global GDP in different household savings scenarios. The extent to which households across advanced economies will spend excess savings on consumption goods is crucial for the global outlook and is tied to several factors, not least the evolution of the pandemic (including progress in domestic vaccination campaigns), households’ employment prospects (especially for those with more modest income levels) and expected fiscal policy stances.
- The economies analysed are Australia, Canada, Japan, the United Kingdom and the United States.
- See, for example, Fisher, J. D., Johnson, D.S., Smeeding, T. M and Thompson, J. P., “Estimating the marginal propensity to consume using the distributions of income, consumption, and wealth”, Journal of Macroeconomics, Vol. 65, 2020.
- See Table 3.2 of “Family spending workbook 1: detailed expenditure and trends”, Office for National Statistics, 2021.
- Survey of Consumer Expectations, Federal Reserve Bank of New York, March 2021.
- See “How has Covid affected household savings?”, Bank of England, November 2020.
- The Ricardian equivalence proposition states that in response to a debt-financed increase in government spending, households do not increase their consumption despite having to pay less taxes. Hence, they will save more. This is because households anticipate that an increase in public debt will have to be financed by higher taxes in the future. The Ricardian equivalence proposition hinges on the assumptions that households can borrow and lend freely and that taxes are non-distortionary.
- See Beraja, M. and Wolf, C., “Demand Composition and the Strength of Recoveries”, working paper.
- For these scenarios we only focus on the United States, the United Kingdom and Japan.
- The simulations assume no monetary policy reactions in advanced economies and unchanged oil prices.