
Developments in the services sector and its relationship with manufacturing
Published as part of the ECB Economic Bulletin, Issue 7/2019.
This box looks at the euro area services sector and its relationship with manufacturing, focusing particularly on the extent to which the services sector could be affected by the recent slowdown in manufacturing. Economic growth in the euro area has been slower in recent quarters, mainly reflecting the impact on the euro area manufacturing sector of the ongoing weakness in international trade in an environment of prolonged global uncertainties. However, activity levels in the services sector have so far been relatively robust in the face of this downturn in manufacturing. This is likely to stem from the resilient developments in domestic demand, supported by the very accommodative monetary policy stance, which continues to support labour markets and create favourable financing conditions. The services sector is an important driver of overall economic activity in the euro area, constituting over 70% of total value added.
The services sector is very heterogeneous. Considering services as a whole, it is useful to distinguish between market and non-market services. The latter, comprising sectors such as education and health services, constitutes around one-third of total services. Its growth tends to be relatively stable and non-cyclical (see Chart A), as it was in the economic expansion starting in 2013 (following the sovereign debt crisis) and has been during the economic slowdown starting in 2018. Market services typically exhibit more cyclical growth patterns. This sub-group of services includes diverse sectors such as wholesale/retail trade and real estate services (constituting some 15% and 11% of total value added respectively), which are more oriented towards consumers, as well as finance and insurance activities (5% of value added) and other more business-oriented services. Unlike the manufacturing sector, these sectors have continued to expand at relatively strong rates in recent quarters.
Chart A
Growth of value added in services compared with manufacturing
(index: 2015 = 100)
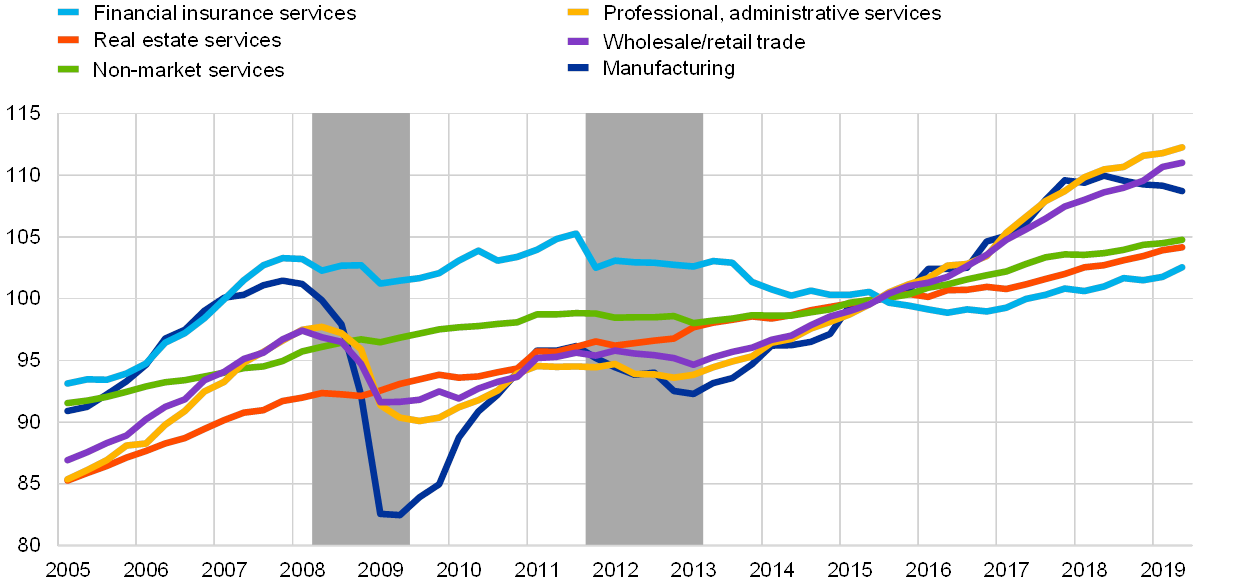
Sources: Eurostat and ECB calculations.
Note: The grey areas represent recession periods as identified by the CEPR Euro Area Business Cycle Dating Committee.
The risk of spillovers from manufacturing to services is particularly relevant in the area of business services. Developments in a number of sectors which together may be classified as business services are shown in Chart B. These sectors cover a part of transportation; a part of information technology and service activities; professional, scientific and technical services; and some administrative and support services. Together they comprise around 14% of total value added. Although these sectors generally shared the pattern of a downturn during the financial crisis in 2008-09, they remained fairly resilient in 2011-12. During the latest slowdown in manufacturing, they have mostly continued to increase at a robust pace. At the same time, growth rates have varied significantly across different sectors in recent years. Those which are more knowledge-intensive appear to have been growing very rapidly, but there is also some evidence that activity in other sectors flattened out at around the turn of the year.
Chart B
Turnover in business services compared with manufacturing
(index: 2015 = 100)
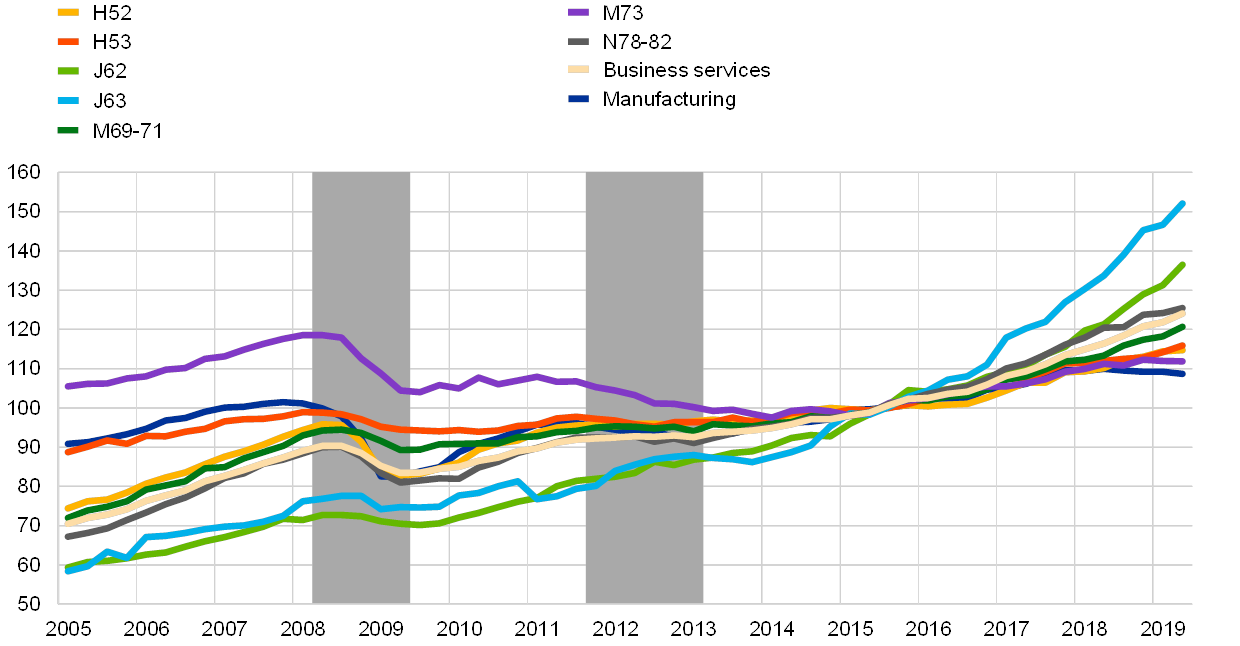
Sources: Eurostat and ECB calculations.
Note: Sector names refer to the NACE Rev. 2 classification system. H52: warehousing and transportation support; H53: postal and courier activities; J62: computer programming, consultancy and related activities; J63: information service activities; M69-71: legal and accounting, management consultancy, and architectural and engineering activities; M73: advertising and market research; N78-82: employment activities, travel agency, tour operator reservation service and related activities, security and investigation, cleaning activities and office administration.
Analysis of the correlation between the manufacturing sector and different parts of the services sector confirms different degrees of co-movement, particularly during cyclical downturns. The main co-movement between manufacturing and services is for parts of market services, including business services. Five-year rolling correlations of the annual growth rates of market, non-market and business services with manufacturing are shown in Chart C. The correlations vary over time, particularly the correlation between non-market services and manufacturing, which declines during the recession periods. It has been higher in the last few years, when there has been positive and stable growth in both sectors. In market and business services, on the other hand, the correlations are generally much higher and more stable over the whole sample period. Recently, though, they have fallen, possibly because domestic demand has been more resilient than in previous periods, a reflection of the very accommodative monetary policy stance, which continues to support labour markets and create favourable financing conditions.
Chart C
Five-year rolling window correlations of services sectors with manufacturing
(correlation coefficients)
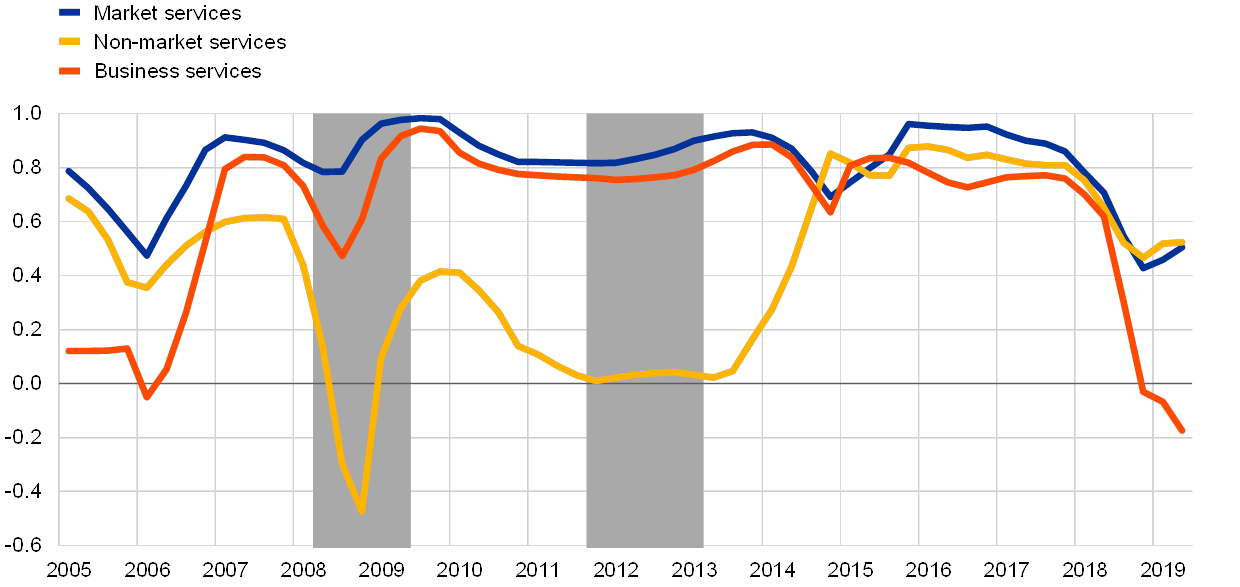
Source: ECB calculations.
Notes: Correlations are computed for year-on-year growth rates of the respective services sector with manufacturing value added growth. Business services is computed as a weighted average of the components.
So far, there has been little sign that weaker demand has affected business services, although recent survey data point to a slowdown in growth. Evidence from the European Commission’s business surveys, which also allow a focus on business services, suggests that the significance of insufficient demand as a factor limiting production in business services remains below its long-term average and has not changed much in recent quarters (Chart D). This contrasts with the picture for the manufacturing sector, where demand has weakened distinctly since end-2017. However, more timely survey results have recently declined, suggesting a slowdown in growth. Thus, developments in business services, as well as other important services sectors, need to be monitored closely in coming months for signs of spillovers from the manufacturing slowdown.
Chart D
Perceived significance of insufficient demand as a factor limiting production in manufacturing and business services
(percentage balances)
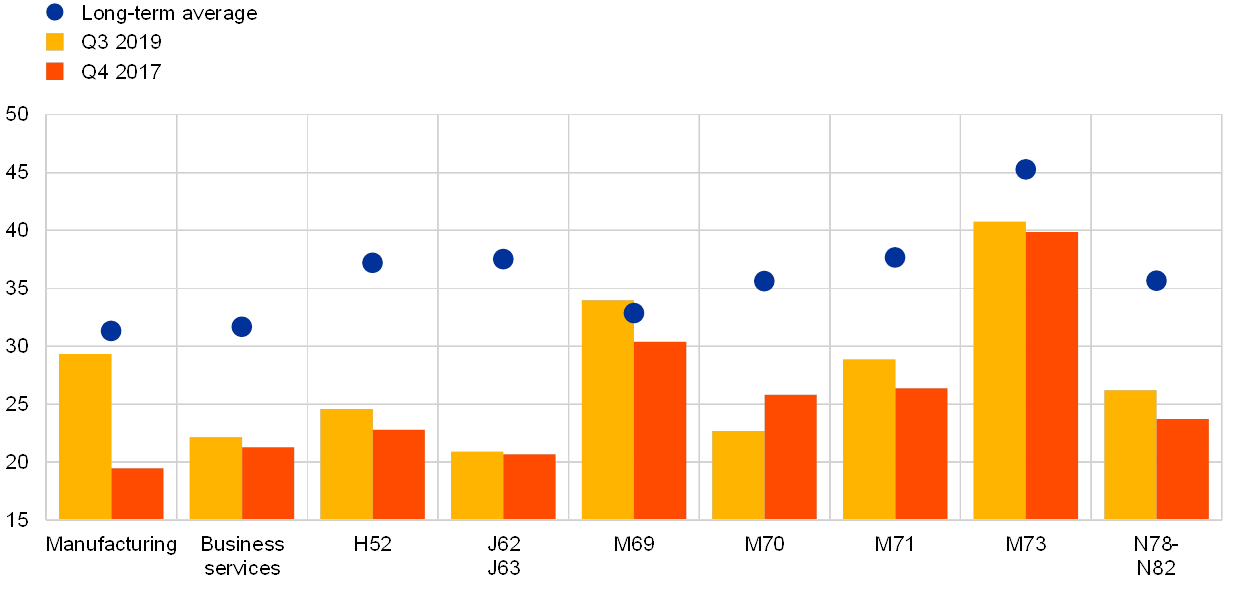
Source: European Commission.
Notes: For a description of the sub-groups of business services see the note to Chart B. The long-term average refers to the period 2003-19.