
Services trade liberalisation and global imbalances: a critical review of the empirical evidence
Published as part of the ECB Economic Bulletin, Issue 5/2019.
It is widely acknowledged that trade liberalisation raises aggregate welfare in the long run.[1] Trade liberalisation within the framework of multilateral cooperation has been a key factor driving global economic prosperity. Trade integration helped to drive economic growth in advanced and developing economies in the second part of the 20th century, thereby also helping to lift hundreds of millions of people out of poverty.
However, trade liberalisation has been asymmetric in that it has focused on goods rather than services. In this context, liberalisation of services trade may also be expected to raise welfare in the long run. Beyond its effects on welfare, it has recently been argued by some in international fora such as the G20 that services liberalisation may also reduce global imbalances – i.e. the dispersion of current account surpluses and deficits across economies. This box critically reviews the rationale and empirical evidence underpinning this claim.
Global imbalances have been stable overall in recent years, although their composition has changed somewhat (see Chart A). After a period of rising imbalances in the early 2000s, the global financial crisis triggered first a compression, then a rotation in global imbalances from emerging market economies (EMEs) towards advanced economies. Since then, the magnitude of global imbalances has remained broadly stable. Looking ahead, in its latest World Economic Outlook the IMF projects a gradual reduction in global imbalances, primarily driven by the fading surpluses of oil exporters, the euro area and Japan.[2]
Chart A
Evolution of current account surpluses and deficits across countries
(in % of world GDP)
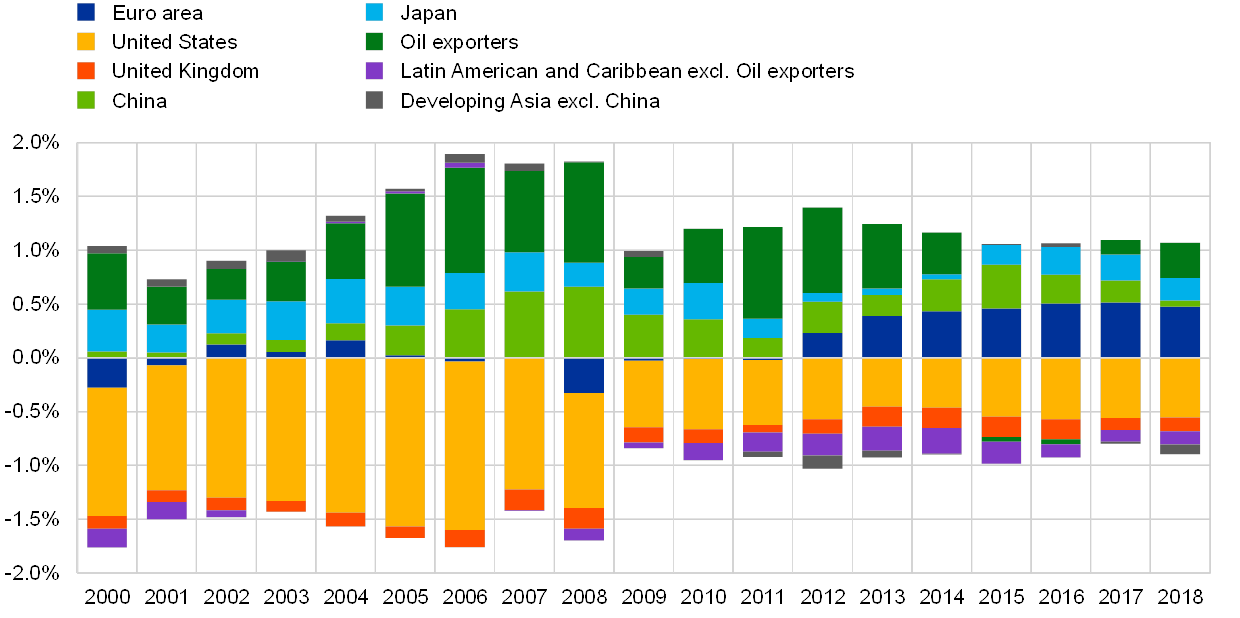
Sources: IMF World Economic Outlook and ECB staff calculations.
Notes: Oil exporters include Algeria, Angola, Ecuador, Indonesia, Iran, Iraq, Kuwait, Libya, Nigeria, Norway, Qatar, Russia, Saudi Arabia, UAE and Venezuela.
As large and persistent current account deficits have preceded several financial crises that spilled over to other economies, global imbalances warrant monitoring. Large and persistent current account deficits may raise economies’ dependence on global financial markets and accentuate their vulnerability to swings in investor sentiment. Indeed, large and persistent current account deficits have historically often preceded financial crises. Moreover, many of these crises spilled over to other debtor economies, and even affected creditor economies. Therefore reducing global imbalances is perceived to be an important way to foster global economic and financial stability.
It has recently been argued that asymmetric trade liberalisation since the 1990s – i.e. the reduction of tariffs for goods but not for services – has contributed to global imbalances. Specifically, the argument rests on two pillars. First, it is argued that since the inception of the World Trade Organization (WTO) in 1995 the cost of trading goods has decreased substantially due to sizeable cuts in tariff rates. In contrast, the cost of trading services has remained broadly unchanged over the same time period. Second, it is argued that as a result of such asymmetric trade liberalisation, economies with a comparative advantage in goods manufacturing (services) experience a rise (fall) in their current account balances (see Chart B).
Economic theory suggests that trade policy does not affect current account balances in the long run. The current account balance reflects a country’s net foreign lending, i.e. domestic savings minus domestic investment. So for any policy to affect the current account, it must affect intertemporal saving and spending decisions. A change in trade policy which raises a country’s permanent income will cause a commensurate increase in its spending in every period and thus have no effect on net saving in any given period. In terms of the trade balance, the positive shock to demand for domestic goods relative to foreign ones would shift their relative price, leaving net exports unchanged in relative terms.
However, particular features of the economic environment, such as consumption habits or investment adjustment costs, can delay the reversion to the long-run equilibrium. Against this background, it is possible in principle that the liberalisation of services trade could affect global imbalances temporarily, by raising the current account balances of economies with a comparative advantage in services rather than manufactured goods and reducing those of economies with a comparative advantage in manufacturing.
Chart B
Trade liberalisation and current account imbalances of selected countries
(in % of sample GDP)
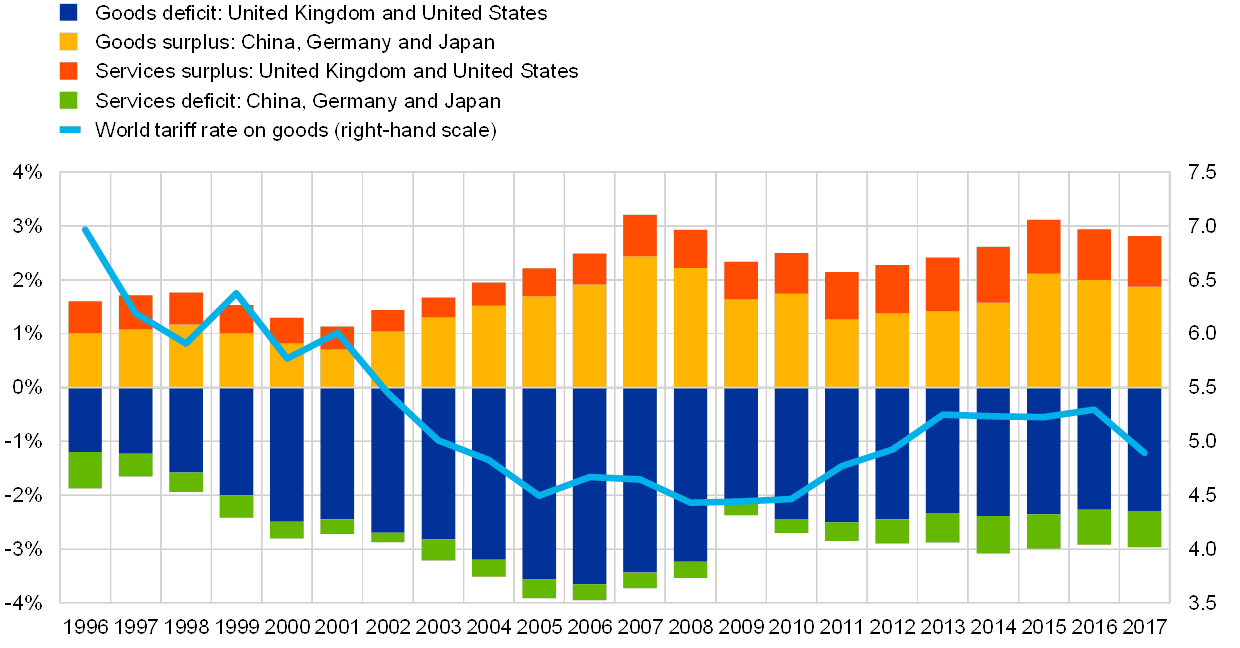
Sources: IMF Balance of Payments Statistics and World Development Indicators.
Notes: Sample GDP refers to the cumulative GDP of China, Germany, Japan, the United Kingdom and the United States. The world tariff rate is constructed as a GDP-weighted average of country-level tariff rates. Tariffs refer to applied tariffs covering all traded goods.
Testing the hypothesis that liberalising services trade would reduce global imbalances requires the use of an empirical model for the determination of the current account balance that controls for fundamentals and policies. Given that in such a model the variable to be explained would be the current account balance relative to GDP, the analysis would implicitly also account for the effects of trade policy on output.
The IMF’s External Balance Assessment (EBA) regression model is a widely established methodological framework for assessing the effects of fundamentals and policies on the current account.[3] The IMF’s EBA model is based on a panel regression that analyses the relationship between a country’s current account balance relative to GDP, on the one hand, and economic fundamentals as well as policies, on the other hand. This model is used among other things for the assessment of countries’ external positions in IMF Article IV Reports and the IMF External Sector Report. It should be mentioned that because the IMF’s EBA model is specified in a reduced form, the individual transmission channels that give rise to the general equilibrium cannot be traced back. At the same time, by virtue of its reduced form the EBA model can be used to analyse the effects of a wide range of fundamentals and policies that affect the current account.
The results found using this model suggest that liberalising services trade would reduce current account deficits in some debtor economies. As in Joy et al. (2018)[4] the IMF’s EBA regression model is augmented with an index for services trade restrictiveness constructed by the OECD.[5] Then, a counterfactual analysis of a reduction in barriers to services trade is considered, in which all countries are assumed to reduce their services trade restrictiveness to the level of the least restrictive country.[6] Changing the values of the right-hand side variables in the fitted EBA regression model then implies corresponding changes in the predicted current account balance relative to GDP. Given that the EBA model also controls for the business cycle, the counterfactual results are best interpreted as medium-term effects. The results – largely in line with those in Joy et al. (2018) – suggest that the current account deficits of debtor economies such as the United Kingdom and the United States would be reduced by 1.2 and 0.8 percentage points relative to GDP, respectively (see Chart C). Moreover, China’s current account surplus would turn into a moderate deficit, moving closer to balance in absolute terms.
Chart C
Current account effects of liberalising services trade at the country level
(in % of GDP)
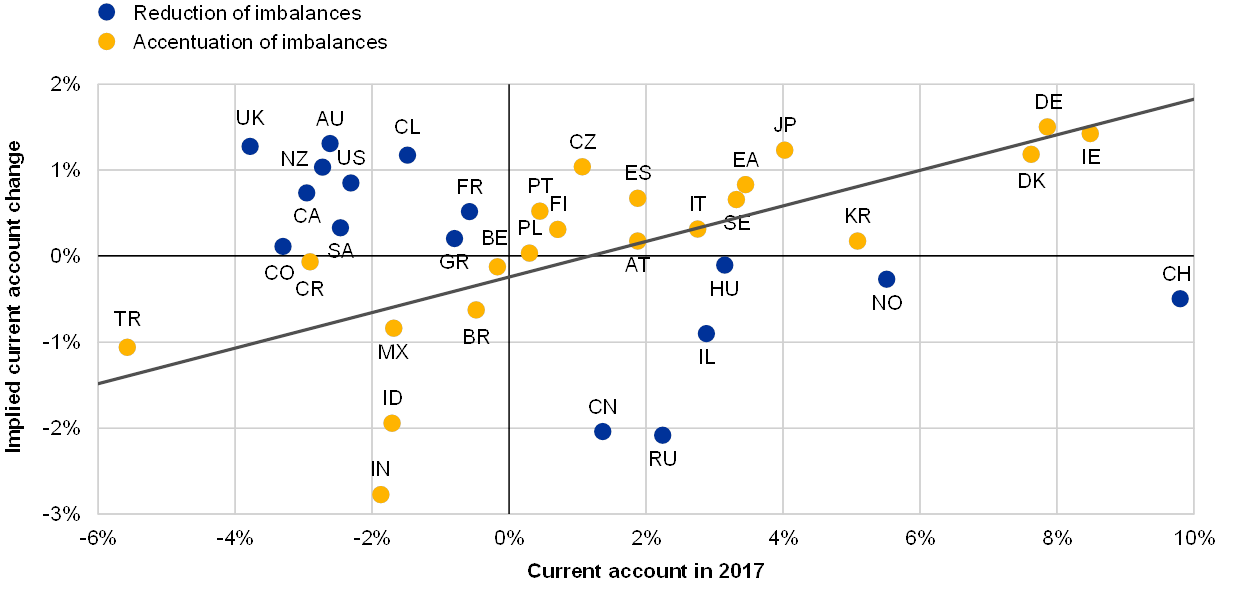
Sources: IMF World Economic Outlook and ECB staff calculations.
Notes: The implied current account change (y-axis) refers to the change in current accounts following a liberalisation of services trade, where services trade is liberalised to the level of the least restrictive country, in all countries. Current account in 2017 (x-axis) refers to the actual current account in 2017. The grey line indicates the regression line.
However, the counterfactual analysis also suggests that for a large number of countries a reduction of services trade restrictions would not reduce current account imbalances, but would actually increase them further (see Chart C).[7] In particular, the liberalisation of services trade in this counterfactual exercise would raise the current account balances of some countries which already exhibit surpluses, such as Germany and Japan, and exacerbate pre-existing deficits in many EMEs. The reason for this finding is that in general advanced economies have already liberalised services trade substantially, while EMEs tend to have more restrictions in place. Accordingly, advanced economies would gain access to relatively more new export markets than EMEs, thereby improving their services trade balances while worsening those of EMEs.
Overall, the counterfactual analysis suggests that while the concentration of countries’ current account imbalances would be reduced, the magnitude of global imbalances would remain largely unchanged overall (see Chart D). The Hirschman-Herfindahl index of concentration of countries’ current account imbalances – especially deficits – measured as a share of world GDP is reduced by 25%, while the magnitudes of cumulative surpluses and deficits are essentially unchanged.[8] For example, as mentioned above, the current account deficit of the United States, which accounts for a large share of global, cumulated current account deficits, would be reduced and – given that the overall magnitude of current account deficits is unchanged in the counterfactual – distributed across a larger number of countries.
Chart D
Global current account balances before and after services trade liberalisation
(in % of world GDP)
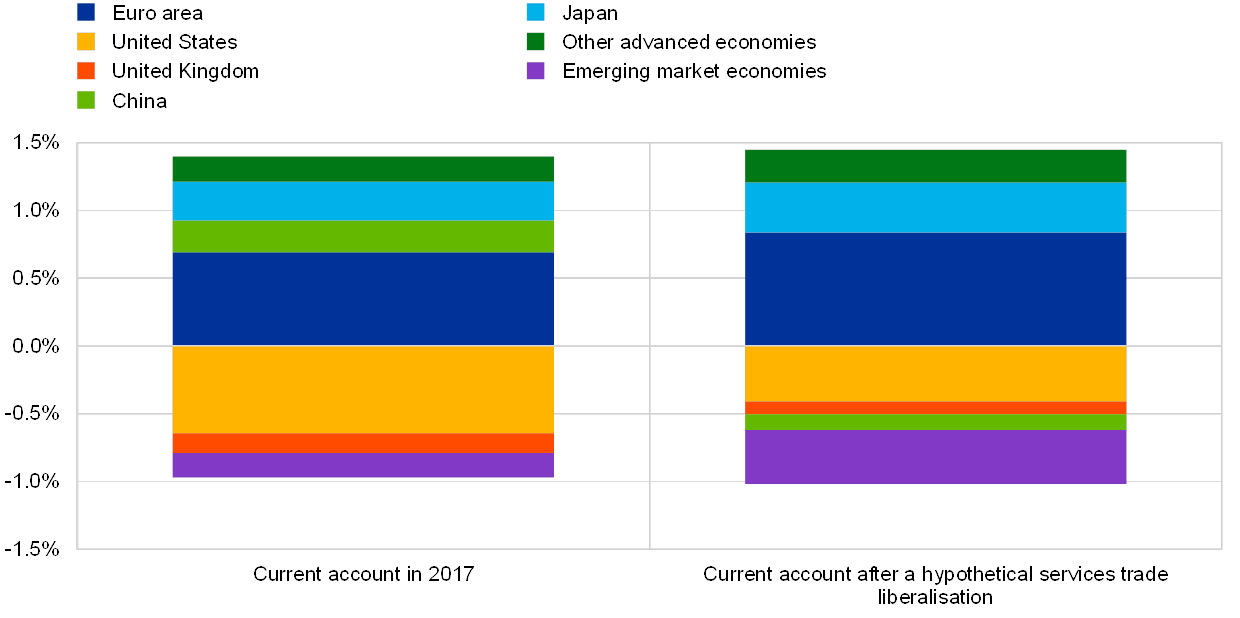
Sources: IMF World Economic Outlook and ECB staff calculations.
Notes: The implied current account change refers to a scenario in which services trade is liberalised to the level of the least restrictive country in the sample for all countries. World GDP refers to the aggregate GDP of the 37 countries included in the sample.
While the analysis of flow imbalances, as presented in this box, provides one perspective on the discussion regarding global imbalances, a comprehensive assessment of the effects of services trade liberalisation would also have to include an analysis of stock imbalances. For example, an economy’s current account moving from a balanced position to a surplus following services trade liberalisation may be stabilising, although it raises the current account imbalance when the economy exhibits large initial external debt stocks. This could be an important element in assessing the effects of services trade liberalisation, as despite the compression in flow imbalances stock imbalances have continued to widen since the global financial crisis. Another caveat is that with the rise of multinational firms it has become increasingly difficult to measure and interpret current account imbalances.[9]
Overall, the evidence available so far suggests that while services trade liberalisation may further foster global economic prosperity and alleviate imbalances in a few prominent economies, it should not be expected to significantly reduce flow imbalances from a global perspective, even temporarily. While services trade liberalisation could reduce current account imbalances temporarily for some countries, the evidence available also suggests that this would not result in a sizeable reduction in global imbalances.
- See for example Making trade an engine of growth for all, staff of the International Monetary Fund, World Bank and World Trade Organization, 2017.
- See World Economic Outlook: Growth Slowdown, Precarious Recovery, International Monetary Fund, 2019.
- For an in-depth discussion, see: “External Balance Assessment (EBA) Methodology: Technical Background”, IMF Working Paper, No 13/272, IMF, 2013.
- See Joy, M., Lisack, N., Lloyd, S., Reinhardt, D., Sajedi, R. and Whitaker, S., “Mind the (current account) gap”, Bank of England Financial Stability Paper, No 43, 2018.
- The OECD’s Services Trade Restrictiveness Index provides a snapshot of services trade barriers in 22 sectors across 44 countries.
- Due to data availability restrictions, the counterfactual is based on the 2017 values of the services trade restrictions indicators.
- These findings are in line with recent empirical evidence which highlights the feeble link between trade barriers and current accounts, see for example: Effective Trade Costs and the Current Account: An Empirical Analysis, IMF, 2019, or External Sector Report: Tackling Global Imbalances amid Rising Trade Tensions, IMF, 2018.
- The Hirschman-Herfindahl index is defined as the sum of squared shares. In the context above, it is defined as the sum of the squared current account imbalances relative to world GDP. If a few entities account for most of the total, then the index has a high value, reflecting stronger concentration.
- See for example External Sector Report, International Monetary Fund, 2019.