
Characterising the current expansion across non-euro area advanced economies: where do we go from here?
Published as part of the ECB Economic Bulletin, Issue 2/2019.
This box looks at the current phase of the business cycle in major non-euro area advanced economies with a view to assessing the factors behind the transition to weaker growth.[1] Although growth in non-euro area advanced economies has been slowing, signals of a severe slowdown or recession appear contained at the current juncture and our baseline scenario remains one of a modest economic deceleration.
From a historical perspective, the current expansion in non-euro area advanced economies has been relatively unusual in terms of both length and pace. Following the global financial crisis, the recovery in activity started in a context of very large output gaps. The global expansion has now entered its tenth year and is on track to become the longest on record. Seen in a historical perspective, it has also been comparatively shallow, with cumulated GDP growth of less than 20% since 2009, which is well below the levels seen in previous expansions (see Chart A). The sluggishness of the recovery might be consistent with the view that potential growth has fallen in the past decade.
Chart A
Amplitude, duration and slope of expansions in non-euro area advanced economies
(left-hand scale: percentages and quarters; right-hand scale: percentages)
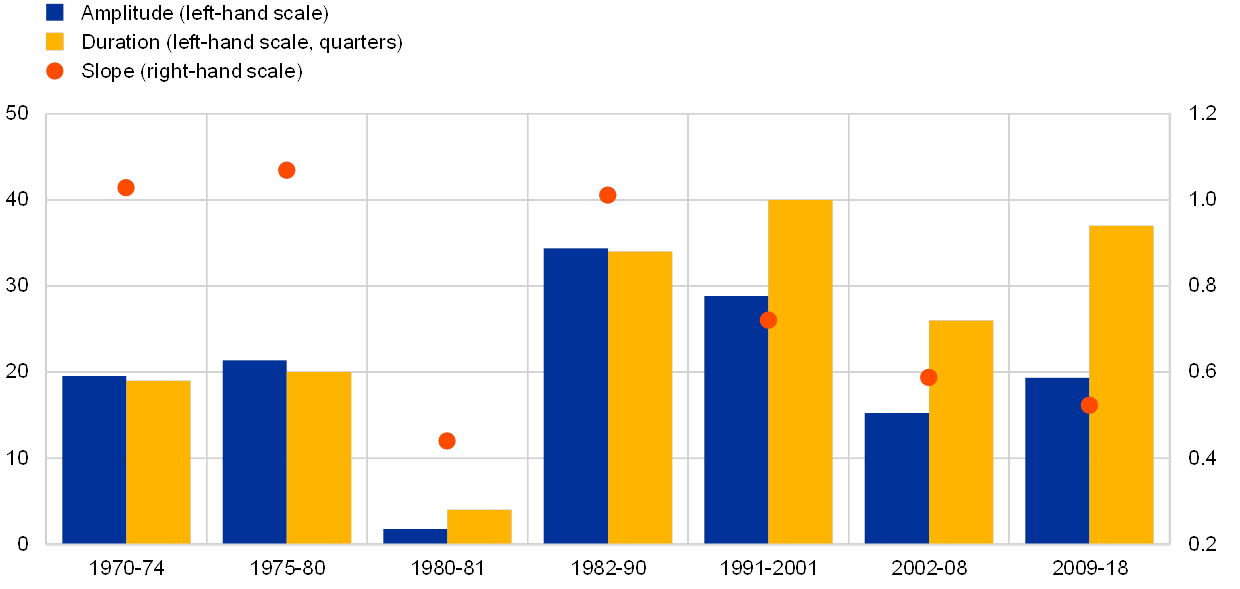
Source: ECB staff.
Notes: Advanced economies’ cycles are obtained as a weighted average of the countries in the sample. See the first footnote in this box for country coverage. “Amplitude” refers to the percentage change in real GDP from trough to the next peak in an expansion; “duration” is defined as the number of quarters from trough to the next peak in an expansion; and “slope” is the ratio of amplitude to duration.
A more in-depth analysis of the dynamics of the business cycle requires a more refined definition of its various phases. For the purpose of this box, we combine two approaches. First we detect recessions relying on the pure technical definition, i.e. a recession implies at least two quarters of decline in the level of real GDP, by adopting the Bry-Boschan algorithm.[2] This is referred to in the literature as the “classical” approach to business cycle dating.[3] Once the dates of recessions have been established, we use the cyclical component of GDP, obtained by de-trending real GDP levels using estimates of potential GDP growth, to distinguish different phases of cyclical expansions.[4] We separate movements in the GDP cycle into four additional phases according to whether actual GDP is expanding faster or slower than potential, and whether the output gap is in positive or negative territory, imposing again a minimum of two consecutive quarters in defining each phase.[5],[6] Chart B presents an example of the five phases based on the aggregate of non-euro area advanced economies.
The second step allows us to provide a more refined characterisation of the different phases of expansions. Specifically, it allows us to take into account the implications stemming from a declining pace of potential growth. By combining recessions as identified in step 1 (red-shaded area in Chart B) with the additional cyclical phases detected in step 2 (light green, dark green, yellow and orange shaded areas) we separate “hard landings”, i.e. outright recessions, from “soft landings”, i.e. periods in which economic activity decelerates relative to potential, with the output gaps falling into negative territory at times, but without entering a recession.[7]
Chart B
Non-euro area advanced economies business cycle
(left-hand scale: index (in logs); right-hand scale: percentages)
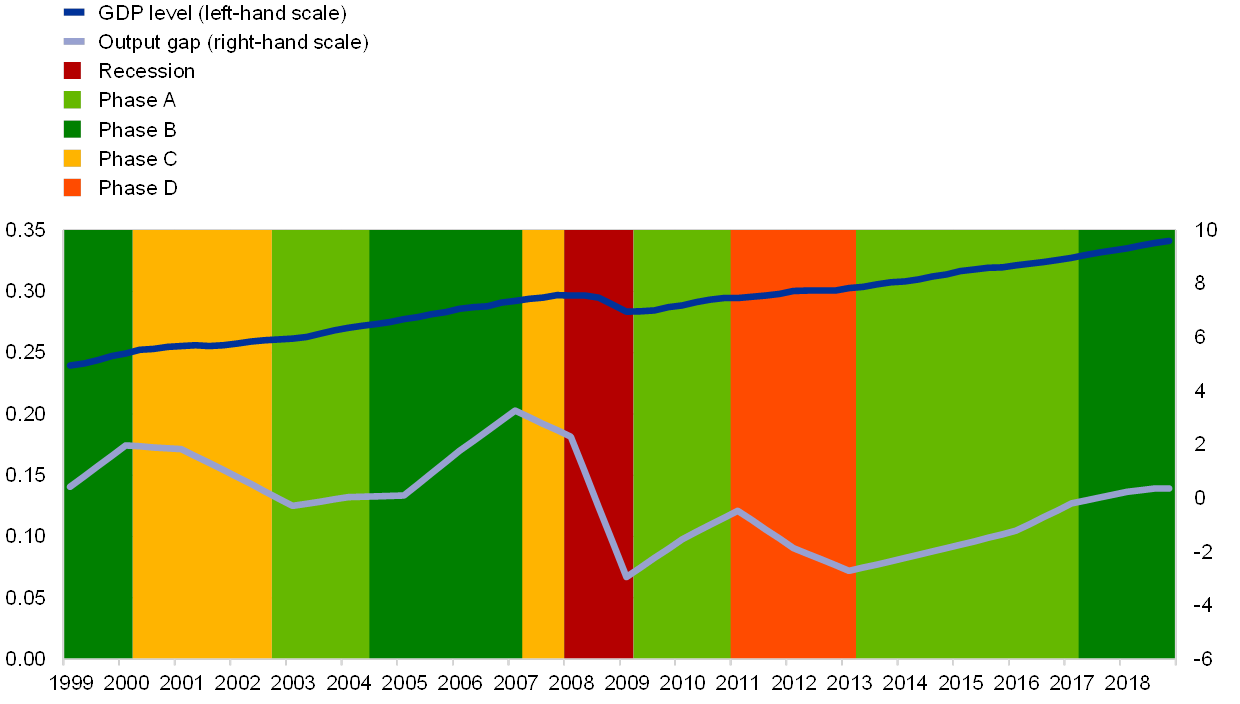
Source: ECB staff.
Notes: The chart shows a periodisation of five phases of the business cycle for advanced economies. In a first step we rely on the classical approach to business cycle dating in order to separate expansions from recessions, adopting the Bry-Boschan algorithm applied to real GDP levels (in logs). The second step separates movements in the cyclical component of real GDP into four phases. Phase A refers to periods in which the output gap is still negative but GDP is growing faster than potential. Phase B indicates the case in which the output gap is positive with GDP growing faster than potential. In phase C, a positive output gap is associated with GDP expanding slower than potential. Lastly, phase D characterises periods in which the output gap is negative and GDP is expanding slower than potential. The latest observation is for the fourth quarter of 2018.
This methodology suggests that in several key advanced economies the output gap is currently in positive territory, with activity still expanding faster than potential (see Chart C). Our estimates suggest that in the United States, Japan, Canada, Switzerland and Denmark output gaps are positive with activity still expanding at a faster pace than potential. Sweden, however, might have already transitioned into a phase in which activity is increasing at a pace below potential. By contrast, the recovery in the United Kingdom, Norway and Australia appears to have endured since the Great Recession, but some spare capacities still prevail in these economies.
Chart C
A periodisation of business cycles for selected advanced economies
(phases)
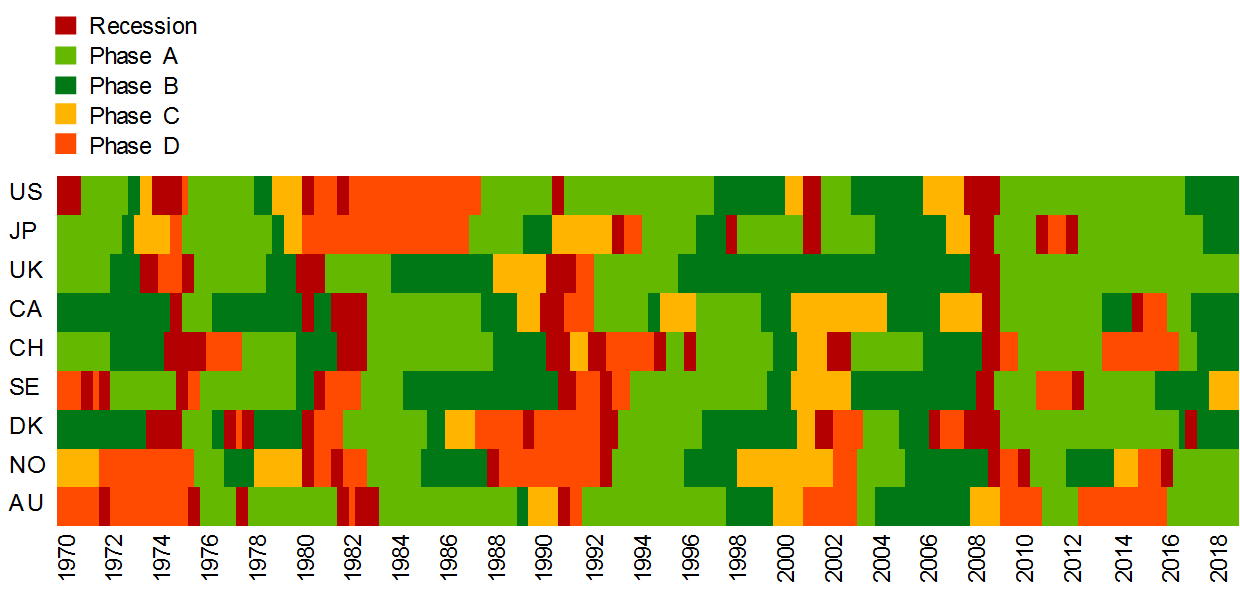
Source: ECB staff calculations.
Notes: Recessions are detected using the Bry-Boschan algorithm applied to real GDP levels (in logs). Phase A refers to periods in which the output gap is still negative but GDP is growing faster than potential. Phase B indicates the case in which the output gap is positive with GDP growing faster than potential. In phase C, a positive output gap is associated with GDP expanding slower than potential. Lastly, phase D characterises periods in which the output gap is negative and GDP is expanding slower than potential. The latest observation is for the fourth quarter of 2018.
Past experience suggests that economies can operate above potential for quite some time, with economies more likely to experience a soft landing rather than outright recessions. Chart C indicates that in economies with positive output gaps GDP can grow above potential for about two to three years on average before the cycle turns. Moreover, in most cases, economies gradually slow down and experience a soft landing. Historical (unconditional) probabilities of transitioning between different phases of the business cycle suggest that, following a period in which the output gap is positive and growth is expanding at a pace above potential (phase B), about one-third of countries experience a recession, while two-thirds transition to a phase of more modest growth as activity decelerates below potential growth.
Our baseline scenario remains one of a modest economic deceleration in advanced economies. After peaking in 2017, GDP growth in advanced economies started to slow in the first half of 2018, and survey-based indicators point to a further moderation at the turn of the year. The slowdown in manufacturing activity appears to be particularly pronounced, probably accentuated by growing uncertainties weighing on global investment and activity. The latest update of the IMF World Economic Outlook suggests that overall growth in the advanced economies will gradually decline from 2.3% in 2018 to 2.0% in 2019 and further to 1.7% in 2020, which is broadly in line with the March 2019 ECB staff macroeconomic projections.[8]
Overall, although growth in non-euro area advanced economies has been slowing, signals of a severe slowdown or recession appear contained. This notwithstanding, downside risks abound and have increased lately. An exacerbation of trade tensions, for example, or a “no deal” Brexit scenario would negatively affect prospects for advanced economies.
- The analysis is based on the following non-euro area countries: United States (US), Japan (JP), United Kingdom (UK), Canada (CA), Switzerland (CH), Sweden (SE), Denmark (DK), Norway (NO) and Australia (AU).
- See Bry, G. and Boschan, C., “Cyclical Analysis of Time Series: Selected Procedures and Computer Programs”, NBER Books, National Bureau of Economic Research, 1971. This method provides a good approximation and has been widely used in empirical studies of expansions and recessions. See, for example, for G7 and EU countries, Artis, M.J., Kontolemis, Z.G. and Osborn, D.R., “Business Cycles for G7 and European Countries”, The Journal of Business, Vol. 70, No 2, April 1997, pp. 249-279; and, for the United States, Stock, J.H. and Watson, M.W., “Estimating turning points using large data sets”, Journal of Econometrics, Vol. 178, Part 2, January 2014, pp. 368-381. The results are broadly comparable with the dating reported by the Centre for Economic Policy Research (CEPR) and the NBER for the euro area and the United States respectively, both of which use more comprehensive methods that include not only quarterly GDP but also key GDP components, employment and industrial activity, among other variables. Recessions are defined as two consecutive quarters of decline in the level of GDP.
- See Burns, A.F. and Mitchell, W.C., “Measuring Business Cycles”, NBER Books, National Bureau of Economic Research, December 1946.
- For a similar approach to business cycle dating, see the box entitled “The measurement and prediction of the euro area business cycle”, Monthly Bulletin, ECB, May 2011.
- The analysis in this box and the ensuing dating of the phases of the business cycle are sensitive to the estimates of potential GDP. IMF and ECB estimates of potential growth are utilised. Annual data have been interpolated by cubic spline to obtain quarterly frequencies. Estimates of potential growth for the period before 1980 are obtained through simple de-trending techniques.
- The OECD Composite Leading Indicators follow an alternative approach that focuses on anticipating turning points in economic activity.
- As a result of the two-step approach, recession phases could follow any of the four expansionary phases, although in practice they mostly follow phase C and, to a lesser extent, phases B and D.
- See “March 2019 ECB staff macroeconomic projections for the euro area”, published on the ECB’s website on 7 March 2019.