
The geography of the euro area current account balance
Published as part of the ECB Economic Bulletin, Issue 7/2018.
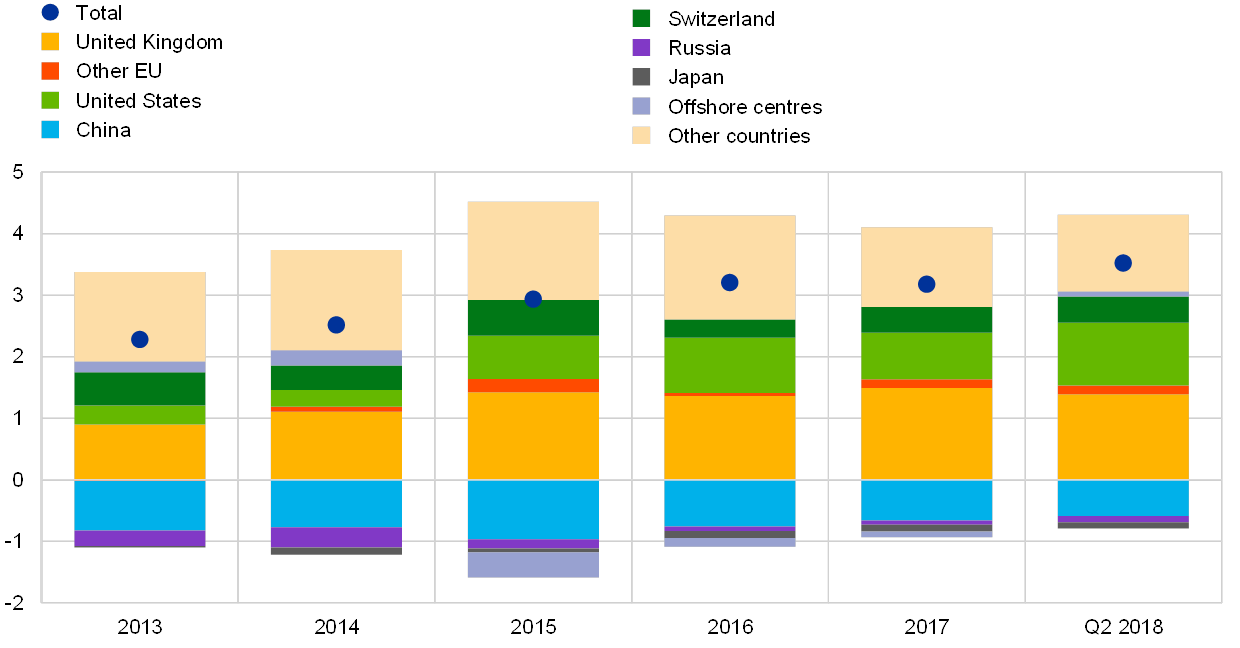
The composition of the euro area current account balance in terms of its geographical counterparts has been fairly stable in recent years, with the euro area’s most important trading partners accounting for the largest part of the bilateral surpluses and deficits (see Chart A). Newly available data on the geographical breakdown of the euro area current account balance reveal that the largest share of the euro area’s external surplus of 3.5% of GDP in the year to the end of the second quarter of 2018 was accounted for by the United Kingdom and the United States, which contributed 1.4% and 1.0% of euro area GDP, respectively, followed by Switzerland (0.4% of euro area GDP). China, on the other hand, contributed negatively (about -0.6% of euro area GDP) to the current account balance of the euro area. At the same time, the impact of all other major trading partners for which a geographical breakdown is available was relatively limited, while a residual group of countries – including major oil producers – also contributed positively to the euro area’s external surplus (about 1.3% of euro area GDP).
Chart A
Current account balance by geographical counterpart
(percentages of euro area GDP)
Source: ECB.
Notes: “Q2 2018” refers to the four quarters to the end of the second quarter of 2018. “Other EU” comprises EU Member States and EU institutions outside the euro area, excluding the United Kingdom.
The bulk of the increase in the euro area’s current account surplus of about 1.2 percentage points of GDP since 2013 was accounted for by improvements vis-à-vis the euro area’s three largest trading partners (see Chart B). Over this period, the euro area’s current account surpluses vis-à-vis the United States and the United Kingdom increased by 0.7 and 0.5 percentage point of euro area GDP, while the euro area’s current account deficit with China narrowed by 0.2 percentage point of euro area GDP. Moreover, the euro area’s current account balance also improved vis-à-vis non-euro area EU countries (excluding the United Kingdom) and Russia, while, for all other major trading partners, the euro area’s current account balance deteriorated.
Chart B
Change in the main components of the current account balance by geographical counterpart
(percentages of euro area GDP, change between 2013 and the four quarters to Q2 2018)

Source: ECB.
Note: “Other EU” comprises EU Member States and EU institutions outside the euro area, excluding the United Kingdom.
The largest changes in the geographical breakdown of the euro area current account balances since 2013 were recorded for trade in goods and primary income (see Chart B). Improvements in the bilateral current account balances mostly reflected increases in balances of trade in goods and primary income balances, in particular in the cases of the United Kingdom and the United States. At the same time, decreases in the current account balances were mostly due to a deterioration in bilateral primary income balances,[1] in particular vis-à-vis Switzerland, Japan and the residual group of countries. Moreover, the euro area recorded an improvement in its secondary income balance[2] vis-à-vis the rest of the EU (excluding the United Kingdom) owing to a decline in contributions to the EU budget.
Improvements in the balance of the euro area’s bilateral trade in goods since 2013 were largely export-driven in an environment of buoyant global demand, while imports also picked up overall (see Chart C). The largest increase in net exports was recorded vis-à-vis the United States. This was due to a strong increase in exports to the United States, which exceeded a modest increase in imports into the euro area, reflecting stronger domestic demand in the United States and the appreciation of the US dollar against the euro. At the same time, net exports also increased significantly vis-à-vis Russia as the result of a strong reduction in trade values, including a significant decline in euro area imports in the light of the depreciation of the Russian rouble and falling commodity prices. For the other trading partners, changes in net exports were less significant. In particular, net exports to other EU countries and China changed only marginally, reflecting a relatively balanced, robust expansion of trade with those trading partners. The strong expansion of bilateral trade with other EU countries was driven by the economic recovery in the EU and, in particular, the resurgence of value chains since the trade collapse triggered by the global financial crisis. At the same time, net goods exports to the United Kingdom and Switzerland increased slightly, partly on account of a decline in imports from those countries. The euro area recorded a slight worsening of net exports vis-à-vis the residual group of other countries, reflecting an overall reduction in export and import values, the latter mostly related to the observed decline in commodity prices.
Chart C
Change in exports and imports of goods by geographical counterpart
(percentages of GDP, change between 2013 and the four quarters to Q2 2018)

Source: ECB.
Notes: The inverse of the change in imports of goods is shown on the chart, so a negative value denotes an increase and a positive value a decrease. “Other EU” comprises EU Member States and EU institutions outside the euro area, excluding the United Kingdom.
Developments in bilateral primary income balances since 2013 were largely driven by income on foreign direct investment (FDI) – which evolved rather heterogeneously across geographical counterparts – and income on portfolio debt investment (see Chart D). The euro area’s FDI income balance is largely shaped by the operations of multinational enterprises (MNEs) resident inside and outside the euro area. In particular, MNEs’ investment decisions and profitability determine the evolution of FDI income. The largest improvement in the euro area’s FDI income balance was recorded vis-à-vis the United States, followed by the United Kingdom. This mainly reflected a larger increase in FDI positions of euro area residents in the United States and the United Kingdom than in FDI positions of United States and United Kingdom residents in the euro area. Conversely, the euro area’s FDI income balance declined most significantly vis-à-vis Switzerland, Japan and the residual group of countries. For the first two, this is in line with a relative increase in Swiss and Japanese residents’ FDI positions in the euro area. In the case of the residual group of countries, the decline in the FDI income balance was driven by lower (operational) profits recorded on euro area foreign direct investment in these destinations. The increase in the investment income balance on portfolio debt vis-à-vis the United Kingdom, the United States and Japan reflects the pronounced shift by euro area investors towards debt securities issued by entities resident in those countries in recent years, as well as a decline in yields on euro area debt securities.[3]
Chart D
Change in the main components of the primary income balance by geographical counterpart
(percentages of GDP, change between 2013 and the four quarters to Q2 2018)

Source: ECB.
Notes: “Other EU” comprises EU Member States and EU institutions outside the euro area, excluding the United Kingdom. “Other” includes compensation of employees, investment income on other investment and reserve assets and other primary income. All income on reserve assets is allocated to “Other countries”.
- Primary income represents the return that accrues to resident institutional units on their contribution to the production process or for the provision of financial assets and renting natural resources to non-resident institutional units (e.g. compensation of employees, dividends and interest).
- Secondary income pertains to those current transfers between residents and non-residents that directly affect the level of gross national disposable income and thus influence the economy’s ability to consume goods and services (such as international cooperation and workers’ remittances).
- See Fidora, M. and Schmitz, M., “Factors driving the recent improvement in the euro area’s international investment position”, Economic Bulletin, Issue 3, ECB, 2018.