
The paradox of banknotes: Understanding the demand for cash beyond transactional use
The paradox of banknotes: understanding the demand for cash beyond transactional use
Published as part of the ECB Economic Bulletin, Issue 2/2021.
1 Introduction
A phenomenon referred to as the “paradox of banknotes”[1] has been observed in the euro area; in recent years, the demand for euro banknotes has constantly increased while the use of banknotes for retail transactions seems to have decreased. Recent payment surveys indicate that the share of cash transactions in the euro area has decreased. This, together with ongoing digitalisation in retail payments, might have been expected to lead to a decrease in the demand for cash.[2] However, this reduction in demand has not occurred. In fact, the number of euro banknotes in circulation has increased since 2007 (see Chart 1). This seemingly counterintuitive paradox can be explained by demand for banknotes as a store of value in the euro area (e.g. euro area citizens holding cash savings) coupled with demand for euro banknotes outside the euro area. This article will use the available evidence to explain this phenomenon in more detail.
Chart 1
Euro banknote circulation
(left-hand scale: value, EUR billions, non-seasonally and non-calendar adjusted; right-hand scale: percentages)
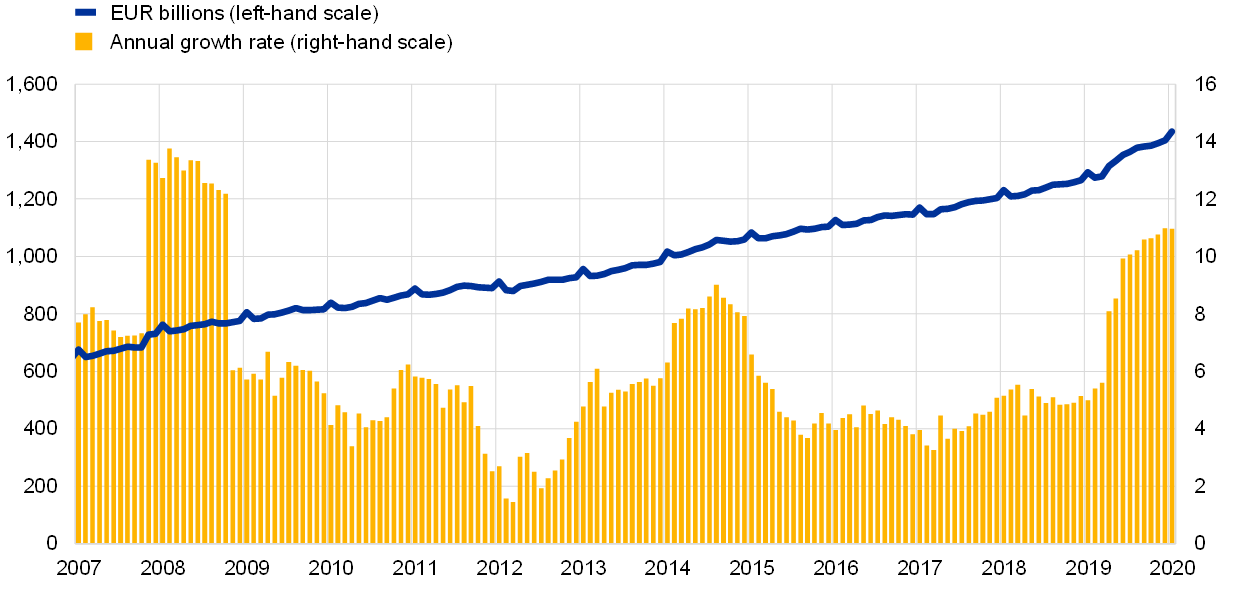
Source: ECB.
Notes: The latest observation was made in December 2020. Euro banknote circulation is the sum of all banknotes issued on net (issued minus returned) from Eurosystem central banks since the introduction of the euro. This includes banknotes held by banks, companies and citizens in the euro area and abroad.
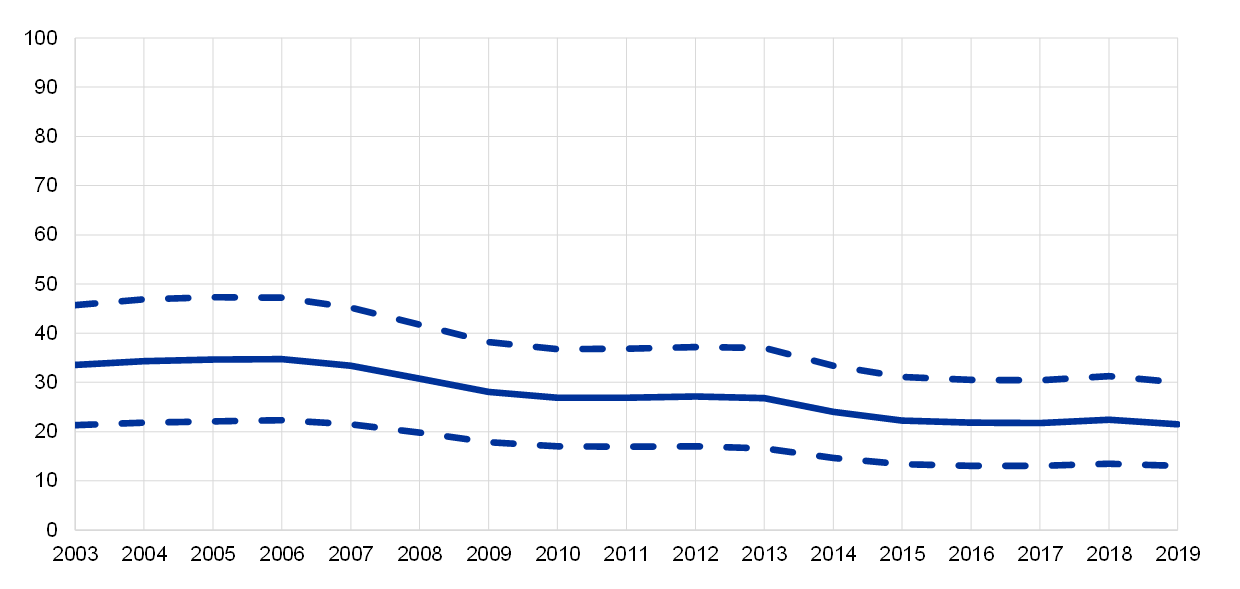
The growth in circulation of euro banknotes has been strong since they were introduced, even when considering the ratio of euro banknotes to GDP, or to the broad monetary aggregate M3.[3] This growth in circulation has intensified during the coronavirus (COVID-19) pandemic. At the end of 2020, the value of euro banknotes in circulation amounted to €1,435 billion, increasing by 11% from €1,293 billion in 2019 (Chart 1). Due to the COVID-19 pandemic, this annual growth rate was exceptionally high when compared with previous years (5% annual growth in the past 10 years on average). The only time the growth rate was higher was during the months following the Lehman Brothers collapse in September 2008.[4] However, the growth of euro banknote circulation has been remarkably strong since they were introduced even when compared to some other macroeconomic magnitudes; for example, the ratios of euro banknotes to nominal gross domestic product (NGDP) and to M3 have increased over the years (see Chart 2), amounting to 10.83% and 9.94% at the end of 2019, respectively. This suggests there are unique determinants behind the high demand for euro banknotes, other than the development of the activity of the domestic economy (NGDP) and distinct from factors influencing other monetary assets/liabilities (M3).
Chart 2
Euro banknotes over euro area nominal gross domestic product and M3
(percentages, year-end figures)

Sources: ECB.
Notes: The latest observation was made in December 2019.
Understanding the drivers of increasing banknote circulation is important for central bank core activities such as cash and liquidity management, retail payment strategies and monetary policy. Central bank cash and liquidity management activities can be improved by a good understanding of the demand for cash. For instance, if cash is widely used as a safe haven during times of potential market turbulence, it may be mandatory to hold substantial strategic contingency stocks of banknotes to meet extraordinarily high demand during periods of crisis.[5] Furthermore, understanding the demand for cash can shape well-informed retail payment strategies, for example by enabling projections for the future use of means of payments, or even assessing the potential demand of a cash-like central bank digital currency (CBDC). In addition, the size and growth of some components of cash demand have relevant implications when assessing the monetary policy stance and its implementation in a low interest rate environment.[6]
To shed light on the paradox of banknotes, it is important to identify the main uses of banknotes, although this is a difficult endeavour because cash usage is mostly unobservable. The value of euro banknotes in circulation can be broken down into three components: the value of banknotes (a) held for domestic transactions, (b) stored domestically and (c) demanded outside the euro area (both for transactions and as a store of value). Estimating the size of these components is key to understanding the paradox of banknotes. However, making such estimations is a highly complicated process because cash is used anonymously. The data collected by the European Central Bank (ECB) refers only to flows of banknotes through the central and commercial banks, so only a small part of the cash cycle is observable. There are also grey areas where it is impossible to define when a banknote is held for transactions or as a store of value. Nevertheless, it is possible to learn about the different uses of banknotes through direct (i.e. surveying cash users) and indirect approaches. These will be explored in the present article in Sections 2 and 3. Section 4 will address the COVID-19 developments during 2020, remarking on the importance of cash during crises.
2 Transactional use of cash in the euro area
Estimates of the value of banknotes held for transactions in the euro area can be produced using indirect approaches but these are subject to limitations. Indirect approaches use available ECB data on euro cash coupled with a set of assumptions to produce estimates of the portion of the value of banknote circulation used for domestic transactions. However, the reliability of these methods depends on the particular assumptions employed, and therefore they should be considered with an appropriate level of caution. The following looks at three approaches: (i) the seasonal method, (ii) the return frequency method and (iii) an analysis of the issuance of the Europa Series (i.e. the second series of euro banknotes). These provide insights as to the size and nature of domestic transactional demand for banknotes.
The seasonal method indicates that in 2019 between 13% and 30% of the value of banknote circulation was held for the purpose of euro area transactions, yielding a central estimate of 21.5% (€280 billion). The share of banknote circulation used for euro area transactions can be estimated using the seasonal method.[7] This method exploits the strong monthly seasonality of banknote demand to divide total circulation into domestic transactional demand and the rest of the demand components (domestic store of value and foreign demand). This means that estimates of this decomposition are produced by comparing the seasonality of total banknote circulation with the seasonality of a benchmark variable that is purely transactional.[8] As the reliability of this method strongly depends on the benchmark, two series were selected to produce an upper and a lower bound. Results indicate that, in 2019, between 13% and 30% of the value of euro banknote circulation was used for transactions in the euro area (see Chart 3). The central estimate of 21.5% (€280 billion) is considered to be a good approximation[9] but should still be interpreted with caution. It is also worth noting that both benchmarks indicate that the share of circulation used for domestic transactions has decreased over the years.
Chart 3
Estimates of the share of value of euro banknotes held for domestic transactions according to the seasonal method
(percentage of total circulation)
Sources: Author’s calculation, ECB.
Note: The solid line represents the central estimate and the dashed lines represent the lower and upper bound. The latest observation was made in December 2019.
According to the return frequency method, in 2019 between 15% and 25% of the value of euro banknote circulation was held for transactions in the euro area, yielding a central estimate of around 20% (€260 billion). Different denominations of euro banknotes return to Eurosystem central banks at varying frequencies.[10] Banknotes returning less often are partly circulating in domestic channels more distant from central banks and partly stored domestically or held abroad. As with the seasonal method, it is possible to produce an upper and lower bound of the active circulation by using the return frequency of purely transactional denominations as benchmarks (making two extreme assumptions). This is narrower than the interval estimated using the seasonal method.
An analysis of the introduction of the second series of euro banknotes provides further information on how the different denominations of banknotes circulate. The introduction of the second series of euro banknotes and the subsequent replacement of the first series provides valuable information. The saturation rates of different banknote denominations (i.e. number of banknotes of the second series in circulation over total number of banknotes from the first and second series) follow a specific type of pattern which can be analysed by fitting curves to the data.[11] Chart 4 illustrates this for €5 (typically transactional, like the €10 and €20 denominations) and €50 denominations (used for transactions but also as a store of value domestically and abroad like other high value denominations €100 and €200). An interesting pattern emerges: the curves start flattening before the new series saturate 100% of the circulation, reaching a steady-state saturation rate called the “carrying capacity”. This means that a portion of banknotes from the first series may never return to the Eurosystem because they may be either permanently stored domestically or – as is perhaps more likely – lost or held abroad. For low (typically transactional) denominations one would expect that most banknotes return to the central bank. They exhibit a higher carrying capacity (around 86% and 89%) than higher-value denominations (for example, the €50 has a projected carrying capacity of 70%). Also, as one would expect, the €5 denomination (mostly used for transactions) has a steeper curve, meaning that it reaches the carrying capacity quicker than the €50 (used for transactional purposes but also as a store of value both domestically and abroad).[12] These patterns are also observable with other denominations. This shows that the higher the value, the higher the likelihood that a banknote is used as a store of value domestically or abroad; similarly, the higher the value, the higher the likelihood it is held as a store of value for a long time.
Chart 4
Analysis of the €5 and €50 banknote saturation rates
(percentages, monthly data)
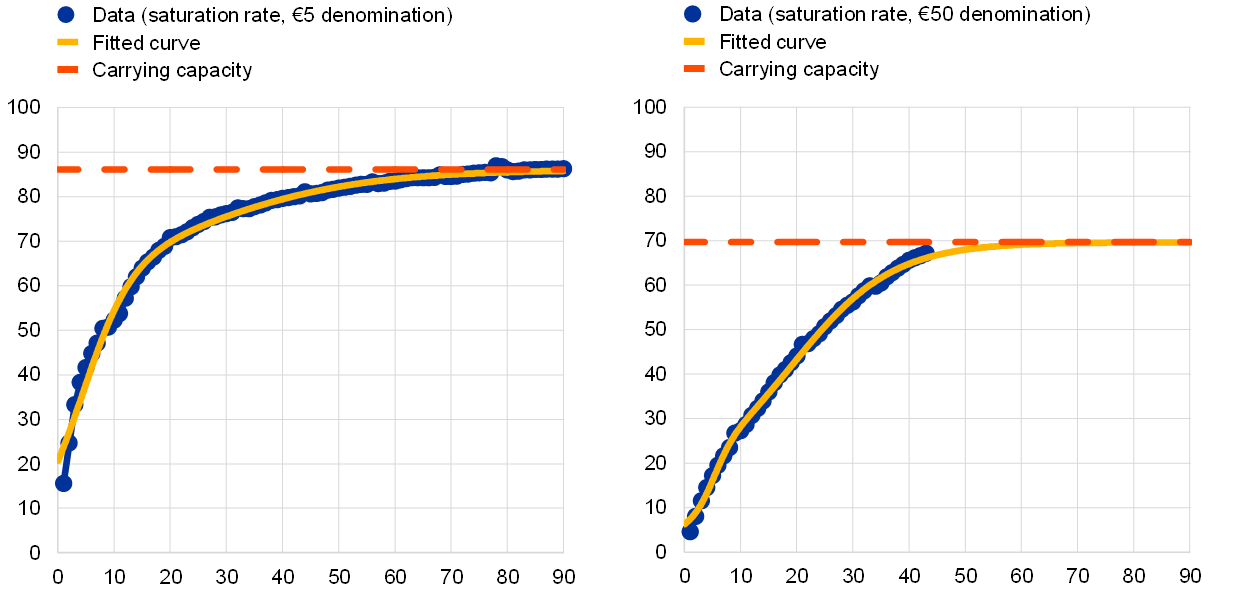
Source: ECB and author’s calculations; latest observation November 2020.
Notes: The saturation rate is the number of banknotes of the second series in circulation over total number of banknotes.
A recent ECB household survey[13] shows that the total value of cash transactions by citizens in 2019 amounted to €1,993 billion and that cash is still the most used means of (retail) payment, although the share of cash payments has decreased. Although indirect methods can provide valuable estimates of the use of cash for transactions domestically, direct methods such as payment surveys are necessary to supplement our indirect knowledge. As explained in more detail in Box 1, the cited ECB survey shows that, in 2019, cash was the most used means of payment in the euro area for point-of-sale (POS) and person-to-person (P2P) transactions and non-negligible in other types of transactions. However, the share of cash payments has decreased in the past three years by six percentage points. According to the survey, euro cash has been used for 117 billion physical and online transactions, corresponding to a value of €1,993 billion.
Box 1
Domestic transactional use of cash, evidence from the SPACE survey
The ECB Study on Payment Attitudes by Consumers in the Euro Area (SPACE)[14] shows the relevant role of cash in daily transactions; 72% of the transactions at the point of sale (POS)[15] (representing 47% in value terms) and 83% of person-to-person (P2P) transactions (57% in value) are made in cash.[16] The significant difference between number of transactions and value is due to the more frequent use of cash for low-value transactions. For both POS and P2P combined, payments below €15 represent most of the transactions made as shown in Chart A (left-hand panel). 92% of payments below €5 are made in cash while only 33% of transactions above €100 (which represent only 3% of all POS and P2P transactions) are paid in cash (see Chart A, right-hand panel).
Chart A
Use of payment instrument at POS and P2P, by value range
(x-axis: percentage, share in all transactions; y-axis: value, transactions)
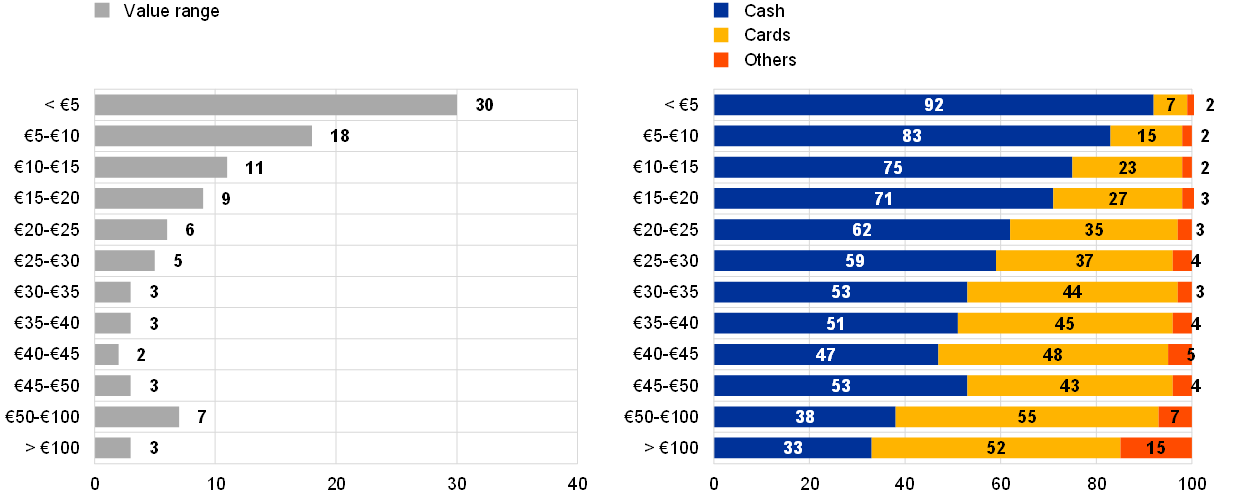
Sources: ECB, De Nederlandsche Bank, Dutch Payments Association and Deutsche Bundesbank.
Even if cash is the most used means of payment in POS and P2P transactions, its usage compared to other payment instruments has decreased in the last three years when a similar survey was conducted[17]. Since 2016, the share of cash payments has decreased by six percentage points both in terms of number of transactions and value, both for POS (from 78% of transactions and 53% of value three years ago) and P2P (from 89% of transactions and 63% of value).
Other person-to-business payments where cash is used are the recurring payments such as to pay electricity bills, telephone bills or rent, with large differences across countries and types of service. Around 6% of citizens in the euro area pay electricity bills in cash, with a high variability across countries (ranging from 1% to 38%). The use of cash is lower for rent (4%) and phone bills (5%), also with significant differences in euro area countries.
As a means for transaction, the use of cash for business-to-person payments is non-negligible, although it has declined since 2016. According to SPACE, 13% of euro area citizens still get some regular income in cash. Around one in ten respondents received up to half or more than half of their income in cash. In terms of occupation, self-employed citizens receive income in cash more often; on average, 26% of them have received at least part of their income in this way.
3 The non-transactional demand of banknotes
The central estimates of the previous section suggest that around 80% of the value of banknotes in circulation was not actively used for domestic transactions in 2019, and this share has risen over the years. The following section will present the available evidence on the remaining components of cash demand, namely foreign demand and domestic store of value.
The circulation of euro banknotes outside the euro area
A recent comprehensive study[18] on the foreign demand for banknotes suggests that between 30% and 50% of the value of euro banknotes was held abroad in 2019 and this share has been increasing in recent years. In December 2019 the total cumulated (i.e. net) euro banknotes shipped in and out of the euro area via banking channels only represented 13% of total banknote circulation in terms of value. However, the study clarifies that there are several channels through which banknotes can flow in and out of the euro area, such as non-registered remittances or tourism. This is why several indirect approaches were used to more accurately investigate this topic. According to a method developed by the ECB, in 2019 around 30% of the total value of banknotes in circulation was held abroad.[19] This share goes up to 50% for the same year when using the seasonal (estimates for 2018) and age of banknote methods (estimates for 2019). These two methods compare certain characteristics (such as seasonality or the lifespan of banknotes) of the euro banknote population with other, otherwise similar, reference countries’ banknote populations.[20] Interestingly, both the ECB method and the seasonal method[21] suggest that this share has been increasing over the years (from around 20% in 2008 to around 30% in 2018 and from over 35% in 2008 to over 50% in 2018, respectively). The wide interval resulting from the different methods reflects the complexity of estimating the size of the foreign demand component of euro banknotes. As explained in relation to the indirect approaches used in Section 2, the reliability of these methods depends on a variety of assumptions, and thus the results should be taken with a certain degree of caution.
There are many reasons why in developing and transition economies there is a high demand for national cash in general and foreign strong currencies in particular.[22] The literature normally attributes the high use of cash in developing and transition countries to both supply-side problems (such as underdeveloped payment infrastructures and the lack of access to credible saving alternatives) as well as demand-side factors (lack of trust in banks, deeply entrenched habits or unfavourable perceptions towards electronic payments). For the use of US dollar outside the United States, it has been found that some of the factors that influence its foreign demand are high historical inflation in those countries, size of the domestic market, global and local economic uncertainty and past dollar use. Recent evidence from a survey conducted regularly by the Oesterreichische Nationalbank (OeNB) also provides valuable findings on the determinants of euro banknote demand, although it is limited to central, eastern and south-eastern European economies. These determinants include limited trust in the local financial systems and in local currency, stronger individual preferences for cash, or expectations of the future adoption of the euro.
A macroeconometric model of euro banknote demand and quantitative and qualitative analyses of the determinants of euro net shipments find that mostly local factors (from countries demanding banknotes) influence foreign demand.[23] Different approaches indicate that the local economic activity of foreign countries has an impact on the overall demand for euro banknotes; also, local inflation, local unemployment and the nominal USD/EUR exchange rate influence euro net shipments. The influence seems to be mainly driven by medium- and high-denomination banknotes. Notably, apart from store-of-value and safe-haven asset demand, in some regions (Americas, Middle East, Asia and western non-EU countries) tourism seems to be the most important factor influencing demand.
The use of euro banknotes for domestic store of value
Between 27.5% and 50% of the value of banknote circulation is thought to be stored in the euro area in 2019, meaning that per-adult cash reserves (of euro area citizens as well as of banks and companies) range between €1,270 and €2,310. Using the estimates that around 20% of the value in circulation was used for domestic transactions and between 30% and 50% was held abroad, this means that in 2019 between 27.5% and 50% was used for store-of-value purposes in the euro area.[24] This implies that the amount of cash reserves per-adult ranged between €1,270 and €2,310. It should be stressed that this per-adult amount includes people’s holdings, but also cash held by euro area monetary financial institutions (MFIs) and companies. This breakdown by sectors has not been determined so far.
Although cash held by MFIs in normal conditions is mostly held for transaction purposes, the developments of vault cash in recent years can provide a hint of the amount of cash used for store-of-value purposes. Generally, MFIs hold cash in their vaults mainly for the purpose of transactions. Chart 5 shows that, after the rate of the ECB’s deposit facility went into negative territory (more obviously, when it was decreased in March 2016 from -0.3% to -0.4%) a visible break in the series can be observed, hinting that storing cash was made relatively more attractive. As vault cash was rather stable from 2009 to the moment when the deposit facility rate first became negative in June 2014, it is likely that most of the €30 billion (60%) increase from then until the end of 2019[25] was for the purpose of storing value. Despite its pronounced increase, vault cash only represented around 7% of total banknote circulation at the end of 2019 so it can by no means entirely explain the increase of domestic store of value usage.
Chart 5
Vault cash held by MFIs and Deposit Facility Rate
(left-hand scale: value, EUR billion; right-hand scale: percentage points, end-of-month figures)
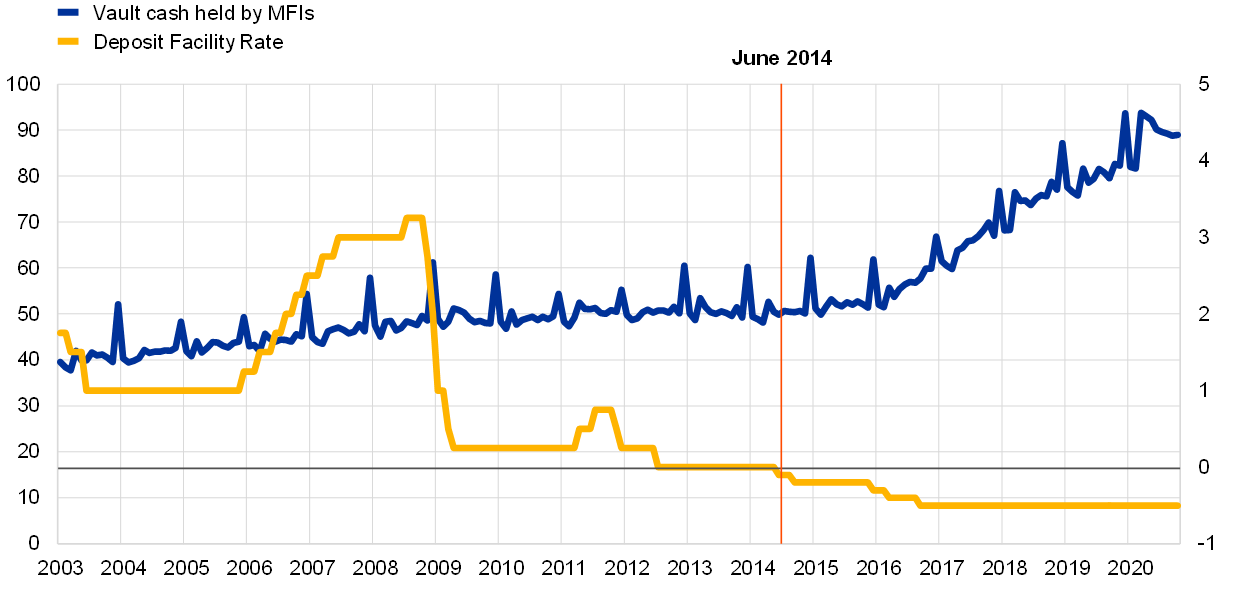
Source: ECB; latest observation October 2020.
In contrast to MFIs, there is neither available data on the precise amount of cash held by retailers and citizens, nor estimates on the trends of their cash holdings in recent years. At the same time, it is certain that the above change in the deposit facility rate did not affect companies (who mostly hold cash for transactions) and people living in the euro area in the same manner as it did MFIs, as neither people nor companies are able to deposit excess liquidity with the ECB. Nevertheless, as long as the opportunity cost of holding cash has decreased due to the low interest rate environment, people and companies might have been inclined to save more in cash than in other liquid assets yielding low interest. However, it is likely that, as is the case with other currencies that experienced a high increase in non-transactional demand, the low interest environment cannot fully explain the rise in demand. It is possible that other factors, such as increased uncertainty or the ageing of the population, may be at play.[26]
Household surveys, such as SPACE, provide further evidence on cash reserves held by citizens but, due to the sensitivity of the questions, respondents are thought to underreport their cash holdings. This means that survey results must also be considered with an appropriate level of caution. Box 2 presents evidence from SPACE on cash reserves, as well as from a recent nationwide survey in Germany studying the motives of why German citizens save in cash.
Box 2
Domestic cash holdings of euro area citizens: evidence from two recent surveys
Descriptive analysis of SPACE data on cash reserves by euro area citizens
SPACE data show that around one out of three respondents kept cash reserves at home in 2019, with sizeable differences across countries. 34% of respondents declare to hold cash reserves, while 62% declared that they don’t hold any cash and 4% refused to answer. In some countries, up to 50% of respondents report keeping extra cash.
In 2019 most of the respondents holding cash at home answered that they held relatively small amounts; this suggests the bulk of citizens’ cash holdings might be held by a reduced share of the population. Among those who responded that they put cash aside outside a bank, three out of four people (75%) had less than €500, while one out of ten (10%) kept between €500 and €1,000. A small portion of respondents declared high amounts, only 6% reported between €1,000 and €5,000 and 2% kept over €10,000. Some of the respondents who reported keeping cash at home refused to disclose how much cash they store (7%).
In the euro area, there are important differences across socio-demographic groups such as gender, education and income (see Chart A). Men are more likely to hold larger amounts than women and individuals with more education tend to hold higher amounts of cash than those with less education. However, this could be reflecting income inequalities within the above groups, as the survey shows that consumers with higher income level keep higher amounts of extra cash. Further research is needed to assess how the different variables influence cash holdings.
Chart A
Amount of cash reserves (€500 and above) by demographics
(Percentage of the overall population)

Sources: ECB, De Nederlandsche Bank and Dutch Payments Association and Deutsche Bundesbank.
Notes: The data on average, gender and education are for the euro area (19 countries). The data for the income groups excludes the Netherlands (18 countries). Income group is defined as the monthly household income after taxes and social security.
Results from a German study
A recent study based on survey data from Germany[27] – a country that accounts for a large share of banknote circulation in the euro area – shows that individuals in Germany held an average of €1,364 in cash in 2018. To obtain this data, the survey employed a number of confidence-boosting measures to reduce the bias of underreporting the amounts of cash reserves and gain insight into other sensitive aspects. The average amount declared (€1,364) is close to the lower bound of holdings in the euro area provided in the main text of this section (€1,270), although the figures are not directly comparable as, among other aspects, the estimates in this article also consider holdings by banks and retailers.
Regression results point that age, income and employment status have an influence on holding cash reserves. Older people tend to hold more cash outside their wallets, although the increase of holdings by age is not linear (cash reserves seem to be accumulated until shortly before retirement). The average cash amount that individuals save rises with income, and the bulk of the value of cash holdings seems to be concentrated among the top percentiles of the income distribution. Among those working, the largest reserves are held by self-employed people.
The above study also looks at the reasons why people hoard cash: factors such as doubts about the security and reliability of technical systems had an impact, whereas tax motives were not a key factor. The study asked a set of indirect questions about tax morale to develop a set of tax honesty indicators without directly asking the respondents about these matters. Although 12% of respondents declared that tax motives can explain why people choose to hold cash, there is no correlation between tax honesty indicators and keeping cash aside. Some other factors, such as concerns about security and the reliability of technical systems, appear instead to influence the decision to keep cash outside the wallet. Moreover, those who reported having doubts about technical systems tended to hold relatively large amounts.
4 The increase in banknote issuance during crises: the case of the COVID-19 pandemic
During 2020 the increase in banknote circulation was abnormally high due to the COVID-19 pandemic, a trend that has also been observed in other crises periods. During different types of crises, people tend to increasingly demand cash, and the COVID-19 crisis was no exception (see Box 3). Chart 6 shows the net issuance of euro banknotes in 2020 and compares it with the previous two (normal) years. After the negative issuance at the beginning of the year (when, after Christmas, returned banknotes are always higher than issued banknotes), net issuance in 2020 started deviating from the normal growth rate once the COVID-19 pandemic spread across Europe. In the two previous years, net issuance in December was around €61 billion, while in 2020 it was over €141 billion (an €80 billion difference representing an increase of over 130%).
Chart 6
Cumulated net issuance of euro banknotes in 2020 compared with previous years
(EUR billion, cumulated net issuance, end-month figures)

Source: ECB; latest observation December 2020.
Box 3
Cash and crises
It has been observed globally that, in the past, an important driver of high increases in cash holdings has been rising cash demand due to crises.[28] As can be seen in Chart A, cash demand has increased in major currency areas during all the included crises, sometimes quite drastically. In what follows, we cover historical examples worldwide that point at the importance of cash during crises by distinguishing between three different types of crisis, namely (a) technological crises (such as the Y2K crisis), (b) financial market crises (like the great financial crisis of 2008/9) and (c) natural disasters (such as earthquakes, hurricanes or the ongoing COVID-19 pandemic).
Chart A
Annual growth rates of cash in selected countries
(local currency)
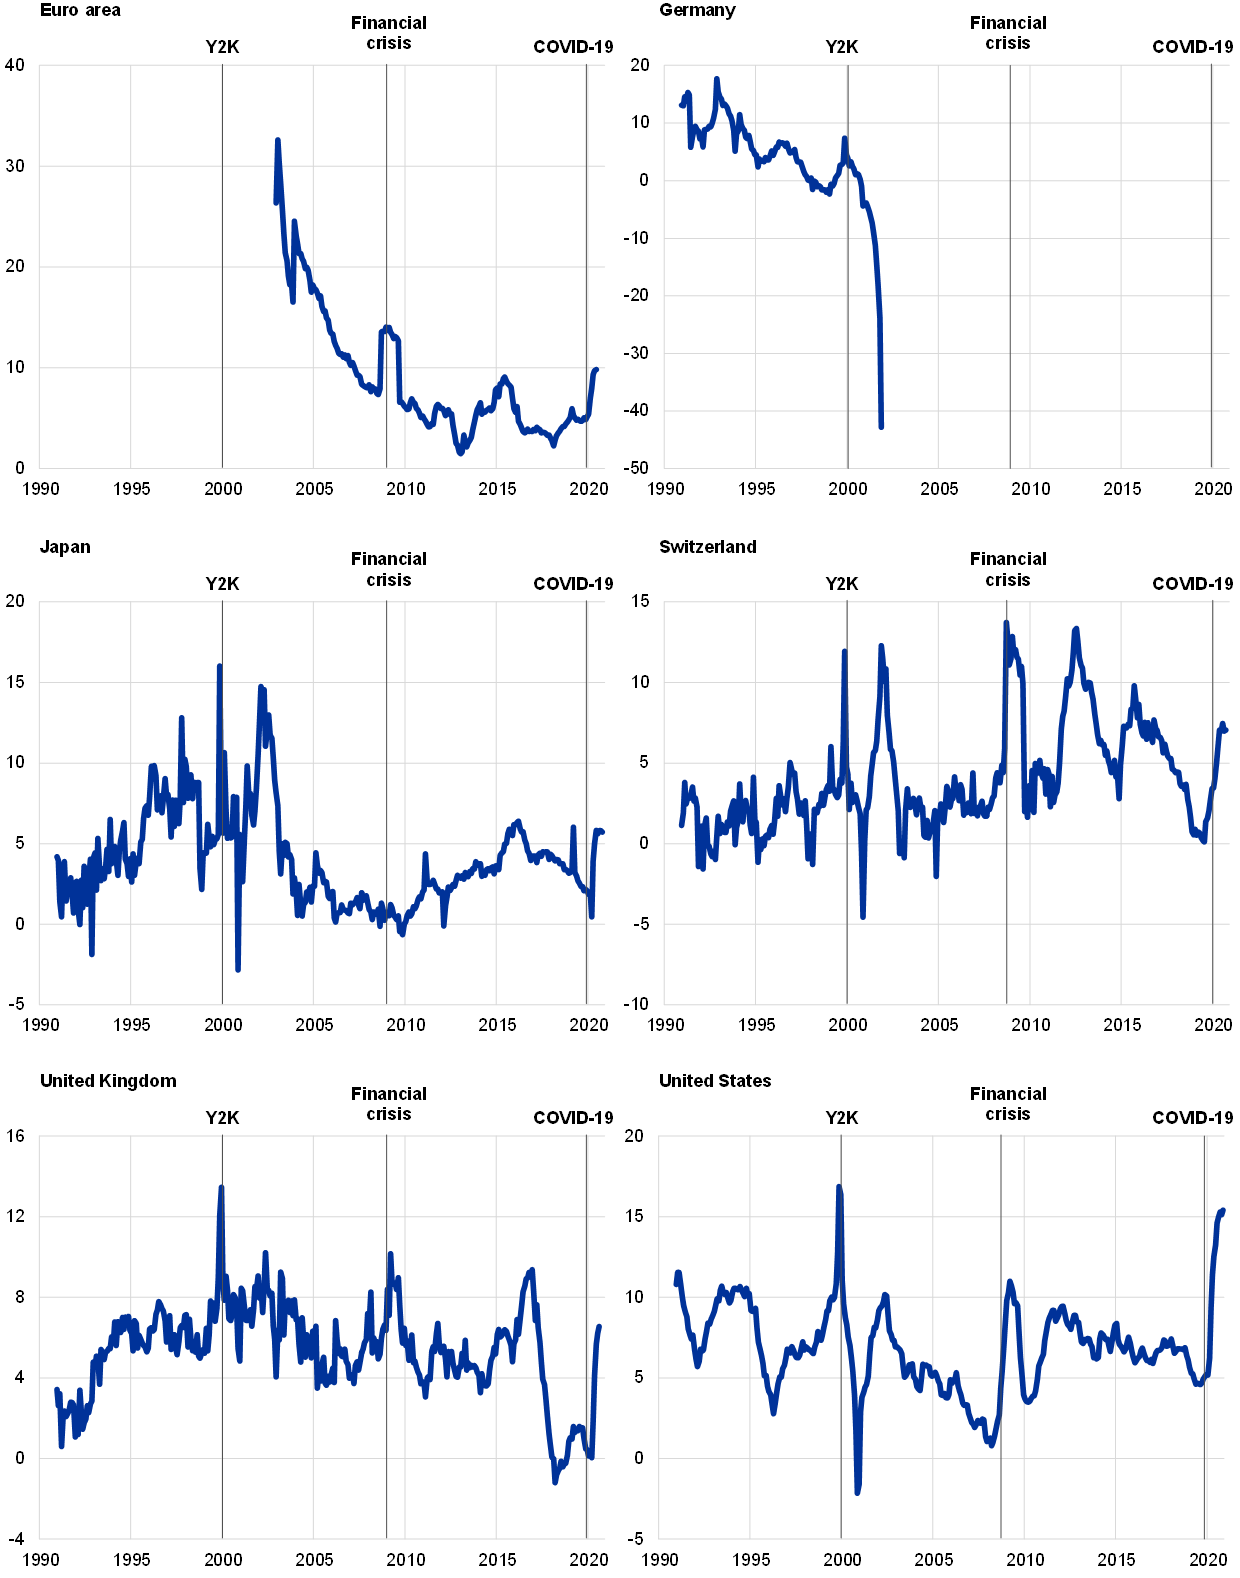
Source: Relevant national central banks.
Notes: Data refer to cash or banknotes in circulation.
The huge increase in the global demand for cash during the technological crisis around the turn of the year 2000 (Y2K) was caused by a heightened uncertainty. At that time, it was feared that the re-setting of computer program dates in order to adjust for the new millennium would have led to a shutdown of important institutions like public utilities, but also the smooth functioning of payment systems and cash withdrawals from ATMs were in question. The surge in cash in circulation (see Chart A) around the millennium was thus driven by transaction and precautionary motives as well as the desire to store value. For example, in the United States cash issuance of both small and large denominations increased by an annual rate of more than 20% at the end of 1999, whereas cash demand for Swiss francs concentrated mainly on high denominations (annual growth rate: 14%) probably reflecting a strong increase in foreign demand.[29] Domestic demand for cash around Y2K was often also fuelled by an increase in banks’ vault cash, especially in the United States.
After the collapse of Lehman Brothers in October 2008, the resulting financial turmoil in the United States quickly scaled up to a global financial crisis which led to a visible increase in cash demand. In the United States, where the financial crisis originated, but also in the euro area, in Switzerland and in the United Kingdom, cash issuance went up considerably. In Japan, in contrast, which was not as heavily hit by the crisis, neither overall cash issuance nor single yen denominations showed an unusual increase. This time, store of value was obviously the dominant motive behind cash demand as especially the larger denominations increased (in the United States, the euro area, Switzerland and the United Kingdom). In the first three currency areas, this was due to domestic and foreign demand for the respective currencies.
The outbreak of COVID-19 led to a drastic downturn for the world economy in 2020, resulting in a stark decrease in turnover at the point of sale. However, global cash in circulation increased exceptionally. Regarding the demand for small and large banknote denominations, interesting differences emerged. In the United States as well as in the euro area, annual growth rates of small banknote transaction balances exceeded those of the largest denominations in mid-2020, whereas the opposite was true for banknote issuances in Switzerland and Japan.
To summarise, crisis periods have fostered cash demand in the past regardless of what kind of crisis occurs. This points to the important role that physical cash seems to play in successful crisis management.
The transactional demand for cash has decreased while contactless payments have increased, according to a 2020 ECB survey on consumers’ perceptions during early stages of the pandemic. The survey to measure the impact of the pandemic on cash trend (IMPACT survey) provides an indication as to changes in payment behaviour during the first stages of the COVID-19 pandemic[30]. Although around half of the respondents reported using cash and cards in a similar manner as they had before the crisis, around 40% declared that they were using contactless payment cards more often. The same share (40%) of respondents declare that they were using cash much less often or somewhat less often. The latter group of respondents were also asked about their expected behaviour after the pandemic; around 87% indicated that they would continue to pay less often in cash when the pandemic is over. This would point towards a further decrease in transactional demand for cash, although researchers have observed that consumer perceptions or self-reported preferences are normally not indicative of payment behaviour.[31] Hence, further survey evidence after the pandemic is needed to assess whether these findings will be consolidated after the pandemic.
Reduced banknote flows in and out of Eurosystem central banks indicate that active circulation has decreased, suggesting a higher precautionary demand possibly due to increased uncertainty and reduced mobility[32]. Although during other crises there was an increase in the gross issuance of euro banknotes, during the COVID-19 pandemic it decreased compared to previous levels. The high increase in net issuance (gross issuance minus returns) is because the number of banknotes returning to the central bank decreased even more than gross issuance. This indicates that banknotes are circulating less actively than in the previous year, reflecting an impulse to keep cash reserves for precautionary savings, as well as corroborating a weaker transactional demand. Reasons for this behaviour could include increased uncertainty and reduced mobility (leading households to hold higher amounts, thereby reducing the need to go to a cash dispenser).
Euro banknote shipments data suggests that foreign demand did not account for a sizeable share of this increase, which indicates that it could be mostly due to precautionary motives within the euro area. The cumulated net shipments of euro banknotes abroad in 2020 was negative, meaning that more banknotes returned from abroad than those that were issued. This indicates that demand for banknotes from outside the euro area did not contribute to high demand. Informal channels, such as tourism or remittances, most likely did not contribute either, as these activities also decreased during the pandemic. This means that most of the demand was coming from domestic (euro area) precautionary savings.
5 Conclusions
The first step to understanding the paradox of banknotes is to acknowledge the importance of demand for cash for store-of-value purposes, as well as demand for euro banknotes outside the euro area. Although cash is still the most used means of payment at POS and P2P according to recent ECB surveys, the share of cash transactions versus other payment methods has decreased over time. However, cash demand has increased overall, and decomposing banknote circulation into its three components (euro area transactional demand, store of value inside the euro area and foreign demand) is key to explaining this increase. The share of the value of banknote circulation held for euro area transactions is thought to be between 20% and 22% (the upper and lowest bounds indicate this share may be between 13% to 30%, but these are based on extreme assumptions and central estimates are deemed reasonable). This reduced share highlights the importance of the other two components of cash demand: the store-of-value demand inside the euro area (28% to 50% of total circulation value in 2019) and the foreign demand for euro banknotes (30% to 50% in 2019). The wide intervals of the estimates indicate a high uncertainty due to the fact that the ways people actually use cash is not directly observable. This means that such estimates should be considered with appropriate caution. Figure 1 depicts the estimated size of the different components of banknote demand.
Figure 1
Estimates of components of euro banknote circulation
(percentages, rounded figures without decimals)

Source: Author’s calculations and Lalouette, L. et al., op. cit., 2021.
Notes: Percentage estimates refer to value of banknotes in circulation. For the share of domestic demand the central estimates of the seasonal and return frequency methods are used. The lower and upper bounds that result from extreme assumptions are not depicted for simplicity.
The COVID-19 pandemic has intensified the euro area demand for cash for precautionary purposes (i.e. as a store of value) while the transactional demand seems to have further decreased; it is still uncertain how cash would be used after the pandemic. Survey evidence and the reduced flows of banknotes in and out of the Eurosystem central banks suggest that the demand for cash transactions has decreased. As with other crises, the increase in cash demand has been driven by precautionary motives, although this demand has come mainly from inside the euro area. Further evidence will be needed in the future to assess how cash will be used once the pandemic is over.
- This phenomenon has also been observed with other currencies, particularly those with a strong foreign demand; the term was coined in Bailey, A., “Banknotes in Circulation: Still Rising: What does this Mean for the Future of Cash?”, Speech at the Banknote 2009 Conference, Washington DC, 2009.
- For simplicity, specific references to coins (2% of euro cash value) are not made throughout this article.
- M3 or “broad money” is the sum of currency in circulation, deposits and other liquid monetary liabilities
- This and other events influencing the value of banknotes in circulation are described in the article entitled “Trends and developments in the use of euro cash over the past ten years”, Economic Bulletin, Issue 6, ECB, Frankfurt am Main, 2018.
- See Panetta, F., “Beyond monetary policy – protecting the continuity and safety of payments during the coronavirus crisis”, The ECB Blog, 28 April 2020.
- See Assenmacher, K., Seitz, F. and Tenhofen, J., “The use of large denomination banknotes in Switzerland, International Cash Conference 2017 War on Cash: Is there a Future for Cash? Deutsche Bundesbank, Constance, 2017, pp. 148-199.
- A formal description of the method, as used in this section, can be found in ibid., pp. 148-199. Vault cash and the €10-banknote circulation, corrected for carrying capacity (see more of this below), are selected as benchmarks.
- The seasonality of domestic cash transactions cannot be observed. Benchmark variables that have been used to effectively capture domestic cash transactions are small denominations like the €10 banknote or vault cash; see the article entitled “Trends and developments in the use of euro cash over the past ten years”, op. cit., and Bartzsch, N., Rösl, G. and Seitz, F., "Currency movements within and outside a currency union: The case of Germany and the euro area", The Quarterly Review of Economics and Finance, Vol. 53, No 4, Elsevier, Amsterdam, 2013, pp. 393-401.
- The seasonality of transactional demand is likely to be underestimated for the €10 banknote series (not all €10 banknotes are used for transactions) and overestimated for vault cash series (safety stocks during peak demand periods heighten the seasonality).
- The return frequency for a certain denomination is the number of returned banknotes over a year divided by that year’s average circulation; for a detailed explanation, see the article entitled “Trends and developments in the use of euro cash over the past ten years”, op. cit.
- Logistics models that assume circulation can be divided into two distinct compartments provide the best fit. This matches the intuitive assumption that a portion of banknotes actively circulate and return quickly to the central bank, while others return more slowly as they are circulating in distant channels or stored.
- This simple graphical analysis can be made more precise by interpreting the first and second derivatives of the curves. This enables accurate assessment of when the return of banknotes for the different denominations accelerates and decelerates.
- See “Study on the payment attitudes of consumers in the euro area (SPACE)”, ECB, Frankfurt am Main, December 2020.
- ibid.
- The POS category is the most common type of person-to-business payment and it includes transactions at: supermarkets; small shops for day-to-day items (e.g. bakery, drug store); street vendors or markets (e.g. newspaper, florist); shops selling durable goods (e.g. clothing, toys, electronics); petrol stations; restaurants; bars; cafés; hotels; venues for culture, sport or entertainment; vending or ticketing machines; offices of public authorities or post offices; services outside the home (e.g. hairdresser, dry cleaning); and all other physical locations.
- Considering POS and P2P combined it is 73% in number and 48% in value.
- See Esselink, H. and Hernandez, L., “The use of cash by households in the euro area”, Occasional Paper Series, No 201, ECB, Frankfurt am Main, November 2017.
- Lalouette, L., Zamora-Pérez, A., Rusu, C., Bartzsch, N., Politronacci, E., Delmas M., Rua, A., Brandi, M. and Naksi, M., “Foreign demand for euro banknotes”, Occasional Paper Series, No 253, ECB, Frankfurt am Main, 2021.
- See “Estimation of euro currency in circulation outside the euro area”, ECB, April 2017.
- In the study, the chosen references were the Canadian dollar for the seasonal method and the Danish krone for the age of banknotes method. For more on both methods, see Lalouette, L. et al., op. cit., 2021.
- The age of banknotes only provides an estimate for 2019 due to data unavailability.
- A literature review can be found in Lalouette, L. et al., op. cit., 2021.
- ibid.
- These figures are calculated as a residual value from the previous estimates of the other components and the wide intervals reflect the uncertainty surrounding the previous calculations.
- Considering the seasonally adjusted series (i.e. removing the seasonal peak of December).
- For example, see Jobst, C. and Stix H., “Doomed to Disappear? The Surprising Return of Cash Across Time and Across Countries”, CEPR Discussion Papers, No 12327, September 2017, and Shirai, S. and Sugandi E. A., “What Explains the Growing Global Demand for Cash?”, ADBI Working Papers, No 1006, Asian Development Bank Institute, Tokyo, September 2019.
- Eschelbach, M. and Schneider, F., “Cash hoarding by German households – an empirical analysis of how much cash they store and why”, Deutsche Bundesbank, Frankfurt am Main, July 2020.
- A more thorough analysis of the relationship between cash and crises can be found in Rösl, G. and F. Seitz, “Cash and Crises: No surprises by the virus”, IMFS Working Papers, No 150, Institute for Monetary and Financial Stability, Frankfurt, 2021.
- See, e.g. Assenmacher, K., Seitz, F. and Tenhofen, J., “The demand for Swiss banknotes: some new evidence”, Swiss Journal of Economics and Statistics, Vol. 155, No 14, Springer, 2019.
- However, it is not directly comparable to the SPACE survey. Further, some figures in the main text were from questions admitting multiple answers. See for more detail “Study on Payment Attitudes by Consumers in the Euro Area”, op. cit.
- ibid.
- In March 2020, during the start of the pandemic in Europe, gross issuance increased, which was partly associated with lockdown announcements and subsequent runs on basic food (associated with higher spending). However, the rate of growth of gross issuance decreased in the following months and has not yet returned to normal levels.