
European financial integration during the COVID-19 crisis
European financial integration during the COVID-19 crisis
Published as part of the ECB Economic Bulletin, Issue 7/2020.
This article provides an overview of financial fragmentation during the coronavirus (COVID-19) crisis and the policies enacted to counter its effects. It does so through the lens of a set of high-frequency indicators for monitoring developments in financial integration. The readings from these indicators are then linked to unfolding economic and political events and to the main policy responses in monetary, fiscal and financial stability policy at the national and European levels. After initial sharp fragmentation, euro area financial integration broadly recovered to pre-crisis levels by mid-September, but not for all indicators. However, this recovery is still fragile and relies on an unprecedented amount of fiscal, monetary and prudential policy support.
1 Introduction
The coronavirus (COVID-19) has created an unprecedented type of shock and has caused a sharp economic downturn. In January 2020 the coronavirus started to spread around the globe, including large parts of Europe. On 30 January the World Health Organisation declared COVID-19 to be a public health emergency of international concern and on 11 March upgraded the threat to pandemic status. As it became clear that extensive containment measures would be required to control the spread of the virus, including lockdowns, economic activity in the euro area began a downturn unprecedented in scale and speed.
The coronavirus is a common health emergency, but it has had differing effects across euro area economies. The pandemic caused shocks to both supply and demand. Supply was constrained by business closures and workers staying at home. The halting of retail activities and disruptions in supply chains were then accompanied by a plunge in the demand for intermediate and final goods.[1] While the cause of these shocks has been common to all countries, the size of the economic fallout has differed markedly across countries owing to differences in, among other things, initial macroeconomic and financial conditions, the stringency of public health measures and the strength of domestic fiscal measures to support the economy, for example tax deferrals, loan guarantees, social security payments suspension, export guarantees, liquidity assistance and short-term work schemes.
The coronavirus crisis put the real economy and financial markets under extraordinary stress, leading to an initial sharp fragmentation of euro area financial markets. Within days of the first reported case of coronavirus in Europe on 24 January 2020[2], the composite indicator of systemic stress (CISS) started surging towards levels close to those last seen during the global financial crisis (GFC) of 2008 and the euro area sovereign debt crisis (SDC) of 2011-12 (see the yellow line in Chart 1). Within weeks of the first reported cases, the price-based composite indicator of financial integration[3] fell towards levels similar to those observed in the months following the introduction of the euro (see the blue line in Chart 1). The drop between February and April 2020 was comparable to the declines it experienced at the start of the GFC of 2008 and the SDC, and the drop in March 2020 was the fourth-largest month-on-month drop in the level of this indicator since the launch of the euro. There were concerns about fragmentation among euro area countries.[4] A positive correlation between systemic stress and fragmentation in euro area financial markets – a characteristic of previous crises – reappeared. However, one remarkable feature of the COVID-19 crisis, documented in Section 2, has been the fast rebound of financial integration thanks to rapid policy responses and the resilience created by the financial backstops and reforms implemented in the last ten years.
Chart 1
Financial integration and systemic risk in the euro area
a) Historical price-based financial integration and systemic risk from January 1995 to August 2020
(monthly data)

Sources: ECB and ECB calculations.
Notes: The price-based composite indicator of financial integration in panel (a) was developed by Hoffmann, P. et al., op. cit., and transformed to give the daily readings shown in panel (b) (see Box 1). For details on the general methodology behind the CISS, see Holló, D., Kremer, M. and Lo Duca, M., “CISS – a composite indicator of systemic stress in the financial system”, Working Paper Series, No 1426, ECB, Frankfurt am Main, March 2012. Both indicators are calibrated to vary between 0 and 1. The shaded areas in panel (b) mark the four phases of the crisis as defined in Table 1.
The events shown as numbered lines in panel (b) of this chart are as follows:
1. First European Council meeting on the European response (10 March)
2. ECB Governing Council meeting (12 March)
3. Second European Council meeting on the European response (17 March)
4. ECB announcement of the PEPP (18 March)
5. PEPP legal documentation published (25 March)
6. Third European Council meeting on the European response (26 March)
7. ECB collateral rating freeze (22 April)
8. Fourth European Council meeting on the European response, with endorsement of the Eurogroup’s comprehensive policy response and plans for a recovery fund (23 April)
9. ECB Governing Council meeting (30 April)
10. Franco-German €500 billion European recovery fund proposal (18 May)
11. European Commission €750 billion “Next Generation EU” recovery instrument proposal (27 May)
12. ECB expansion of the PEPP (4 June)
13. Fifth European Council meeting on the European response (19 June)
14. ECB Governing Council meeting (16 July)
15. Start of special European Council meeting (17-21 July)
16. ECB Governing Council meeting (10 September).
b) Price-based financial integration and systemic risk during the COVID-19 crisis from 30 January to 15 September 2020
(daily data)

The rapid unfolding of the COVID-19 crisis triggered the need for high-frequency monitoring of financial fragmentation developments across different market segments. The ECB has monitored the state of financial integration in the euro area since the launch of the euro[5] because fragmented financial markets impede the smooth and uniform transmission of its monetary policy across member countries. In order to monitor euro area financial integration at a higher frequency during the COVID-19 crisis, a toolkit of high-frequency indicators was developed based on the set of indicators presented in an ECB report on financial integration and structure in the euro area and its statistical annex.[6] The technicalities of this development are presented in Box 1. These high-frequency financial integration indicators are a useful tool for monitoring financial fragmentation and can also be used to illustrate the effects of policy actions in response to the economic downturn.
Euro area policy responses to the crisis were decisive at both the national and supranational levels. This contributed to a rapid reversal of financial fragmentation towards pre-crisis levels by mid-September 2020. The ECB’s prompt monetary policy and supervisory actions provided a first line of defence to soften the disinflationary shock and counteract the adverse effects of financial fragmentation on the effectiveness of its monetary policy (see the top part of Chart 2 for an overview). These responses have taken the form of additional asset purchases through the asset purchase programme (APP) and the new pandemic emergency purchase programme (PEPP), bank lending programmes at highly favourable conditions (targeted longer-term refinancing operations), supervisory measures and coordinated liquidity provision programmes. National fiscal policymakers also reacted immediately throughout the euro area, even in fiscally constrained countries, although the size of fiscal packages varied across countries. In addition, recognising the importance of a centralised crisis response, over the course of the crisis European policymakers have established a variety of pan-European support measures, such as the three safety nets – the temporary SURE scheme (Support to mitigate Unemployment Risks in an Emergency), a loan guarantee scheme by the European Investment Bank (EIB), a new credit line from the European Stability Mechanism (ESM) –, the Next Generation EU fund and the reinforcement of the 2021-2027 Multiannual Financial Framework (MFF) (see Chart 2 for an overview of the European monetary, supervisory and fiscal measures taken). National fiscal measures, which were deployed very rapidly, are not included in this chart. These policies, together with the higher degree of resilience in financial integration achieved through the institutional reforms of the last ten years, have helped to reverse much of the initial sharp fragmentation of financial markets. Financial integration has broadly returned to its pre-crisis levels as of mid-September. This apparent return to the situation before the COVID-19 outbreak, however, is fragile and relies heavily on continued policy support.
Chart 2
Overview of European monetary and fiscal policy measures
(new cases (7-day moving average, thousands))

Sources: ECB, Johns Hopkins via Bloomberg and ECB calculations.
Notes: Various swap and repo lines introduced by the ECB in cooperation with other euro area and non-euro area central banks are not mentioned here. Information on central bank swap and repo lines can be found on the ECB’s website.
The price-based composite indicator of financial integration and its subcomponents suggest that the coronavirus crisis has, broadly speaking, unfolded in four phases. Section 2 describes the developments in financial integration during each of these four phases (see Chart 1 above and Box 1). Phase 1, from 30 January to 25 March 2020, spanned the outbreak of the crisis and the announcement of the PEPP. Phase 2, from 26 March to 7 May, saw increasing economic damage and initial uncertainty regarding a pan-European fiscal response. Phase 3, from 8 May to 21 July, spanned the gradual relaxation of lockdowns and the progress made towards a common European fiscal response and the Next Generation EU decision. Phase 4, from 22 July to 15 September (the cut-off point for this analysis), was a period primarily of maintaining the re-integration achieved through the European monetary and fiscal policy responses during the previous phases. Section 3 concludes the article and provides a cautious outlook. For reasons of space, the international environment and the normalisation of market volatility following policy decisions by other central banks are not discussed here.
It is prudent to mention that the analyses carried out in this article have several limitations. First, owing to the need for high-frequency data, this article is solely focused on price-based measures of financial integration. These capture discrepancies in asset prices across countries and sectors, as opposed to quantity-based measures, which are based on cross-border holdings of different asset classes and usually have a lower frequency of observation. Second, many of our indicators do not control for fundamentals, including firm or country risks. Similarly, particularly in crisis situations, financial markets might act upon forward-looking expectations and significantly overreact to news signalling changes in fundamentals: such changes in general risk attitudes in markets are also not accounted for in this article. Third, the analysis of causal relationships, or counterfactuals, is beyond the scope of this article. Thus, the article offers only a partial perspective of the events which have unfolded during the coronavirus crisis; a more complete assessment of the state of financial integration and structural developments in the euro area financial system would require additional analysis. Despite these limitations, the analysis of the high-frequency indicators in this article provides useful insights into the development of euro area financial integration during this period.
Box 1 High-frequency financial integration indicators within a real-time monitoring toolkit
Analysing the impact of the coronavirus (COVID-19) crisis on financial integration requires an agile and comprehensive real-time monitoring toolkit. The aim of this box is therefore to describe the development of the high-frequency price-based financial integration indicator and to introduce the high-frequency monitoring toolkit.
To develop such a toolkit, the available financial integration indicators were reviewed to identify those which could be updated at a sufficiently high frequency. From the large set of indicators from the ECB’s report on financial integration and structure in the euro area[7] and its Statistical annex[8] a subset was selected focusing on the coverage of the most relevant financial market segments. Most of the selected indicators relate to the price-based dimension of financial integration, given their instant reaction to incoming news. However, a few quantity-based indicators were also included.
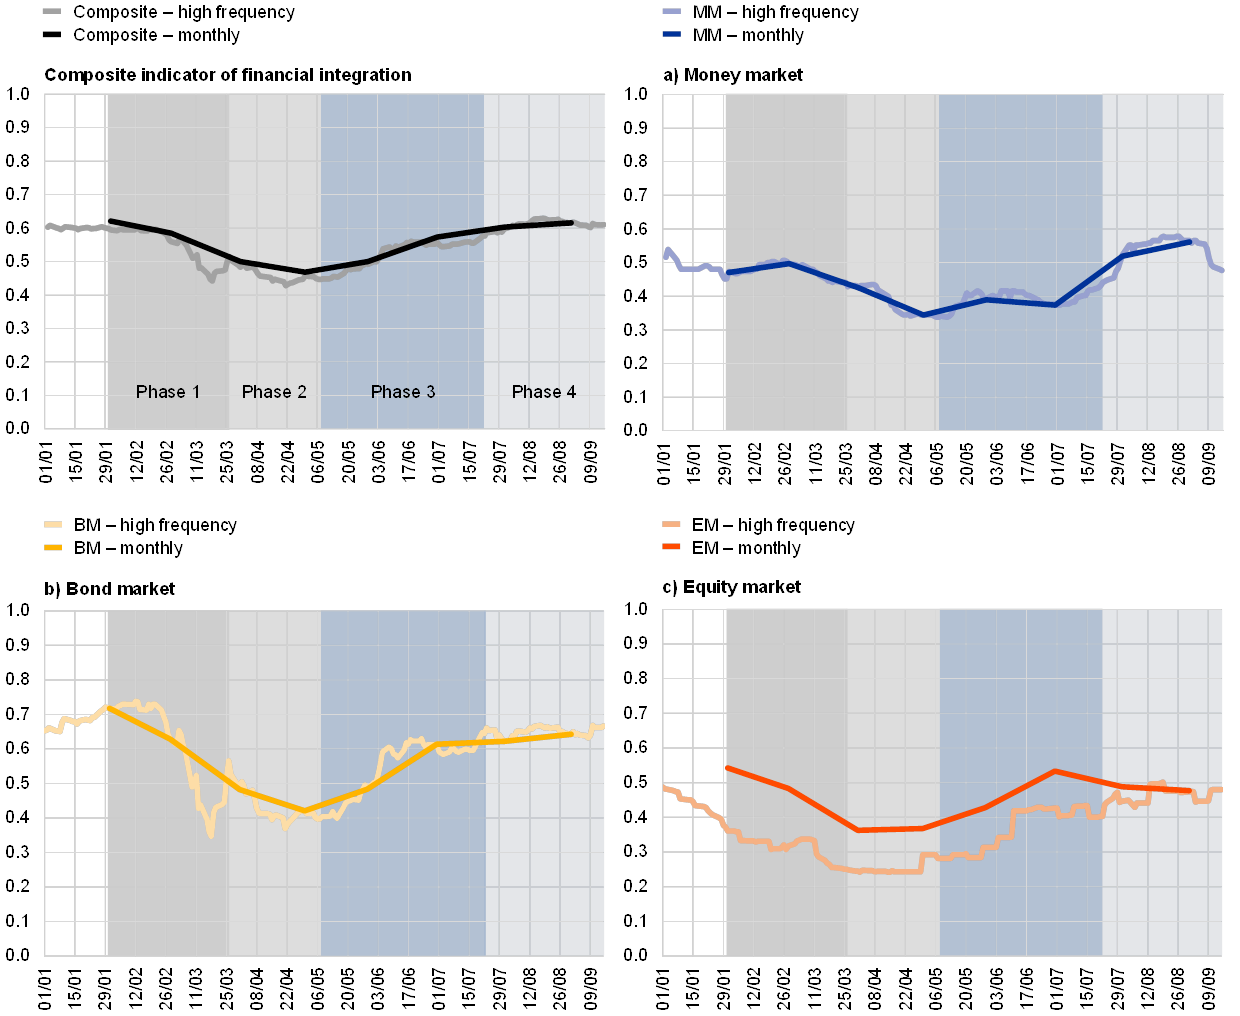
The law of one price, which implies that assets that are similar in terms of risk and return should have the same price, is a cornerstone of price-based financial integration. Against this background, the monthly price-based composite indicator of financial integration developed by Hoffmann et al.[9] measures such integration by examining cross-country dispersion of returns in four market segments, namely the money market (MM), bond market (BM), equity market (EM) and banking market. Many other indicators of financial integration focus on a specific market segment, but this indicator offers a synthetic and unique measure by merging data from different financial market segments. However, it does not account for different risks across countries. In addition, the monthly observation frequency of the price-based composite indicator posed a challenge with regard to timely analysis of financial integration. Owing to the lag in data availability and the small number of observations in each year, it is difficult to link trends in financial integration to certain events using this indicator. For this reason, developing a higher-frequency version of the price-based composite indicator appears useful.
For the money, bond and banking markets, dispersion is calculated by taking the cross-country standard deviation of interest rates, while for the equity market segment two other indicators are calculated, namely EM1 and EM2. EM1, developed by Bekaert et al.,[10] draws on the idea that the earnings yields of the same industries should be similar across countries in a well-integrated market. EM2, based on the work of Adjaouté and Danthine,[11] points to the convergence of the country and sector effects in equity portfolios in financially integrated markets, where investors have the ability to diversify their equity portfolios optimally. Higher-frequency input data are available for all market segments except the banking market. Daily data can be used for the money and bond markets and for a sub-index (EM2) of the equity market component. Data for the other sub-index of the equity market (EM1) is available weekly, while the banking markets data will have to be calculated on a monthly basis.
The high-frequency price-based composite indicator is constructed with a view to achieving the greatest possible congruence between high-frequency and low-frequency data. The input measures have been treated according to the monthly methodological transformations used by Hoffmann et al.[12] Instead of monthly data, daily data are used for BM and EM2 and weekly data are used for EM1, while for MM a 1-month trailing daily average is used. A further step for EM2 involves the recursive application of the Hodrick-Prescott filter on a series consisting of past monthly observations complemented with the latest daily observations. This allows the derivation of a smoothed daily EM2 value.
The high-frequency input measures are further transformed in order to combine them into a composite indicator, once again following the procedures used for the monthly composite indicator. However, this means that historical monthly cumulative distribution functions are used for the evaluation of the daily input measures. The procedure for calculating the monthly composite involves normalisation based on the input measures’ empirical cumulative distribution function, adjusting wherever necessary for the direction so that a higher value would indicate a higher level of financial integration, and finally scaling the measures for benchmarking to an unobserved state of perfect integration. Using the monthly cumulative distribution function for a full history, the high-frequency indicators are calculated for the period since the beginning of 2020 by mapping them onto the corresponding distributions of the lower-frequency indicators. Along with the banking market indicator, the transformed input measures constitute the subcomponents of the high-frequency composite indicator for the selected financial market segments (see Chart A).
Chart A
The composite indicator and its subcomponents at a lower and higher frequency over various phases of the COVID-19 crisis
(daily data; 1 January 2020 to 15 September 2020)
Sources: ECB, Refinitiv and ECB calculations.
Notes: The banking market observation from the previous month is carried over in aggregating of the composite indicator. The four phases correspond to those described in Table 1.
Together, the high-frequency subcomponents and the monthly indicator for the banking market are combined into a high-frequency composite indicator. The composite is calculated as a market size-weighted average of the four subcomponents.[13] It thus offers an aggregate daily indicator on financial integration in the euro area. The new indicator enables financial integration to be tracked on a daily basis throughout the crisis (see Chart B).
Chart B
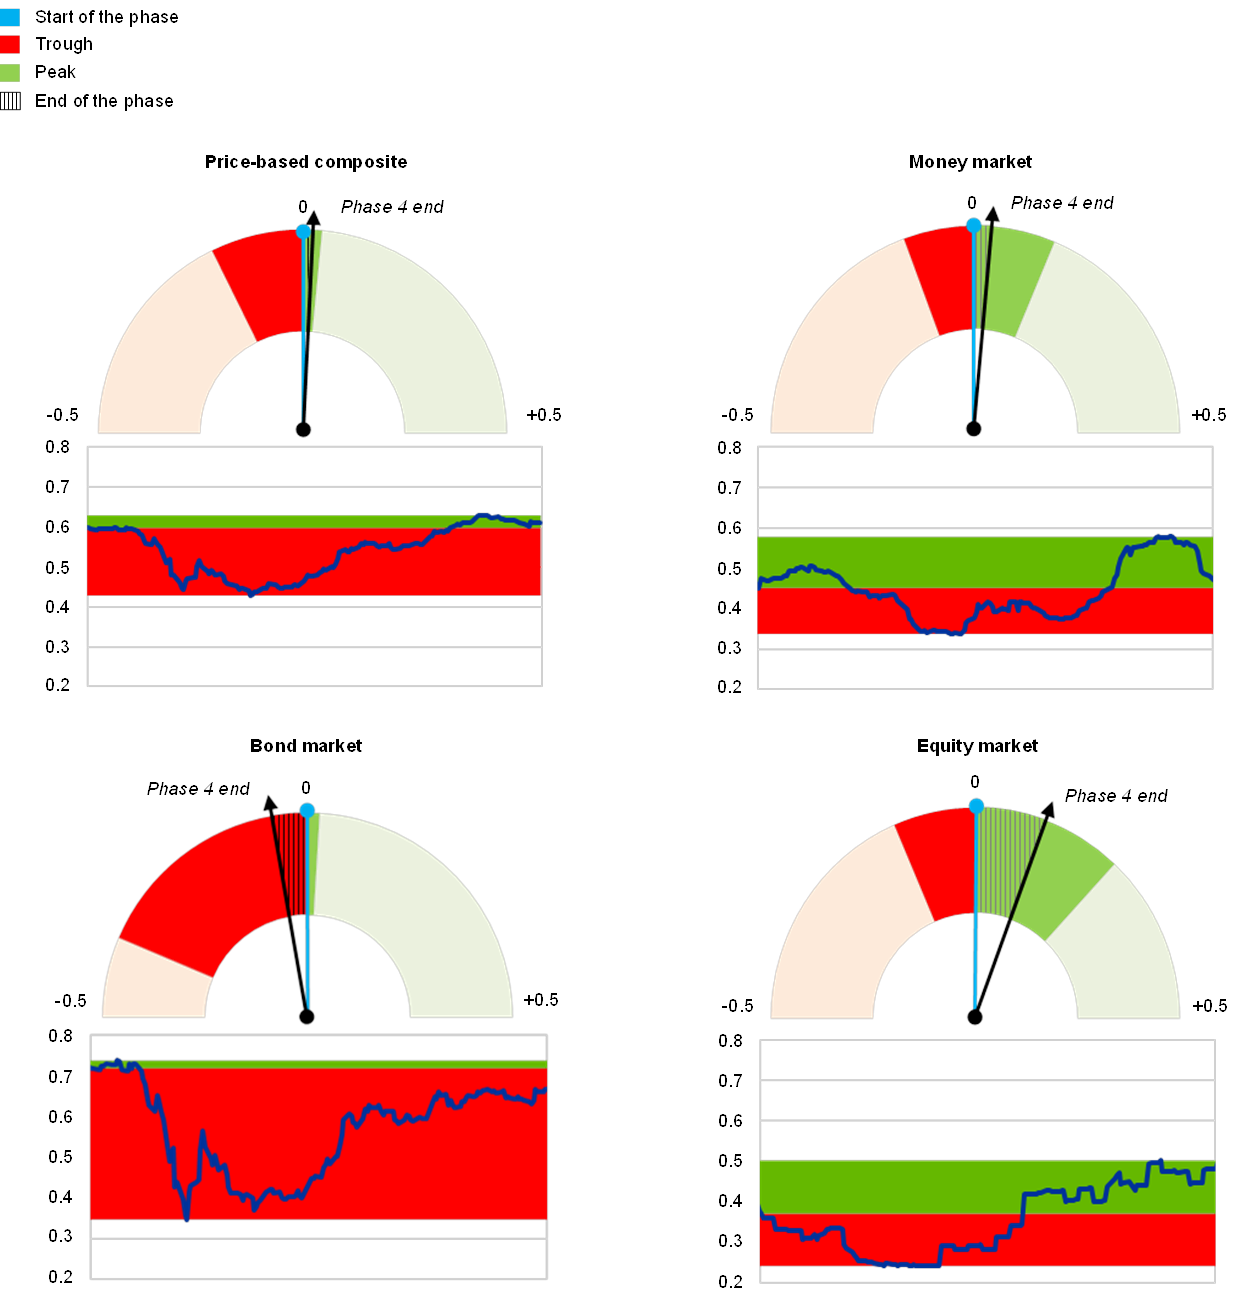
Price-based composite indicator of financial integration and its subcomponents since the onset of the COVID-19 crisis – dashboard view
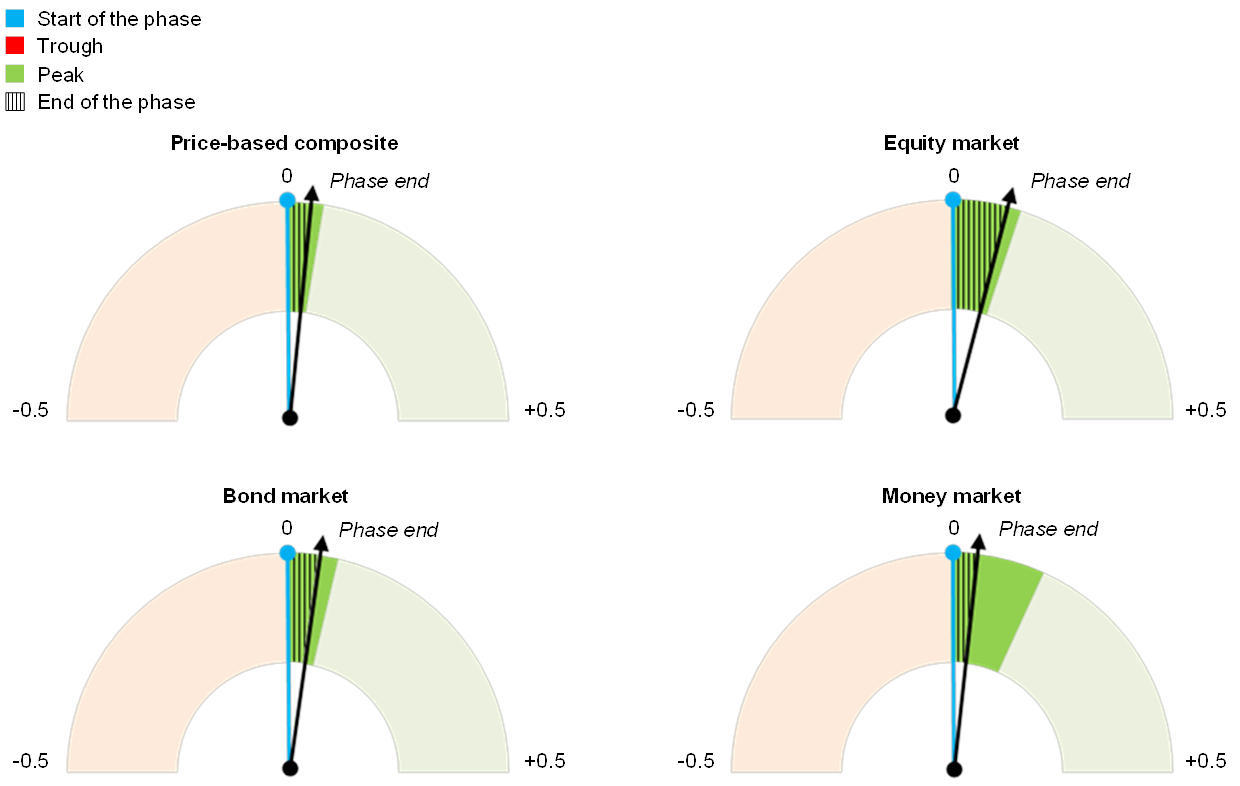
(changes in indicator levels; indicator levels are bound between zero (full fragmentation) and one (full integration).
The dashboard charts depict two extreme swings of the indicators’ levels (from the starting date to the peak and from the starting date to the trough) and the change from the starting date to the last observation within the analysed crisis period. The starting date is marked in blue, the positive swing to the peak is marked in green, and the negative swing to the trough is marked in red. The change in the level of the indicators at the end of the phase with respect to the starting date is marked with a black line; the lined area between the start and end points is coloured red or green depending on whether the level decreased or increased respectively.
Source: ECB calculations.
Notes: The data cover the period from 30 January to 15 September 2020. For more information on the price-based composite indicators, see Hoffmann, P. et al., op. cit.
Besides the price-based composite indicator shown above, the toolkit comprises several other high-frequency statistical indicators. For example, in order to gain further insights into money market developments, the toolkit includes a new dispersion indicator for money markets. The indicator is based on the work of Duffie and Krishnamurthy[14] and focuses on the very short-term unsecured (euro overnight index average (EONIA) and euro short-term rate (€STR[15])) and secured (repo country-level) money markets.[16] In a frictionless market dispersion should be low and stable, while increased dispersion levels may signal limited pass-through efficiency of monetary policy. For the sovereign and corporate segments of the bond market, the toolkit includes both the level and dispersion of spreads or yields at different maturities. Corporate bond indices are monitored for financial and non-financial sectors across countries. Investment-grade corporate bonds are mostly monitored with a view to capturing the financial integration trends in this highly liquid and investible market segment, as well as demonstrating the importance of corporate liquidity and solvency in an environment of widespread lockdowns, and the potential re-emergence of the sovereign-bank nexus. To deepen the cross-country analysis of the government sector, the toolkit further includes daily credit default swap (CDS) premia and a market assessment of redenomination risk premia, although these are not covered in this article.
2 Financial integration during the four phases of the crisis
This section documents how the coronavirus crisis strained the resilience of euro area financial integration during each of the four phases set out in Table 1. The time frames chosen are meant to highlight the salient characteristics of the four phases of the major events which took place.
Table 1
The four phases of the COVID-19 crisis

Phase 1: COVID-19 outbreak and the ECB’s stabilisation measures
The first phase of the crisis spanned the period from 30 January to 25 March 2020. This phase was characterised by the COVID-19 outbreak and the ECB’s stabilisation measures.[17]
Following the outbreak of the coronavirus, initial “alarm-bells” were sounded by the CISS (see Chart 1). Over the course of February the coronavirus spread rapidly throughout the euro area and on 17 February the Eurogroup finance ministers listed the coronavirus outbreak as a new downside risk to economic growth. The first major local lockdown occurred in the Lombardy region in Italy on 23 February. A national lockdown followed on 9 March. Strict containment measures were also enacted in other euro area countries in the ensuing weeks.[18]
The rapid spread of the coronavirus and the ensuing containment measures in the first quarter of 2020 had a strong impact on financial markets, leading to sharp fragmentation. Signs of financial fragmentation in the euro area emerged in February and gained pace in early March. The CISS for the euro area increased sharply to levels last seen during the GFC and the euro area SDC (see Chart 1). Thereafter, the price-based composite indicator of financial integration signalled rising fragmentation in the euro area during this initial phase, with bond markets being the most affected segment (see the dashboard in Chart 3). Between the end of January and mid-March, the price-based composite indicator fell by roughly 25%. This constituted the fourth-largest decline in this indicator since the introduction of the euro. This strong negative correlation between systemic risk and financial integration was also observed during the GFC and SDC.
Chart 3
Financial integration developments in Phase 1 – dashboard view
(changes in indicator levels; indicator levels are bound between zero (full fragmentation) and one (full integration))
Source: ECB calculations.
Notes: Phase 1 refers to the period from 30 January to 25 March 2020. See Chart B for a more detailed description of the chart. For more information on the price-based composite indicators, see Hoffmann, P. et al., op. cit.
In the sovereign bond market, spreads diverged rapidly on the back of sharp downward revisions to the economic and financial outlook paired with extreme uncertainty. Deteriorating fundamentals drove up expectations of large fiscal burdens resulting from public support to firms and households, potential tax shortfalls and pre-existing differences in fiscal space. At the same time, the global financial system was put under extraordinary strain, and stress in the operation of debt markets resurfaced. There was an abrupt rebalancing of portfolios in the direction of greater liquidity and lower leverage. This stoked the risks of forced fire sales in many asset markets, as well as illiquidity spirals and market freezes.[19] In order to limit self-fulfilling overshooting dynamics and the associated risks to financial stability, central banks initiated new types of liquidity provisions and asset purchases. These policy measures are discussed in more detail below. The divergence in sovereign spreads could be seen at both short and long maturities (see Chart 4) and was driven by more vulnerable member countries with less fiscal space. For 10-year sovereign spreads, the increase was most notable for Italy, which saw its spread rise from 132 basis points on 17 February to 281 basis points on 17 March. In terms of levels, however, sovereign spreads stayed well below the peaks of the SDC in 2011-12. In the earliest stages of the crisis, spread dynamics were consistent with flight-to-quality capital flows into German safe assets, which pushed German yields down further (see Chart 5).
Chart 4
Cross-country standard deviation of sovereign bond spreads vis-à-vis Germany from 30 January to 15 September 2020
(percentage points; daily data)

Sources: Refinitiv and ECB calculations.
Notes: The shaded areas mark the four phases of the crisis as defined in Table 1. For a detailed list of the events shown as numbered lines in this chart, please see the Notes to of Chart 1.
Chart 5
10-year sovereign bond spreads vis-à-vis German 10-year yield from 30 January to 15 September 2020
(percentage points; daily data)
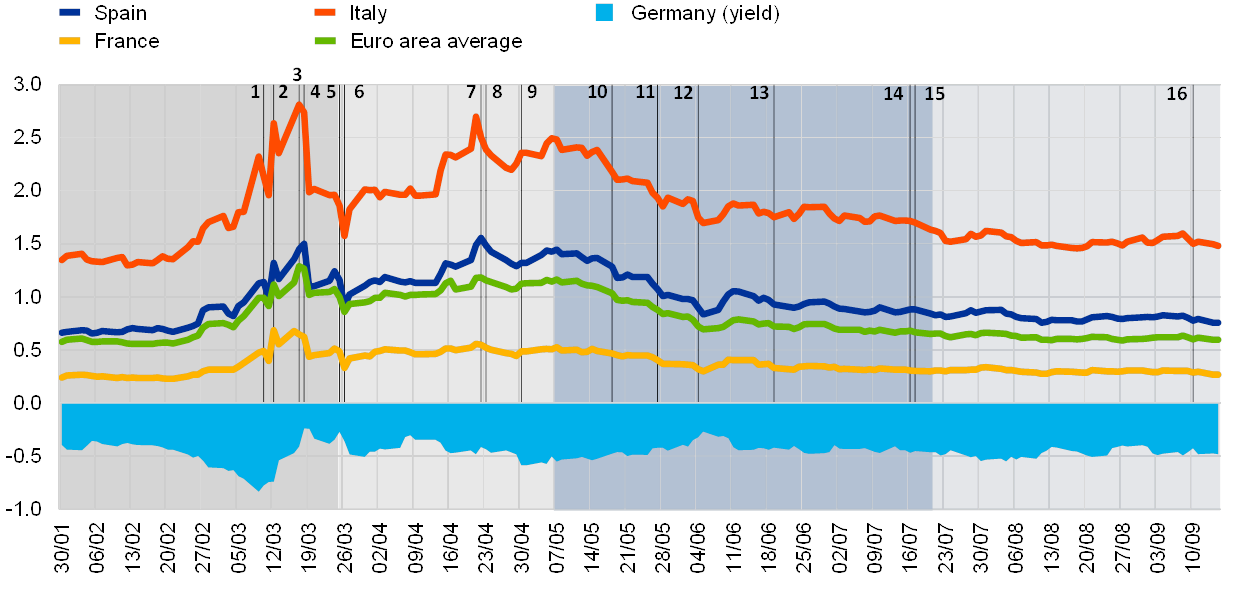
Source: Refinitiv and ECB calculations.
Notes: The shaded areas mark the four phases of the crisis as defined in Table 1. For a detailed list of the events shown as numbered lines in this chart, please see the Notes to Chart 1.
At the beginning of the COVID-19 crisis, corporate bond markets showed dynamics similar to those of their sovereign counterparts. Both financial and non-financial corporate bond yields across major euro area countries more than quadrupled between mid-February and mid-March (see Chart 6). While the uniform increase in corporate bond yields suggests that the pandemic and the resulting containment measures were a common risk to the viability of all euro area firms, the same time period also witnessed significant divergence in yields, with the standard deviation of financial and non-financial corporate bond yields increasing nearly fourfold and threefold respectively between 18 February and 23 March. In particular, the diverging corporate bond yields of Italian financial corporations were consistent with a re-emergence of the sovereign-bank nexus. There was also a sovereign-insurance companies and pension funds nexus, but this is not discussed here.
Chart 6
Corporate bond yields from 30 January to 15 September 2020
a) Financial corporate bond yields
(percentage points; daily data)
Sources: IHS Markit iBoxx and ECB calculations.
Notes: The shaded areas mark the four phases of the crisis as defined in Table 1. For a detailed list of the events shown as numbered lines in this chart, please see the Notes to Chart 1.
b) Non-financial corporate bond yields
(percentage points; daily data)

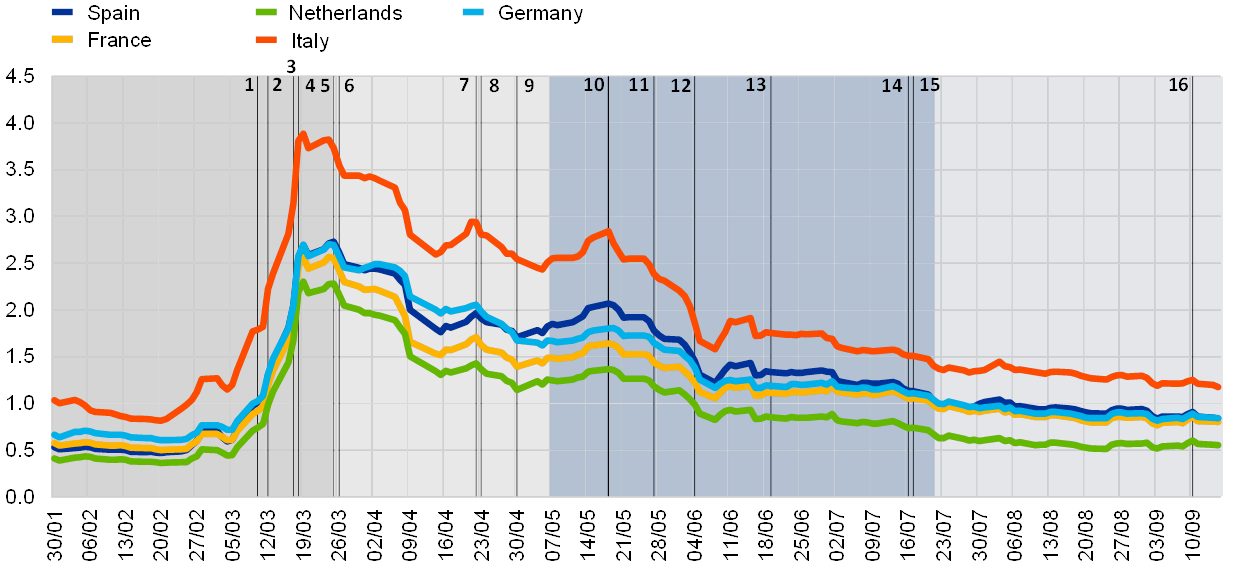
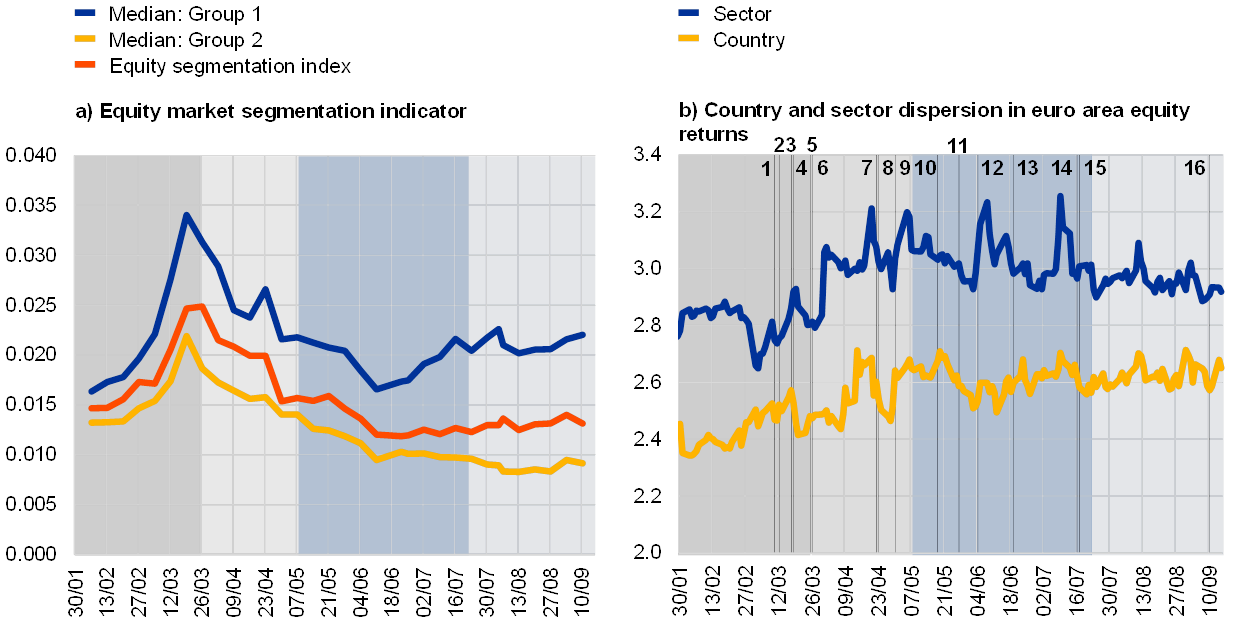
Equity market fragmentation also increased sharply during the first phase of the crisis (see Chart 7, left panel). This reflects the contraction of economic activity across member countries, including the global stock market crash in the last week of February. However, equity market segmentation was more pronounced in the Group 1 countries, which have smaller economies and less liquid equity markets than the Group 2 countries, which have deeper equity markets (see, respectively, the blue and yellow lines in the left panel of Chart 7).
Chart 7
Equity market fragmentation from 30 January to 15 September 2020
(weekly data (panel a) and daily data (panel b))
Sources: Refinitiv and ECB calculations.
Notes: In the left panel, Group 1 consists of Belgium, Ireland, Greece, Finland and Austria (small countries with relatively less liquid equity markets); Group 2 consists of Germany, Spain, France, Italy, the Netherlands and Portugal (larger countries with relatively more liquid equity markets). For a technical description of the indicators, please see Chart 13 (for the left panel indicator) and Chart 10 (for the right panel indicator) in the Statistical annex of the ECB’s March 2020 report on “Financial integration and structure in the euro area”. The shaded areas mark the four phases of the crisis as defined in Table 1. For a detailed list of the events shown as numbered lines in this chart, please see the Notes to Chart 1.
The ECB announced a comprehensive set of measures between mid-March and end-March. Their aim was to stabilise markets, protect the supply of credit to the economy and neutralise disinflationary developments stemming from the pandemic (see Chart 2). These included temporary capital and operational relief for banks, lending to European banks at negative interest rates, and the PEPP,[20] which made €750 billion available for security purchases by the end of 2020 (see Chart 2). The PEPP represents a temporary and flexible asset purchase programme of private and public sector securities to counter financial fragmentation and help stabilise the euro area economy in order to ensure the smooth transmission of monetary policy across countries. These measures helped to halt and partially reverse the divergence of bond yields in both the corporate and the sovereign bond markets.[21]
Despite the market tensions, the improvements in euro area governance and institutional infrastructure since the GFC helped to limit fragmentation. A legacy of the GFC and euro area SDC has been the overhaul of euro area governance and institutional infrastructure with the launch of the ESM and, some years later, the Single Supervisory Mechanism (SSM), among other things. During the COVID-19 crisis, in its capacity as single supervisor, the ECB was able to act in a swift and coordinated manner with respect to banks. The new institutional architecture introduced following the GFC and SDC helped to contain fragmentation. In fact, even during the extreme market volatility seen at the peak of the crisis during Phase 1 and before the PEPP announcement, fragmentation increased much less dramatically than during the GFC and SDC from 2008 to 2012.
Phase 2: Increasing economic damage and uncertainty regarding the European fiscal response
The second phase of the crisis spanned the period from 26 March to 7 May 2020. This phase was characterised by extensive economic and financial damage and the initial challenges of formulating a common European fiscal response to add to national fiscal initiatives.[22]
In this phase, the pandemic had uneven effects across financial market segments. The data from the subcomponents of the price-based composite indicator suggest that equity markets were the only market segment for which financial integration rebounded during the second phase, as it continued to recede in other market segments (see Chart 8). This re-integration occurred across both more and less liquid equity markets (see Chart 7, left panel) and illustrates the apparent “disconnect” between real economic developments (the outlook was worsening rapidly according to macro and survey data) and equity market performance during the crisis.[23] However, the dispersion and volatility of forecast equity index returns remained heightened throughout Phases 2 and 3, especially across sectors. This is consistent with the development of equity market volatility. Option-implied equity market volatility rose sharply during the first phase of the crisis to levels last seen at the height of the GFC. It has since receded, but remains above its levels prior to the COVID-19 crisis. Cross-country and sectoral dispersion in euro area equity returns both rose, yet reassuringly the former remains below the latter, signalling that companies have continued to benefit from sectoral and geographic diversification even during the crisis (see Chart 7, right panel)
Chart 8
Financial integration developments in Phase 2 – dashboard view
(changes in indicator levels; indicator levels are bound between zero (full fragmentation) and one (full integration)) Source: ECB calculations.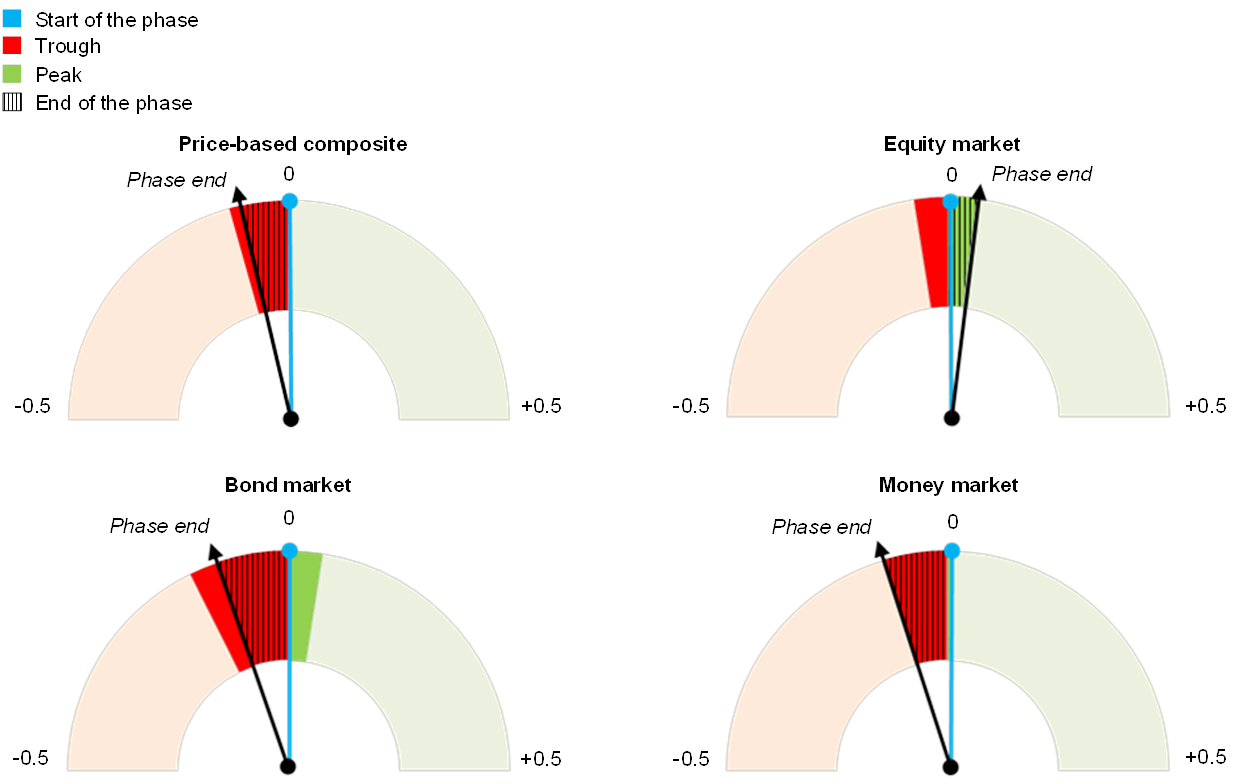
Notes: Phase 2 refers to the period from 26 March to 7 May 2020. See Chart B for a more detailed description of the chart. For more information on the price-based composite indicators, see Hoffmann, P. et al., op. cit.
The different evolutions of equity and sovereign bond markets, furthermore, suggest some degree of “disconnect” between equity and fixed income markets throughout this phase of the crisis. While equity market integration improved in Phase 2, sovereign bond markets in particular lost much of the integration impetus obtained from the PEPP. The levels and cross-country dispersion of sovereign bond spreads increased sharply. These dynamics came to a halt only following the ECB’s decision on 22 April to “freeze” sovereign ratings for its collateralised lending operations and the fourth European Council meeting, which led to the agreement of a first common European fiscal package, consisting of three safety nets: the ESM, EIB, and SURE funds.
The agreement on the €540 billion safety net marked a breakthrough for the pan-European fiscal response to the COVID-19 crisis. The agreement on a three-pronged safety net during the fourth dedicated European Council meeting on 23 April was a major step in the formulation of a common European fiscal response. This safety net comprises the €100 billion SURE instrument, a €200 billion pan-European guarantee fund for loans to companies by the EIB and a €240 billion pandemic crisis support credit line by the ESM. Furthermore, during this meeting the European Council tasked the European Commission with developing a proposal for a European crisis recovery fund, even though diverse views remained regarding the make-up of such a fund in terms of the distribution of grants and loans. In retrospect, the policy discussions that took place at the earlier European Council meetings on this topic were necessary for reaching consensus on the above safety nets and ultimately to agree on the Next Generation EU fund, which had many of the desired effects on financial integration.
These positive signs of progress towards a common European fiscal response to the pandemic supported market confidence and marked a turning point in overall financial integration (see Chart 1). They revived the re-integration trend in sovereign and corporate bond markets set in motion by the PEPP and other monetary and financial stability measures (see Chart 2). Other measures that have contributed to this re-integration of financial markets were the ECB’s decision on 22 April to “freeze” ratings for its collateralised lending operations, i.e. to uphold the eligibility of marketable assets that fulfilled minimum credit quality requirements in the event of a deterioration in credit ratings.[24]
Phase 3: Relaxation of lockdowns and the Next Generation EU fund
The third phase of the crisis spanned the period from 8 May to 21 July 2020. This phase was characterised by a gradual relaxation of lockdowns and the agreement on the Next Generation EU fund.[25]
The third phase of the crisis saw several events that supported financial integration. These events include the Franco-German and European Commission proposals for an EU Recovery Fund, a gradual relaxation of lockdowns, a larger-than-expected €600 billion expansion of the PEPP purchase envelope and eventual agreement on the Next Generation EU recovery fund. The subcomponents of the price-based composite indicator point to positive financial integration developments across markets during this phase (see Chart 9).
Chart 9
Financial integration developments in Phase 3 – dashboard view
(changes in indicator levels; indicator levels are bound between zero (full fragmentation) and one (full integration))

Source: ECB calculations.
Notes: Phase 3 refers to the period from 8 May to 21 July 2020. See Chart B for a more detailed description of the chart. For more information on the price-based composite indicators, see Hoffmann, P. et al., op. cit.
Financial integration improved across market segments against the background of a mixed data flow. On the one hand, new data during this phase showed declining COVID-19 infections and slowing death rates, which led to the gradual relaxation of European containment measures. On the other hand, data show historically negative economic growth and downward forecast revisions. In this environment, the Franco-German proposal on 18 May for a €500 billion fund of grants and the European Commission’s Next Generation EU proposal on 27 May for €750 billion of grants and loans (both funded through the EU budget) led to sizeable reductions and some material reconvergence of sovereign spreads and corporate yields, notably for vulnerable countries (see Charts 4, 5 and 6). These positive developments were further reinforced by the decision of the ECB’s Governing Council on 4 June to increase the size of the PEPP by €600 billion (to a total of €1,350 billion) and to extend the programme’s reinvestment period at least until the end of 2022.
The joint European fiscal response is a milestone which reinforces financial integration. The calming effects of these proposals in underpinning the European recovery (along with other parallel factors) are also reflected in euro area corporate bond yields, though with some delay for non-financial corporate bond yields. Depending on the country considered, most or all of the yield increases observed by the end of April/early May had been corrected by late May. The different sizes of the corporate bond markets in different euro area countries − both in absolute terms and relative to the countries’ respective economies − may explain some of the bond yield and fragmentation developments.[26]
The end of this phase was marked by the agreement on the EU Recovery and Resilience Facility – under the Next Generation EU fund proposal – and the 2021-27 MFF. The agreement resolved part of the uncertainty around a common European fiscal response[27] and had an immediate positive effect on financial integration across a broad set of markets, most notably sovereign and corporate bond markets. It thus reinforced the positive integration developments following the Franco-German and European Commission proposals in May.
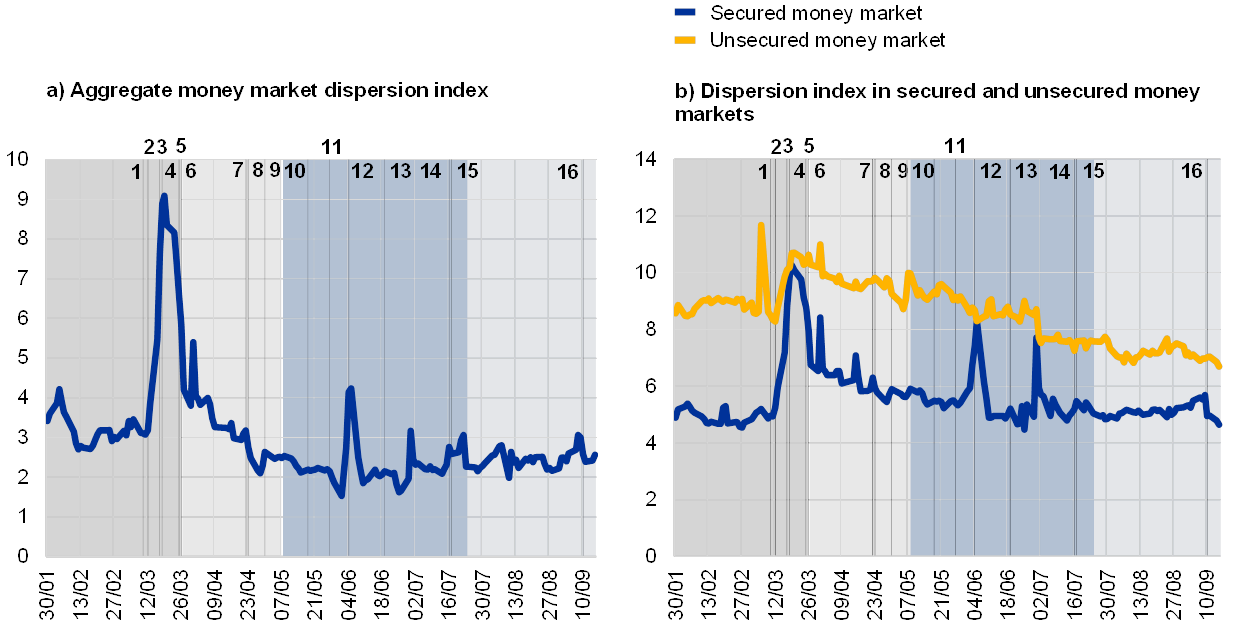
There was less fragmentation in money markets than in other financial market segments. While money markets had been exhibiting some signs of fragmentation since the start of Phase 1 and well into Phase 2 − albeit to a lesser degree than other markets − indicators for the money market segment started falling to lower dispersion levels in late April 2020 (see the left panel of Chart 10). The different lending operations and the adjustments to lending criteria and eligible collateral supported a gradual reduction of dispersion, in particular for unsecured money market rates such as the €STR. The dispersion of secured money market rates spiked around key dates in the coronavirus crisis on account of flight-to-quality dynamics or around futures delivery dates owing to collateral scarcity. In early May 2020 it again approached pre-crisis levels, where it broadly continued to fluctuate (see right panel of Chart 10).
Chart 10
Money market integration from 30 January to 15 September
(daily data)
Sources: ECB and ECB calculations.
Notes: For technical details on the construction of this indicator, see Corradin, S. et al., op. cit. For a detailed list of the events shown as numbered lines in this chart, please see the Notes to Chart 1.
Phase 4: Sustained signs of financial normalisation
The fourth phase of the crisis spanned the period from 22 July to 15 September and was characterised by an improvement in measured financial integration across a wide range of indicators.[28]
Chart 11
Financial integration developments in Phase 4 – dashboard view
(changes in indicator levels; indicator levels are bound between zero (full fragmentation) and one (full integration))
Source: ECB calculations.
Note: Phase 4 refers to the period from 22 July to 15 September 2020. See Chart B for a more detailed description of the chart. For more information on the price-based composite indicators see Hoffmann, P. et al., op. cit.
The broad-based improvement in financial integration continued during this phase. The data from the price-based composite indicator and its subcomponents suggest that throughout this phase of the crisis, the agreement on the EU Recovery Fund and the MFF continued to have a positive impact on the level of financial integration. Indeed, the composite indicator recovered to its pre-crisis levels at the end of August (see Chart 1). The continuing re-integration trend in European financial markets is also illustrated, for instance, by the decline in the level and dispersion of 10-year sovereign spreads throughout the fourth phase of the crisis (see Chart 5). Furthermore, the corporate bond market showed a continued downward trend towards levels last observed in March 2020, driven also by low primary market activity and relatively low market liquidity over the summer period.
The current stabilisation and apparent return to the situation before the COVID-19 outbreak, however, calls for several qualifications. The return of financial integration measures towards pre-crisis levels has to be seen against the background of the substantial amount of monetary and fiscal stimulus on which it relies and which is essential for its sustainability. Although some of the uncertainty has been resolved following the agreement on a European recovery instrument, substantial uncertainty about the post-crisis economic recovery remains, in particular in view of a renewed increase in infection rates across European countries, which raises the possibility of a new round of lockdown measures, and the pending ratification of the Next Generation EU fund in national parliaments.
3 Conclusion
This article has presented a set of high-frequency indicators to monitor developments in financial integration during the COVID-19 crisis. The article focuses on a price-based composite indicator of financial integration and its subcomponents for the money, bond, equity and banking markets. An original contribution of this article is to transform them – with the support of big data techniques – so that they give higher-frequency observations. The high-frequency monitoring toolkit presented here is based on analysis conducted at the ECB and in the Eurosystem. It includes new high-frequency indicators for the money market along with various indicators tracking sovereign and corporate bond markets. This toolkit is flexible and can be expanded over time.
The data from these high-frequency financial indicators can be used to track the unfolding of the COVID-19 crisis and interpret the effects of monetary, fiscal and financial policy responses from the viewpoint of euro area financial integration. The indicators suggest that the most significant challenge for the resilience of financial integration in the euro area came in the initial phases of the COVID-19 crisis. The onset of the crisis was especially severe in terms of fragmentation developments, especially prior to the PEPP announcement. Thereafter, sustained signs of financial re-integration emerged as progress was made on a joint European fiscal response, highlighting the powerful effects of monetary and fiscal policy coordination in weathering economic crises.
A nuanced picture emerges when cross-checking the price-based composite indicator of financial integration against the segment-specific indicators. The composite indicator of financial integration shows a trough in mid-April 2020 – but by mid-August 2020 surpasses the levels seen prior to the coronavirus crisis. However, such re-integration is not observed in all market segments; nor do all euro area countries benefit from it to the same degree. Money markets have been a strong contributor to the rebound of price-based financial integration to early 2020 levels. For both sovereign and corporate bond markets, the re-integration trend stabilised as late as August 2020, and integration only returned to pre-crisis levels towards the end of the reporting period. Equity market integration displays diverging paths across countries and has picked up slightly compared with early July 2020, but remains around pre-crisis levels.
At present, the re-integration of euro area financial markets is still fragile and uneven, and the gradual return to the situation before the COVID-19 outbreak relies on the unprecedented amount of monetary and fiscal stimulus in place. While many indicators of financial integration show an improvement throughout the third and fourth phases of the crisis, this re-integration trend is subject to the risk of further waves of infections and renewed lockdown measures.
- It has been shown that a supply shock affecting sectors asymmetrically can generate a contraction in demand larger than the initial shock if the interrelation between sectors is strong enough. See Guerrieri, V., Lorenzoni, G., Straub, L. and Werning, I., “Macroeconomic Implications of COVID-19: Can Negative Supply Shocks Cause Demand Shortages?”, NBER Working Paper, April 2020. For the United States, both demand and supply shocks were a factor in the COVID-19 crisis. See Brinca, P., Duarte, J.B. and Faria-e-Castro, M., “Measuring Labor Supply and Demand Shocks during COVID-19”, Working Paper, No 2020-011D, Federal Reserve Bank of St. Louis, May 2020.
- See the European Centre for Disease Prevention and Control’s COVID-19 timeline.
- From Hoffmann, P., Kremer, M. and Zaharia, S., “Financial integration in Europe through the lens of composite indicators”, Working Paper Series, No 2319, ECB, Frankfurt am Main, September 2019.
- See, for instance, Buti, M., “A tale of two crises: Lessons from the financial crisis to prevent the Great Fragmentation”, VoxEU, July 2020; also de Guindos, L., “Financial stability and the pandemic crisis”, Speech at the Frankfurt Finance Summit, June 2020.
- For the ECB, the market for a given set of financial instruments and/or services is fully integrated if all potential market participants share the following relevant characteristics: (1) they face a single set of rules when they decide to make transactions in those financial instruments and/or services; (2) they have equal access to the above-mentioned set of financial instruments and/or services; and (3) they are treated equally when they are active in the market. For further reference, see Baele, L. et al., “Measuring financial integration in the euro area”, Occasional Paper Series, No 14, ECB, Frankfurt am Main, April 2004.
- See “Financial integration and structure in the euro area”, ECB, Frankfurt am Main, March 2020, as well as the accompanying Statistical annex.
- See “Financial integration and structure in the euro area”, ECB, Frankfurt am Main, March 2020.
- See the Statistical annex of “Financial integration and structure in the euro area”, ECB, Frankfurt am Main, March 2020.
- Hoffmann, P., Kremer, M. and Zaharia, S., “Financial integration in Europe through the lens of composite indicators”, Working Paper Series, No 2319, ECB, Frankfurt am Main, September 2019.
- Bekaert, G., Harvey, C.R., Lundblad, C.T. and Siegel, S., “What Segments Equity Markets?”, Review of Financial Studies, Vol. 24, No 12, 2011, pp. 3841-3890.
- Adjaouté, K. and Danthine, J.P., “European Financial Integration and Equity Returns: A Theory-based Assessment”, in Gaspar, V. et al. (eds.), Second ECB Central Banking Conference: The transformation of the European financial system, ECB, Frankfurt am Main, 2003.
- Hoffmann, P. et al., op. cit.
- Hoffmann, P. et al., op. cit., calculate the weights using the relative average amounts outstanding from the aggregated euro area financial accounts for the base period 1997-2013, with the following results: money markets 17%, bond markets 36%, equity markets 15% and banking markets 32%.
- Duffie, D. and Krishnamurthy, A., “Passthrough Efficiency in the Fed’s New Monetary Policy Setting”, Jackson Hole Symposium of the Federal Reserve Bank of Kansas City, 2016.
- For more information on the €STR and the statement of methodology, see the ECB's website. See also, the box entitled “Goodbye EONIA, welcome €STR!”, Economic Bulletin, Issue 7, ECB, 2019.
- Corradin, S., Eisenschmidt, J., Hoerova, M., Linzert, T., Schepens, G. and Sigaux, J.-D., “Money markets, central bank balance sheet and regulation”, Working Paper Series, No 2483, ECB, Frankfurt am Main, October 2020.
- During this phase, new COVID-19 cases were already receding in China and the rest of Asia, and the epicentre of the pandemic shifted to Europe and the United States. Over the course of March, the total number of confirmed cases in the euro area exceeded the total number of cases in China.
- Spain and France, for instance, ordered nationwide lockdowns on 14 March and 17 March respectively. Germany issued a contact ban and implemented far-reaching lockdown measures on 22 March.
- For further information on the role of cross-border portfolio investment flows in shaping these developments, see, Lane, P., “The market stabilisation role of the pandemic emergency purchase programme”, The ECB Blog, ECB, June 2020.
- The legal documentation for the PEPP was published on 25 March 2020.
- See Lane, P.R., “The ECB’s monetary policy in the pandemic: meeting the challenge”, speech at the 62nd NABE Annual Meeting “Global Reset? Economics, Business, and Policy in the Pandemic”, October 2020.
- This phase was marked by a continuous sharp increase in new cases, with the United States showing the highest rate of growth, while euro area countries started showing signs of improvement. In the following weeks, new confirmed infections started to decline in advanced economies, but continued to rise in emerging market economies.
- See also, Igan, D., Kirti, D. and Martinez Peria, S., “The Disconnect between Financial Markets and the Real Economy”, Special Notes Series on COVID-19, IMF, August 2020.
- For further information on the ECB’s collateral easing policies, see de Guindos, L. and Schnabel, I., “Improving funding conditions for the real economy during the COVID-19 crisis: the ECB’s collateral easing measures”, The ECB Blog, ECB, April 2020.
- During this phase, global COVID-19 infections carried on rising with no signs of stabilisation. Daily new global cases rose to over 200,000 in mid-July, more than double the number at which they had temporarily stabilised in April. At the end of July the total number of COVID-19 cases topped 17 million. Different underlying dynamics were driving these developments, with emerging market economies affected by a constantly rising number of cases. However, at the end of this period, advanced economies including the euro area also experienced a resurgence of COVID-19 cases.
- For example, in absolute terms, France has the largest (and most developed) corporate bond market of all euro area countries, followed by Germany, Italy and Spain. As a share of GDP, however, the German market is smaller than the French, Italian, Dutch or even Spanish markets. The main reason for this is that the segment for non-financial corporations is less developed in Germany than in France or the Netherlands, as German companies still rely more on bank loans. Along with the changing risk environments for companies in the different countries over time, this may explain why German non-financial corporate yields are sometimes the highest among all the countries covered in Chart 6.
- See the box entitled “The fiscal implications of the EU’s recovery package”, Economic Bulletin, Issue 6, ECB, 2020.
- During this phase, the global number of newly confirmed cases continued to increase until the beginning of August. The daily number of cases remained high, exceeding 300,000 by mid-September. New cases were increasing rapidly among advanced economies outside the United States. There was a sharp rise in cases in the euro area, leading to mounting concerns about a second wave.