
Consumption of durable goods in the euro area
Consumption of durable goods in the euro area
Published as part of the ECB Economic Bulletin, Issue 5/2020.
1 Introduction
Trends in households’ purchases of durable goods have important implications for the business cycle, which motivates the need to examine them closely from a monetary policy perspective. First, because of their marked pro-cyclicality, durables can help in tracking – and possibly anticipating – the state of the business cycle in the euro area, thus complementing the signal from other pro-cyclical demand components, such as investment.[1] Second, expenditure on durables can help us better understand cross-country heterogeneity in terms of consumption and saving habits, as well as its drivers. Third, since purchases of durables can be financed using credit, the behaviour of durable goods provides important insights into the state of financing conditions in the economy.
Expenditure on durable goods is a key component of consumption dynamics, despite accounting for a modest share in aggregate household spending. In the two years preceding the coronavirus (COVID-19) pandemic that has affected the European and global economies, annual growth in euro area consumption moderated from the solid rates of expansion observed in 2015-17, partly owing to a decline in spending on durable goods (see Chart 1). Specifically, having provided strong support to the earlier phases of the latest expansion, durables accounted for almost one-third of the overall loss in growth momentum in consumption in 2018-19, despite amounting to less than 10% of its total share.[2]
Chart 1
Developments in private consumption in the euro area
(annual percentage changes and contributions in real terms)

Sources: Eurostat and ECB calculations.
Notes: Non-durables and services also includes semi-durables. The latest observations are for the fourth quarter of 2019.
Consumer durables have specific characteristics that set them apart from other consumption expenditure items. First, a durable good provides utility over multiple periods and (like capital) is subject to depreciation. This allows consumers to postpone purchases in times of economic hardship, while still benefiting from the flow of services from the accumulated stock, and to adjust to the desired level of durables once the economy has recovered.[3] Secondly, the purchase of durables can often be financed using credit and the durables are sometimes eligible for use as collateral, which can make them more exposed to credit conditions and lending rates than non-durables.[4] Finally, changes in the stock of durables may be subject to adjustment costs. This could lead to sluggish and protracted cycles in durable goods expenditure, since the presence of such costs determines “inaction zones” where a consumer finds it optimal not to adjust small differences between the actual and the desired stock of durables.[5] Box 1 provides further details on the statistical features of durable goods consumption data in the euro area.
Box 1 Durable goods consumption data in the euro area: definition, scope and availability
Consumer durables are defined in the European System of Accounts (ESA 2010) as durable goods used by households for final consumption repeatedly over a period of more than one year. In the national accounts they are part of households’ final consumption expenditure.[6] The classification of individual consumption according to purpose (COICOP) is used to allocate consumer goods and services into product subgroups, which for analytical purposes are further aggregated into four main groups showing consumption breakdown by durability – durable goods, semi-durable goods, non-durable goods and services. The difference between non-durable goods and durable goods is based on whether they can be used only once or repeatedly during a period of over one year. Semi-durable goods differ from durable goods in that their expected service life, although over one year, is often considerably shorter and their purchase price lower. Clothing and shoes are examples of semi-durable goods. Services account for more than half of households’ final consumption expenditure. It should be noted, however, that the acquisition of housing and land is not recorded as a consumer durable in the national accounts but as investment, and is therefore not included in the data presented in this box. Instead, the housing services consumed (and produced) by households living in dwellings owned by them (i.e. “owner-occupied housing”) are reflected in household consumption by way of imputed rents. These imputed rents for owner-occupiers contribute significantly to the high share of rents (31.7%) in the consumer expenditure item under services in the national accounts.
Consumer durable goods include furniture and household appliances (including kitchen equipment), personal transport equipment (i.e. vehicles), recreational and entertainment goods (including computers and communications equipment), other goods such as jewellery, clocks and watches, and therapeutic medical appliances and equipment. Households’ expenditure on consumer durables accounts for about 9% of households’ final consumption (based on the “domestic concept”, see below) in the euro area. The major consumer durable items in terms of their relative consumption share within this group are personal transport equipment (about 42.8%), followed by furniture and household appliances (28.3%) and recreational and entertainment goods (17.4%) (see Chart A).
Chart A
Euro area households’ final consumption by consumer goods and services and by groups of consumer durables, in 2018
(percentage of households’ final consumption; percentage of households’ final consumption of durable goods)

Sources: Eurostat and ECB calculations.
Note: Data for consumer durables in Greece refer to 2017.
For presenting household consumption data in the national accounts, the statistical concept of residency is relevant. While households’ total final consumption entering the expenditure side of GDP reflects the “national concept” (i.e. the expenditure of the residents of a country, whether domestically or abroad), the split of durable and non-durable consumption reflects the so-called “domestic concept” of households’ final consumption (i.e. all consumption expenditure in the domestic territory, irrespective of the residency of the consumer). The concept behind the latter approach is the same as that used in the field of consumer price statistics, which, in addition, uses the same consumer expenditure breakdown as the COICOP classification. Combining the two sources also enables the derivation of durable goods expenditure in deflated (volume) terms.
Eurostat’s reporting requirement of national accounts data by durability is different for quarterly and annual data. Quarterly consumer goods data are broken down into durables and others, while the annual statistics provide the durability breakdown of the four above-mentioned main groups. Some euro area countries report the annual breakdown by durability also at a quarterly frequency. Durable goods consumption data are available from 1995 onwards for most euro area countries.[7]
Against this background, this article takes a longer-term perspective to explore stylised facts about expenditure on durables in the euro area and its relevance for business cycle fluctuations. Section 2 describes the characteristics and behaviour of durable goods consumption over the business cycle. Section 3 covers the relevance of financing conditions, including a specific focus on car purchases. Section 4 deals with long-run trends in relative prices and shares of durable goods in consumption. The analysis is complemented by insights from an empirical (structural VAR) model in Section 5, which decomposes consumption growth into structural shock contributions, distinguishing aggregate demand and supply shocks from durable-specific ones, while taking into account monetary conditions.
2 Behaviour and characteristics of durable goods consumption
2.1 Cyclical behaviour of durables
Expenditure on durables tends to be volatile and pro-cyclical, reflecting the specific characteristics of this type of good. As shown in Chart 2, the dynamics of year-on-year durable goods consumption exhibit ample fluctuations, with growth typically exceeding GDP (and non-durable goods consumption) in times of economic expansion and contracting more strongly during recessions. The pro-cyclicality of expenditure on durable goods was particularly pronounced in Italy and Spain during the European sovereign debt crisis. The counter-cyclical behaviour in Germany during the crisis period was affected by the cars component, which benefited from subsidies in the form of vehicle scrappage schemes that were larger than in the other euro area countries and proved to be rather effective.[8] Moreover, the household sector in Germany was more resilient than in other large euro area countries.
Chart 2
Cyclicality of durable goods consumption
(annual percentage changes in real terms)
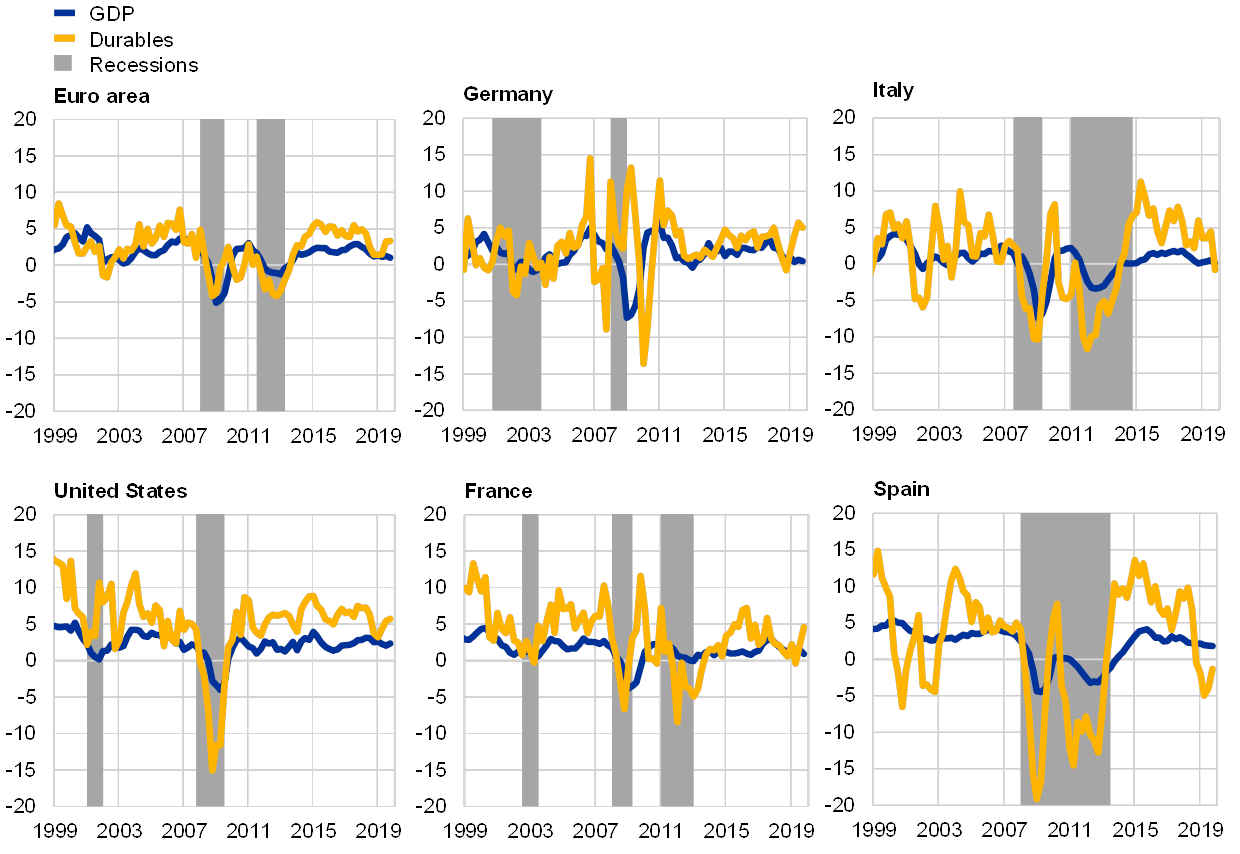
Sources: Eurostat, US Bureau of Economic Analysis, CEPR, NBER, ECRI and ECB calculations.
Notes: Recession dating is based on the NBER (for the United States), the CEPR (for the euro area) and ECRI (for Germany, France, Italy and Spain). The latest observations are for the fourth quarter of 2019.
Given their volatility and pro-cyclicality, durable goods expenditure historically accounts for a relatively large share of the variance in GDP despite its modest size, in particular relative to non-durable goods consumption. Table 1 shows the share of consumption and its components in terms of GDP, and the corresponding share of GDP variance explained. Total private consumption accounts for two-thirds of GDP in the United States and slightly more than one-half in the euro area. However, its overall contribution to the variance of GDP is typically smaller given the smooth behaviour of services, the largest component within non-durable consumption items. By contrast, in France, Italy and Spain, as well as in the United States, durables contribute to a larger share of the variance in GDP growth relative to their size. From that perspective, expenditure on durables bears some resemblance to the characteristics of investment, which, despite its smaller size in aggregate demand, accounts for a disproportionately large share of output fluctuations.
Table 1
Cyclical properties of consumption and its components
(percentage shares and percentage of variance explained)
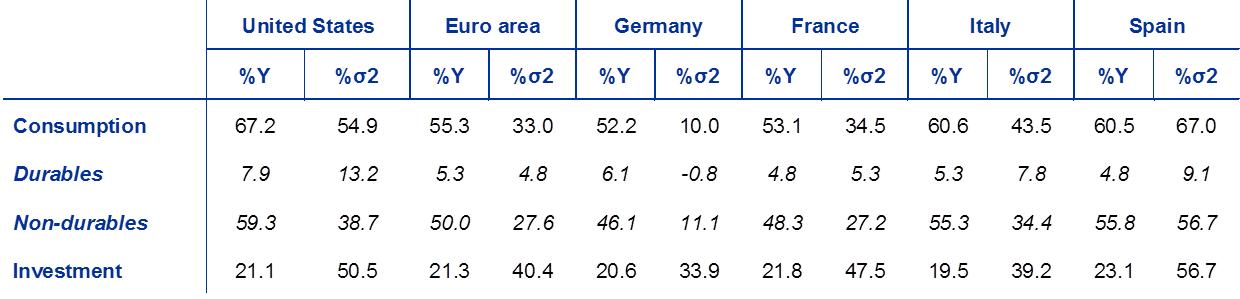
Sources: Eurostat, US Bureau of Economic Analysis and ECB calculations.
Notes: Share of GDP (%Y) and percentage of GDP variance explained (%σ2) by consumption and its components in the period from the first quarter of 1997 to the fourth quarter of 2019. Share of GDP is expressed in nominal terms, while share of explained variance is expressed in real terms. Non-durables also include semi-durables and services. For better comparability between the United States and the euro area (and euro area countries), investment refers to gross fixed capital formation (net of inventories) and comprises both private and public investment.
2.2 Turning point analysis
Turning point analyses focus on identifying time periods in which an economy switches from one regime to another, for instance from a phase of expansion to a phase of contraction, and vice versa. In this section, results for the euro area are shown based on two different approaches for defining a recession. One approach is based on the official business cycle dating methodology used by the Euro Area Business Cycle Dating Committee of the Centre for Economic Policy Research (CEPR).[9] The other is a modified version for quarterly data by Harding and Pagan (2002) of the original Bry and Boschan (1971) dating algorithm (hereafter MBBQ algorithm).[10] This algorithm is a multi-step, automated method to identify turning points on the basis of assumptions about the relative size of peaks and troughs and the minimum duration of the different phases of the business cycle.
Recessions in the euro area, based on CEPR official dating, tend to coincide with downturns in both GDP and most expenditure components, including durable goods consumption. Chart 3 shows CEPR recessions in the euro area (grey vertical bars delineated by black borders) alongside downturns in GDP and expenditure components identified on the basis of the MBBQ algorithm (coloured bars). The fact that recession periods tend to coincide with clusters of identified downturns for most GDP expenditure components is in line with the notion that a recession is a generalised phenomenon spread across the whole economy. At the same time, the decline in durable goods expenditure around downturns in the broader economy signals that purchases of durables are highly synchronised with developments in activity and thus carry important information about the phase of the business cycle.
Chart 3
Turning points for GDP expenditure components in the euro area
(recessions shown in grey bars based on CEPR dating; turning points identified by the MBBQ algorithm)
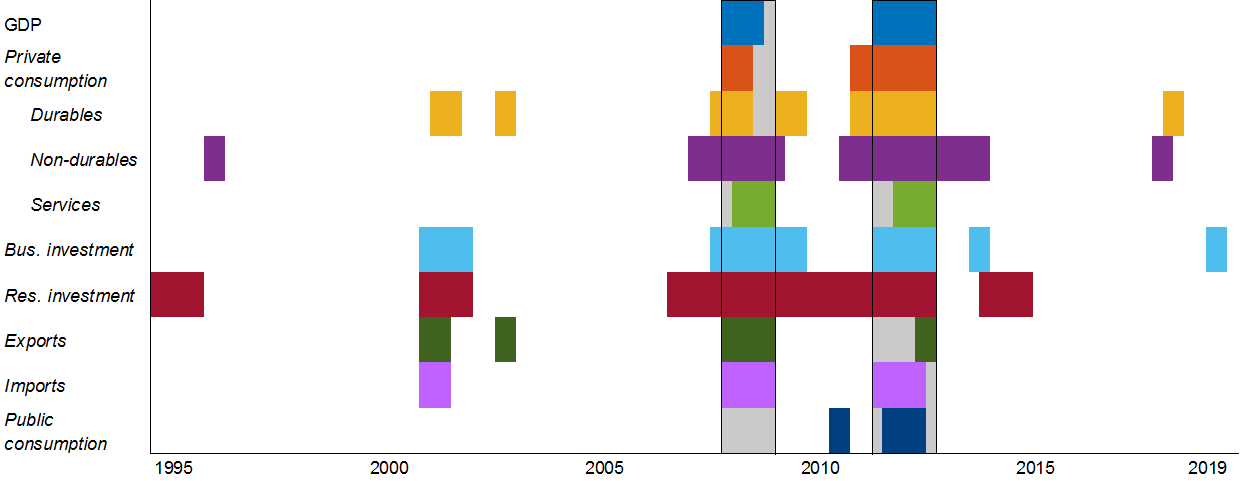
Sources: Eurostat, CEPR and ECB calculations.
Notes: Grey areas denote recessions identified by the CEPR. Coloured areas denote turning points for GDP and expenditure components identified by the Modified Bry-Boschan Quarterly (MBBQ) algorithm. The disaggregated series for euro area consumption components are built as a bottom-up aggregation of country-level data for EA19 in the case of durables, and for a subset of 12 countries (Germany, Estonia, Ireland, Spain, France, Italy, Cyprus, Latvia, Luxembourg, Malta, the Netherlands and Finland) for non-durables and services from the first quarter of 1995 to the present, with the exception of Italy, the Netherlands and Austria (all available from the first quarter of 1996), and Malta from the first quarter of 2000. Abbreviations on the vertical scale refer to business (Bus.) and residential (Res.) investment. Non-durable consumption includes also semi-durable goods and business investment includes public investment. The latest observations are for the fourth quarter of 2019.
Aside from downturns coinciding with official recessions, turning points in durables have also occurred historically outside recessions but during periods typically characterised by economic weakness. One such occurrence, for instance, was in the early 2000s, when economic activity in the euro area experienced a significant loss of momentum.[11] In tracking such episodes of “soft patches” in the economy, durable goods expenditure bears some resemblance to the behaviour of investment – another component of demand that tends to be both highly volatile and strongly pro-cyclical.[12] At the same time, the existence of “false” recessionary signals coming from the most volatile components of GDP cautions against over-relying on any single indicator, since it may embody sector-specific, rather than economy-wide, weakness.
Another interesting observation is that the identified downturns in durable consumption have tended to anticipate the official start of the two recessions in the euro area dated by the CEPR. While the limited recession episodes in the euro area invite caution against drawing strong conclusions, this leading feature in durable goods expenditure is also evident in the longer sample for the United States, which stretches over six decades, thereby capturing a larger number of recessions (see Chart 4). As with the euro area, the evidence from the United States also seems to suggest that the signal provided by durables regarding the change of phase in the business cycle tends to be less noisy than the one based on investment components. At the same time, it appears more consistent in signalling shifts between economic regimes than other consumption items such as services, which often do not exhibit turning points during official recessions.
Chart 4
Turning points for GDP expenditure components in the United States
(recessions shown in grey bars based on NBER dating; turning points identified by the MBBQ algorithm)
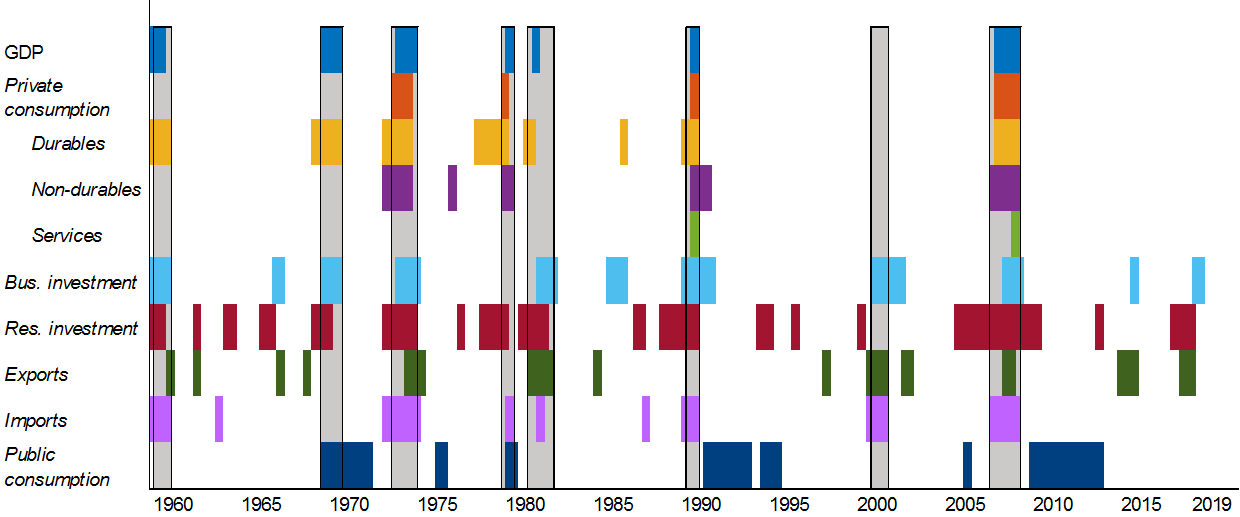
Sources: US Bureau of Economic Analysis, NBER and ECB calculations.
Notes: Grey areas denote recessions identified by the NBER. Coloured areas denote turning points for GDP and expenditure components identified by the Modified Bry-Boschan Quarterly (MBBQ) algorithm. Abbreviations on the vertical scale refer to business (Bus.) and residential (Res.) investment. The latest observations are for the fourth quarter of 2019.
3 Durable consumption, credit and financing conditions
Credit availability is important for households’ ability to smooth consumption over the business cycle. Financing conditions are particularly relevant for the purchase of big-ticket items such as durables, which, because of their longer lifespan and higher unit value, are more often acquired with credit and are sometimes eligible for use as collateral to secure the underlying credit claim.[13] Box 2 provides further details on the use of credit for durable goods purchases in the euro area.
Box 2The use of credit for durable goods purchases in the euro area
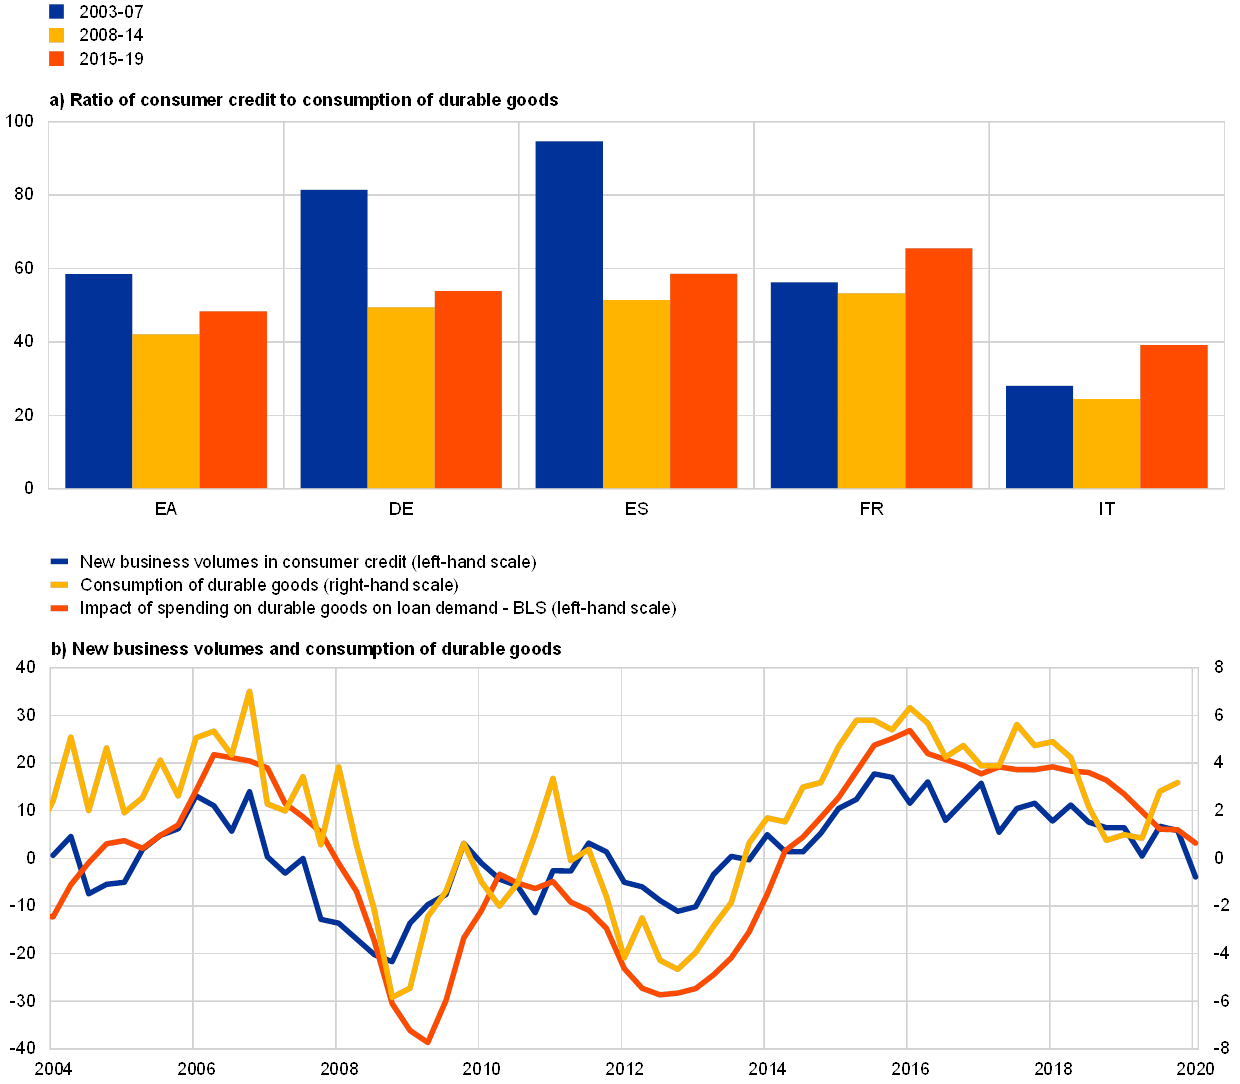
A large share of purchases of durable goods in the euro area is financed via credit.[14] This feature makes durable goods more exposed to credit conditions and monetary policy than non-durable goods. In the euro area as a whole, the relevance of consumer credit for purchases of durable goods declined markedly in the wake of the global financial crisis but has recovered since 2015 (see panel (a) in Chart A). While about 60% of the purchases of durable goods were financed using credit in the pre-crisis period, the share declined to around 40% in the period 2008-14 before increasing to almost 50% in the most recent period. From a country perspective, a similar pattern can be observed in Germany and Spain, where the bulk of households’ durable goods purchases in the pre-crisis period was financed with credit. In Germany, the decline observed after 2007 can be attributed to a decrease in the share of cars to total durable purchases and, in 2009-10, also to the vehicle scrappage scheme, which reduced the amount of credit needed to purchase a car. In Spain, the decline in the share of durables financed via credit can be explained by the strong deleveraging of the household sector and high unemployment rates observed after the global financial crisis. In France and Italy, credit is currently supporting purchases of durable goods to a higher extent than in the past, although in Italy it remains at a relatively moderate level, owing to the lower share of cars to total durable purchases in comparison with the other countries.
Chart A
Developments of consumer credit in the euro area
(panel (a): percentages; panel (b): annual percentage changes; four-quarter moving averages of net percentages)
Source: ECB calculations.
Notes: Panel (a) – ratio of new business volumes of consumer credit to consumption expenditure of durable goods; Panel (b) – annual growth rate of new business volumes in consumer credit and consumption expenditure of durable goods in nominal terms; four-quarter moving averages of net percentages for the ECB’s euro area bank lending survey (BLS) indicator. The latest observations are for the first quarter of 2020, except the observation for consumption of durables, which is for the fourth quarter of 2019.
Consumer credit has supported households’ demand for durable goods during the latest recovery. Movements in new business volumes in consumer credit have generally followed changes in consumption expenditure on durable goods very closely (see panel (b) in Chart A). The correlation between durable goods consumption and new business volumes in consumer credit from the first quarter of 2004 to the fourth quarter of 2019 is around 0.75. This strong link is also confirmed by the ECB’s euro area bank lending survey, which suggests that spending on durable goods is an important contributor to the demand for consumer credit. This robust relationship is also driven by the fact that durable goods, particularly cars, may serve as collateral to back the corresponding credit claims. Since 2014, the increasing demand for durable goods and for consumer credit to finance them has been supported by a return of confidence among households following the broad-based recovery in the economy and the improved labour market situation, as well as by record low bank lending rates (see panel (a) in Chart B). These developments were underpinned by the ECB’s accommodative monetary policy measures. The improved macroeconomic environment considerably reduced borrowers’ credit risk, thereby allowing banks to ease their credit supply conditions.[15] Since mid-2018, consumer credit dynamics have started to decelerate gradually, in line with the slowdown in economic activity and in the consumption of durables. This deceleration has been accompanied by increasing tightening pressures on banks’ credit standards, mainly due to banks’ stricter attitude towards credit risk, as well as higher collateral requirements and rejection rates. These pressures intensified in early 2020, reflecting the impact of the coronavirus pandemic.[16]
Chart B
Developments in lending rates and volumes of consumer credit in selected euro area countries
(panel (a): percentages per annum, three-month moving averages; panel (b): annual percentage changes)

Source: ECB calculations.
Notes: Panel (a) – The latest observations are for March 2020; Panel (b) – The data before 2011 are not adjusted for loan sales and securitisation. For the euro area and for Spain, quarterly data are interpolated to a monthly frequency using a cubic spline function. The latest observations are for March 2020.
The strengthening of euro area consumer credit since 2014 has been broadly based, although the growth rates of consumer credit in individual countries has shown marked differences (see panel (b) in Chart B). Since mid-2015, consumer credit has played a key role in supporting the recovery in total MFI loans to households in Spain and, to a lesser extent, Italy. In Spain, consumer credit grew at double-digit rates in annual terms and was the only private sector loan component to display a positive annual growth rate between 2015 and 2017. These robust dynamics should, however, be seen against the background of the strong and protracted decline in bank credit that took place during the euro area financial and sovereign debt crises and the subsequent strong pent-up demand pressures. In Italy, consumer credit accounted for half of the annual growth in total MFI loans to households over the period 2016-19. By contrast, the annual growth rates of consumer credit remained relatively moderate in Germany and France. Focusing on the most recent period, the growth of credit for consumption moderated in all large euro area countries, in line with the weakening economic environment. This moderation was particularly pronounced in Spain, as strong pent-up demand pressures following the crisis have been gradually reabsorbed. A sharp decline in consumer credit dynamics was observed in early 2020 across all large euro area countries, as a result of the lockdown measures introduced following the coronavirus outbreak.
As a result, durables correlate closely with demand for consumer credit and can provide important insights into the state of financing conditions in the economy. As shown in Chart 5, phases of sustained growth in durable goods consumption, such as during the period of expansion prior to the global financial crisis or the more recent one in 2013-19, tend to coincide with increases in demand for consumer loans typically used by households to finance purchases of durables. Likewise, the close co-movement between durables and demand for credit was present during the double-dip recessions in the euro area. Moreover, during the global financial crisis in 2008-09, the tightening of credit standards by banks restricted the availability of credit from the supply side and coincided with a significant contraction in durable goods purchases.
Chart 5
Supply of and demand for consumer credit, and durable goods consumption in the euro area
(left-hand scale: net percentages; right-hand scale: annual percentage changes)

Sources: ECB’s euro area bank lending survey (BLS), Eurostat and ECB calculations.
Notes: Loan supply and demand are based on questions asked to banks about how their credit standards and demand for loans have changed over the past three months. Euro area durable goods consumption series is in real terms. The latest observations are for the fourth quarter of 2019.
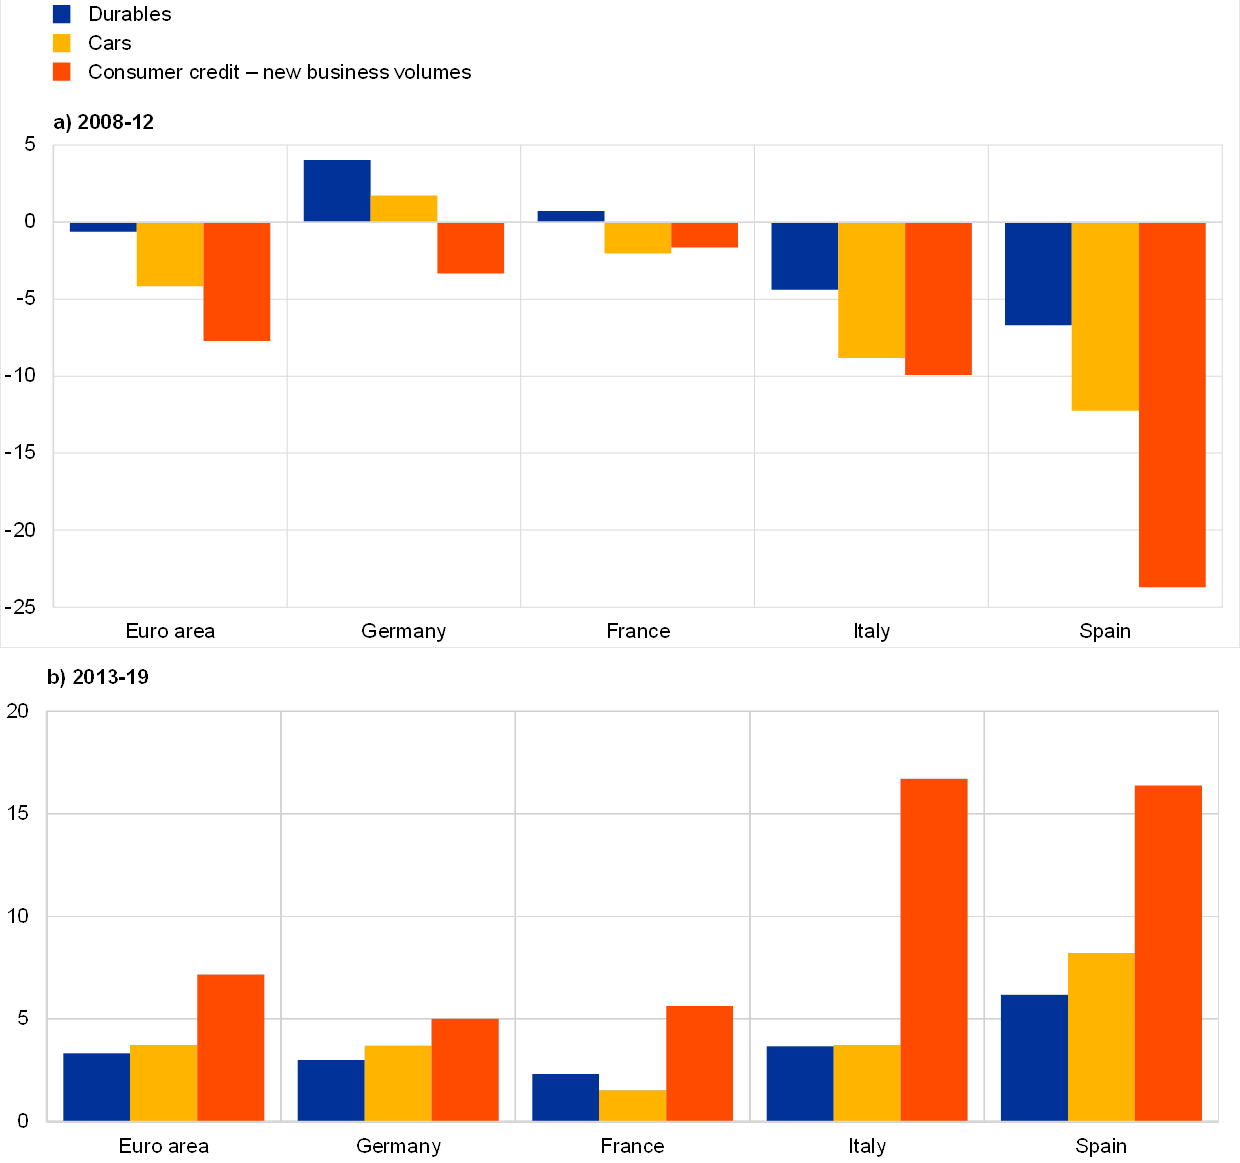
Divergent patterns in durable goods expenditure across different countries can therefore also reflect heterogeneity in financing conditions. Chart 6 displays durable goods consumption, expenditure on cars and consumer credit during two phases of the business cycle, for the euro area as a whole and across the four largest economies. The first period, 2008-12, was dominated by the double-dip recession and was followed by a phase of sustained recovery. While durable goods expenditure stagnated and credit contracted in the euro area as a whole during the first period, these developments – in the form of a sharp contraction – were particularly evident in Italy and Spain, countries heavily affected by the euro area financial and sovereign debt crises. By contrast, in the second period starting in 2013, as credit availability improved and the crisis-induced dispersion of financing conditions across euro area economies declined with the support of policy measures, both credit growth and durable goods expenditure – including purchases of vehicles – recovered, expanding at above-average rates in Italy and Spain. In particular, the recovery in credit in the latter phase was driven by the strong take-up in new medium and long-term consumer loans, the type of loans predominantly used by households to finance purchases of big-ticket items.[17]
Chart 6
Consumer credit, durable consumption and expenditure on cars
(average annual percentage changes)
Sources: Eurostat, ECB and ECB calculations.
Notes: Average growth rate of consumption of durable goods, expenditure on cars and consumer credit over the periods 2008-12 and 2013-19. Consumer credit is the annual change in the flow of new business loans granted for consumption purposes (excluding revolving loans and overdrafts, convenience and extended credit card debt). Consumer credit is expressed in nominal terms, while the consumption of durable goods and expenditure on cars are expressed in real terms. For consumption of durable goods and consumer credit the latest observations are for 2019, while for expenditure on cars the latest observations are for 2018. The growth rate for expenditure on cars in 2019 is extended on the basis of new passenger car registrations.
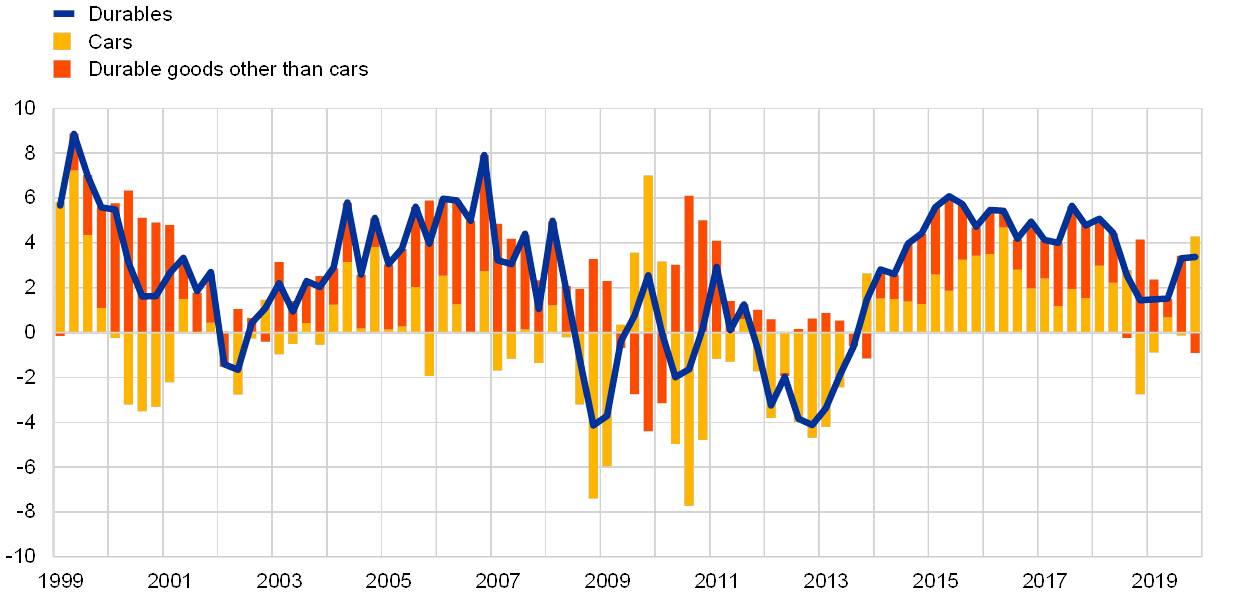
In particular, car purchases stand out as a major item within durable goods consumption – at around 40% of the euro area total – that is strongly affected by financing conditions (see Chart 7). What usually makes a vehicle suitable for financing, in addition to being more easily used as collateral, is its high unit value in proportion to income, its relatively long lifespan and its relatively low rate of depreciation.[18] Given the high cost involved in upgrading and adjusting the stock of major items such as cars, households’ intentions to make major purchases are strongly correlated with income expectations and their financial situation. As a consequence, the pattern of car purchases mirrors aggregate financing conditions and the strength of the economic cycle.
Chart 7
Consumption of durable goods in the euro area
(annual percentage changes and contributions in real terms)
Sources: Eurostat and ECB calculations.
Note: The latest observations are for the fourth quarter of 2019.
Expenditure on cars can also be an idiosyncratic source of fluctuations in durable consumption. This is due to the systemic relevance of the car industry for the overall economy – sometimes leading to the implementation of countercyclical policy support (e.g. subsidised vehicle scrappage schemes) – and to regulatory changes and technological advances. For instance, the rebound in car purchases in 2009, in the middle of the financial crisis, was bolstered by the wide-spread implementation of subsidies for vehicle scrappage schemes across the euro area, ranging from €1,000 per car in France to €2,500 per car in Germany.[19] The car-led recovery in durables during the recession proved to be short-lived, as the subsidies mostly brought forward future demand.
In the course of the latest expansion, expenditure on cars has provided a major impetus to the sustained growth in durables amid supportive financing conditions and the easing of banks’ credit standards for consumer loans since 2014. During this period, favourable funding conditions are likely to have supported durable goods expenditure more effectively since durables tend to react more strongly to monetary shocks during expansions than during recessions, as consistently found in the literature.[20] Using micro data, Box 3 investigates the heterogeneity across households in car purchases and the use of car loans during the recovery. In the past two years (2018-19), expenditure on cars experienced a slowdown amid substantial volatility, in part related to changes in environmental regulations and uncertain prospects about both the future use of diesel combustion engines and the speed of diffusion of electric cars.
Box 3 Household heterogeneity in vehicle purchases
Vehicles, such as cars, trucks and motorcycles, are an important component of durable goods. They make up about 40% of durable goods consumption at the aggregate level and account for much of its cyclical variation. Aggregate purchases of vehicles (hereafter “cars” for simplicity) have accordingly experienced buoyant dynamics in recent years. Aggregate figures, however, may hide considerable heterogeneity across the population. If, for example, only the wealthiest households were responsible for the aggregate increase in car purchases, it would be a sign of fragility in the growth in durable goods consumption. Moreover, car purchases often require a loan. The distribution of loans for car purchase can also provide useful information on macroeconomic and financial conditions.
This box investigates heterogeneity across euro area households in car purchases and in loans for the purchase of cars during the recovery following the European sovereign debt crisis. We make use of the Eurosystem’s Household Finance and Consumption Survey (HFCS), which is a unique source of cross-country comparable household-level data on balance sheets, income and consumption indicators. The survey also provides information on households’ expenditure on, and loans for, vehicle purchases. The HFCS is a triennial survey, so this box focuses on the two waves conducted in 2014 and 2017. Information on car purchases is available with reference to the year before the survey interviews, i.e. 2013 and 2016 respectively.[21]
A general feature emerging from the micro data is that households with higher levels of income tend to buy more expensive cars and to change them more often. Chart A shows how the share of households who bought a new or used car in the year preceding the survey (panel (a) of Chart A) and the median value paid (panel (b) of Chart A) are distributed across quintiles of gross household income. The amount paid for purchase, as given in panel (b), refers to purchases of both new and used cars, net of anything received for trading in or selling an older model.[22] Both measures clearly increase in accordance with income in the two survey waves: households with higher incomes tend to buy cars more often and to spend more on them.
Chart A
Households’ car purchases and loans funding car purchases in the euro area
(percentages and thousands of 2017 EUR)

Sources: Household Finance and Consumption Survey (HFCS) 2014 and 2017.
Notes: Car purchases refer to the total net amount paid for cars, net of anything received for trading in or selling an older model, that were bought by households during the previous 12 months. Loans funding car purchases refer to the total outstanding balance of all loans currently held that have been used to buy cars. The data include the following euro area countries: Belgium, Germany, Estonia, Ireland, Greece, France, Italy, Cyprus, Latvia, Lithuania, Luxembourg, Malta, the Netherlands, Austria, Portugal, Slovenia and Slovakia. Information on loans for cars for Spain and Finland is not available.
Reflecting a broad-based recovery, the data show that purchases of vehicles between 2014 and 2017 increased across the income distribution. Both the share of households who bought a car and the median value of the car increased for all income groups. More specifically, the share of households buying a car grew by between 1.5 and 3.1 percentage points and the median value of the car grew within a range of €400 and €2,100. Similar increases were recorded across other socio-demographic dimensions, such as age, education and employment status.
The increases in car purchases were sizable throughout the income distribution, including the lower and middle segments. While in the lowest income quintile the share of households buying a car rose by about 60%, in the middle quintile it increased by about 20% and in the top quintile by 8%. This may reflect the fact that durable goods, including cars, are particularly pro-cyclical. During a recession, households tend to postpone the purchase of durables and instead spend on necessities.[23] This pattern is particularly pronounced in the case of poorer households, who are more subject to unemployment risk and have less liquid assets to smooth their spending.
Lower uncertainty spurs car purchases. A durable good provides households with a stream of services throughout its lifetime. Purchasing a durable good is therefore a decision to allocate present and future savings to current and future consumption, and as such, households that are less certain of what their future income will be have fewer incentives to do so. Declining uncertainty, lower unemployment and more optimistic prospects about future economic developments likely contributed to increasing numbers of car purchases, especially in the lower segments of the income distribution (see panel (a) of Chart A).
The size of loans stipulated for car purchases also increases in the income distribution. Furthermore, car loans tend to increase with income (panel (d) of Chart A). However, the share of households holding car loans increases up to the fourth income quintile, before falling slightly for the fifth quintile (panel (c) of Chart A).
While the share of households holding loans for car purchases remained roughly stable between 2014 and 2017, the balance of these loans increased across the income distribution. The share of households holding loans for purchases decreased slightly for most income quintiles (panel (c) of Chart A); the difference between the two years did not exceed 1.5 percentage points. At the same time, the median value of loans funding purchases (panel (d) of Chart A) grew by between €900 and €2,000 throughout the income distribution. In percentage terms, the strongest increase was recorded among households in the lowest quintile. This increase in the median value of loans funding car purchases for lower income households may reflect their more optimistic expectations about the economy and less binding credit constraints.
Car purchases increased more strongly for households with few net liquid assets. This fact suggests that a precautionary saving motive may have been an important factor dampening durable goods spending during the Great Recession. As with income risk, durable goods consumption is also influenced by how well households are insured against shocks in terms of net liquid assets. In line with economic models, households with low buffers of liquid assets tend to postpone purchases of durables during recessions and buy cars during the recovery when their economic outlook is more optimistic. Additional calculations document that households with few net liquid assets relative to their income – especially those exposed to risk, such as those with lower incomes – expanded their car purchases more strongly.
Looking ahead, in the near future, purchases of cars will decline because of the coronavirus pandemic. In the short run, many households will put off their spending on cars because the supply has been severely curtailed owing to containment measures and because of adverse shocks to incomes, as well as rising economic and financial uncertainty. Over the medium run, the future recovery in consumer durables could be supported by the postponed pent-up demand and a possible change in households’ preferences for cars over public transport. However, this effect could be tempered by the fact that the pandemic shock will disproportionately affect younger households. These households account for a substantial part of car purchases and they are also likely to be particularly exposed to declines in income and rising uncertainty.
4 Relative prices and relative consumption of durables
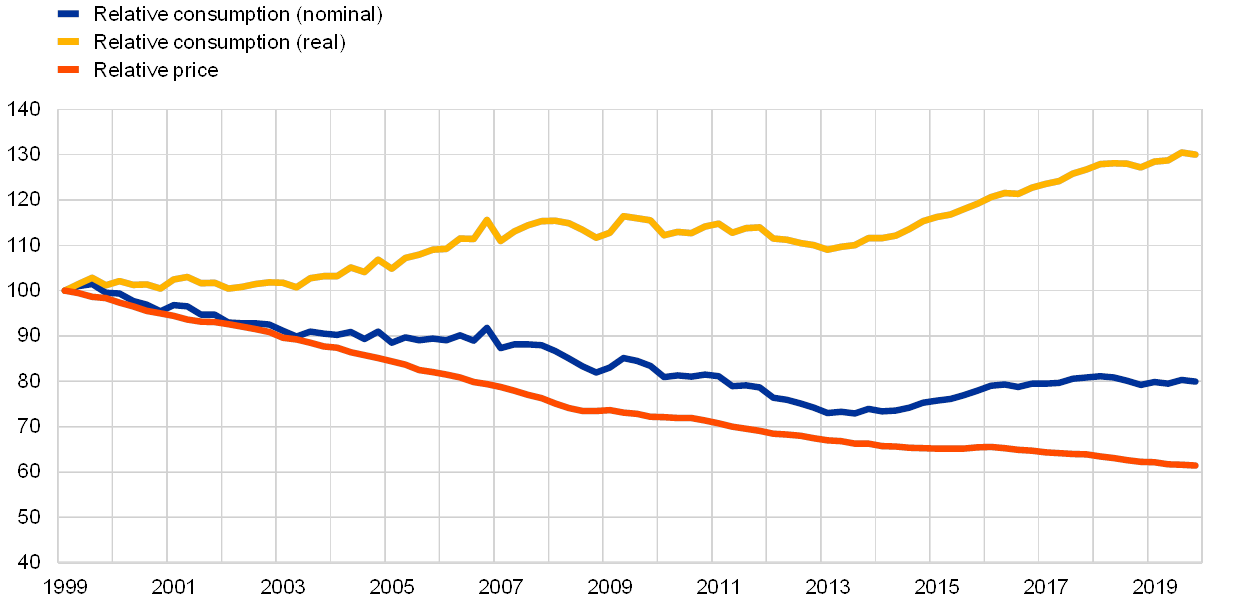
Over the long run the relative price of durables exhibits a sustained downward trend. The relative price, as measured by the ratio between the consumption deflators of durables and non-durables (the latter including semi-durables and services), has declined by almost 40% in the euro area since 1999 (see Chart 8). The increase in the affordability of durables has benefited from globalisation trends and has been observed also in other advanced economies, such as the United States, the United Kingdom and Japan. Since the mid-1990s, globalisation has increasingly allowed firms to source low-cost imports of consumer goods from new locations in emerging markets and to move production capacities to such destinations.[24] In addition, rapid technological advances have lead to a constant decline in prices for durable goods items such as electronics, while posing challenges to quality adjustments in the statistical measurement of price changes. Box 4 sheds light on the importance of durable goods for HICP inflation in the euro area.
Chart 8
Relative consumption and relative prices of durables in the euro area
(index of relative prices and relative consumption in real and nominal terms, 1999 Q1 = 100)
Sources: Eurostat and ECB calculations.
Notes: The relative consumption index is computed as the ratio of durables to non-durables, in both real and nominal terms. The relative price index is the ratio of durable goods to non-durable goods deflators. The series are indexed to the first quarter of 1999 (1999 Q1 = 100). The latest observations are for the fourth quarter of 2019.
Box 4 The impact of durable goods prices on HICP inflation
Durable goods prices have not provided support to euro area inflation developments over the past two decades. Their contribution to headline and underlying inflation has, on average, been zero (see Chart A). This reflects a slightly negative rate of inflation – about -0.1% on average since 1999 – and the relatively small weight of durable goods in the HICP basket. Since1999 the weight of durable goods has been, on average, 34% for non-energy industrial goods and 14% in the HICP excluding energy and food.[25]
Chart A
Durable goods inflation, HICP inflation excluding energy and food and its components
(annual percentage changes and percentage points, monthly data)

Sources: Eurostat and ECB calculations.
Note: The latest observations are for March 2020.
While durable goods inflation has seen a flat trend, it has also displayed a fair degree of cyclicality. A granular analysis suggests that specific items have contributed to both features. Chart B decomposes developments in durable goods prices into six major items: cars, furniture, household appliances, computers, telephones and others. Prices for computers have declined, on average, by 10% and have not seen a positive annual rate of change since 1999. Moreover, the volatility of the negative annual rates of change has been substantial, as documented by a standard deviation of almost 6 percentage points. The same can be said of telephone prices.[26] Appliances has also recorded, on average, a negative inflation rate, albeit smaller and much less volatile. By contrast, cars and furniture have, on average, seen positive inflation rates with volatilities much lower than for computers and telephones. Accounting for more than half of the weight of durables, they shape the trend and volatility of the HICP durable goods aggregate. If computers and telephones were excluded from durable goods, the average durable goods inflation rate over the past two decades would have been slightly positive.
Chart B
Major durable goods items: average inflation rate and standard deviation 1999-2020
(average annual percentage changes and percentage points)

Sources: Eurostat and ECB calculations.
Notes: “Cars”, “Furniture”, “Appliances”, “Computers” and “Telephones and mobile phones” together represent 80% of all durable goods, with the first three items covering about 40%, 20% and 10% of the aggregate respectively. The inflation rate for “telephones and mobile phones” has been available only since December 2017. The inflation rate of “Durables excluding computers and telephones” excludes telephones only from December 2017 and thus includes the changes due to the transition to the COICOP5 breakdown.
The diverse inflation developments across durable goods items suggest that there may be idiosyncratic factors driving them. For instance, the high degree of technological progress since the late 1990s is likely to have been particularly prevalent for computers. In the HICP statistics, such progress is considered as an improvement in product quality and, hence, does not reflect a pure price change. Purchasing a new computer with more processing power than the one to be replaced therefore implies a decline in the price recorded in the HICP statistics. Similar adjustments for quality improvements, although not to the same extent, are also applied to car prices.[27] This factor has contributed to the relatively muted average inflation rate of durable goods over the past two decades.
Idiosyncratic factors can make it more difficult to discern the relationship between durable goods inflation and regular demand and cost factors. For instance, from a demand perspective, durable goods inflation tends to co-move with private consumption growth. From a cost factor perspective, durable goods inflation exhibits a negative correlation with unit labour cost growth, which comes from a strong positive association with productivity growth rather than with wage developments. Although these aggregate indicators are only crude proxies for sector-specific demand and cost conditions for durables, they are consistent with a picture whereby firms’ pricing of durable goods tends to reflect changes in the cycle and profits adjust to demand and cost shocks. Developments in global sourcing and production are also relevant for durable goods inflation. For non-energy industrial goods as a whole, the direct and indirect import contents rose from 20% in 2000 to slightly above 25% in 2014.[28] The shares for durable goods are likely to be similar.
Over time, the decline in relative prices has coincided with a rise in real durable consumption relative to other items. As evident in Chart 8, favourable price developments have contributed to an increase in the share of durables in total consumption in real terms, despite a modest decline in the corresponding nominal share. Moreover, panel (a) in Chart 9 shows the common nature of this phenomenon being observed over the long run, not only for the euro area as a whole but also across its four largest economies. At business cycle frequency, however, relative durable consumption can respond to country-specific economic conditions, being affected by pent-up demand and catch-up effects. Panel (b) highlights that, even though relative prices continue to decline during weak phases of the business cycle, sometimes consumers fail to take advantage of favourable price conditions. For instance, in Italy and Spain during the period 2008-12, other factors such as declining disposable income and increasing unemployment hindered consumption more broadly. The postponement of purchases of big-ticket items in the middle of the protracted recessionary phase led to an ageing stock of durables generating pent-up demand.[29] As a consequence, the subsequent expansion, as displayed in panel (c), may well have been associated with catch-up effects as economic conditions improved.
Chart 9
Dynamics in relative consumption, relative prices and real disposable income
(average annual growth rates as percentages)
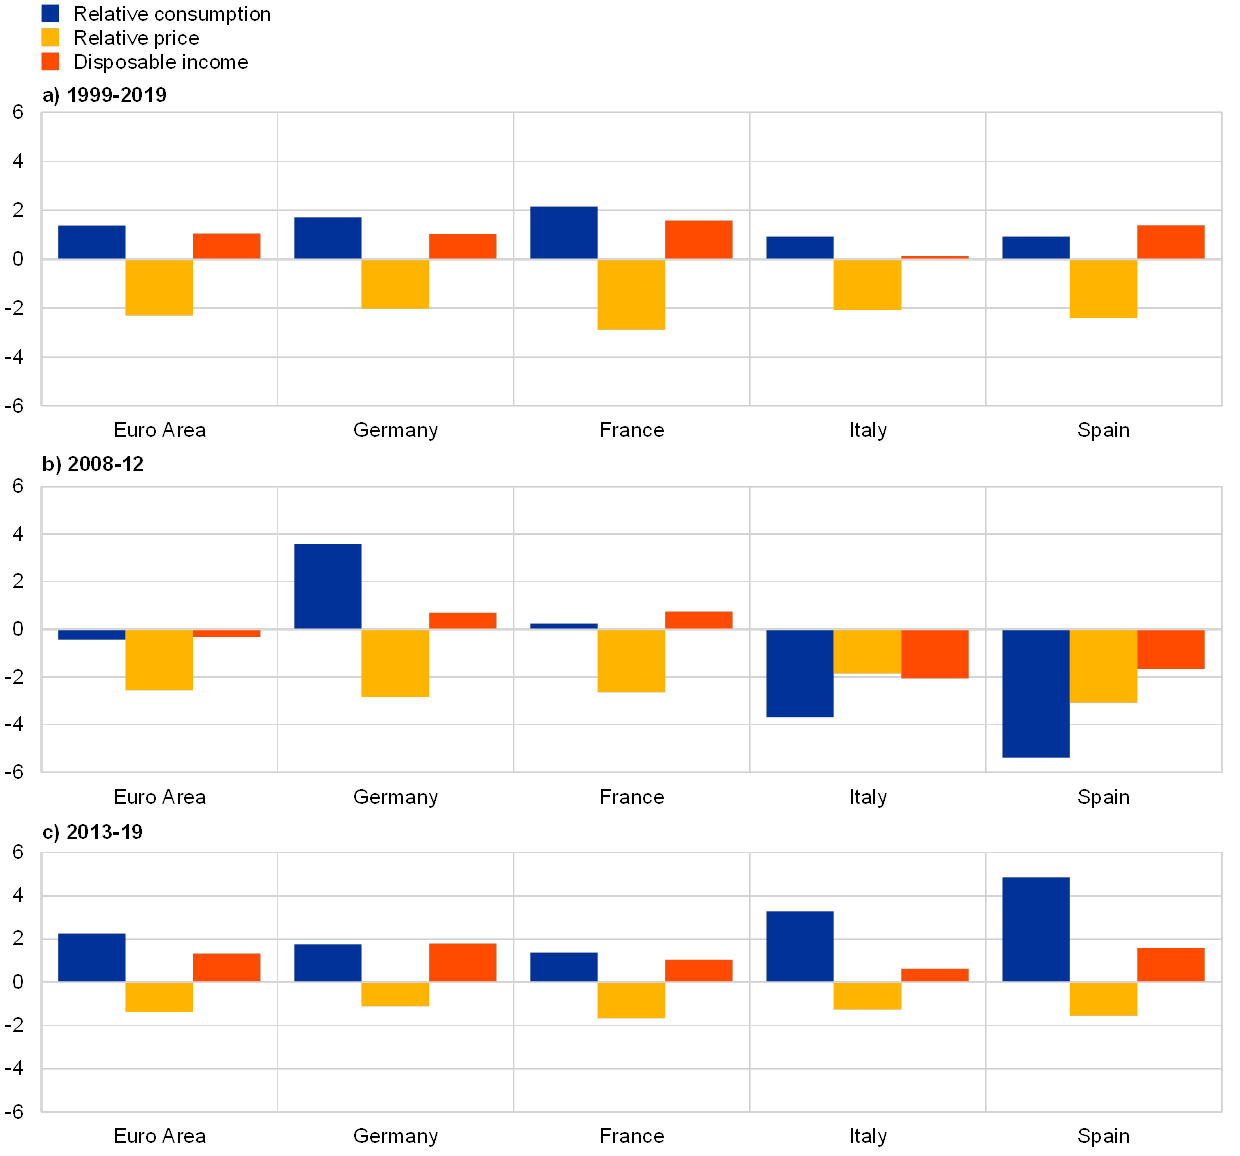
Sources: Eurostat and ECB calculations.
Notes: Relative consumption is the ratio of durable goods expenditure volumes to non-durable goods expenditure volumes, and the relative price is the ratio of durable goods deflators to non-durable goods deflators. Disposable income is expressed in real terms and, owing to data availability, is the average over 2000-19 in panel (a).
5 A structural decomposition of consumption taking into account durable goods-specific shocks
The aim of this section is to empirically assess the drivers of total consumption, allowing for durable goods-specific factors to play a role. In the empirical literature few studies distinguish durables consumption from non-durables consumption and explore how they are interconnected, especially for the euro area. The limited existing analysis in this area is because aggregate data on euro area durables expenditure have not yet been published officially and have only recently become available for all individual countries. Moreover, the specific characteristics of durables discussed previously – namely durability, depreciation and sensitivity to credit conditions – make it more challenging to incorporate them into a consumption model alongside non-durable expenditure items.
The empirical analysis is based on a vector autoregressive (VAR) model featuring durable goods, where the structural shocks are identified based on theory.[30] The underlying idea is that overall consumption is better modelled by treating expenditure on durables and non-durables separately, given their asynchronous adjustment, as well as the possibility of spillovers from durable-specific shocks to non-durable consumption in the presence of liquidity constraints.[31] The model uses five variables, volumes and prices of durable and non-durable consumption and the nominal interest rate on consumer credit. To interpret the evolution of consumption in terms of fundamental drivers, five structural drivers are identified: durable goods-specific demand and supply, aggregate (approximated by non-durables) demand and supply, and broad monetary conditions capturing both monetary policy and the credit environment. The identification relies on a mix of zero and sign restrictions as informed by a theoretical model. The VAR model has time-varying parameters and is estimated with Bayesian techniques.
The methodology allows consumption to be decomposed into contributions from structural shocks. Chart 10 presents a historical decomposition of overall consumption and of durable goods consumption growth in the euro area. Focusing on overall consumption, the results in panel (a) suggest that, against the background of prevailing negative aggregate supply shocks between 2008 and 2013, the main cyclical drivers of consumption in both the financial crisis and the sovereign debt crisis were demand-side factors, as their contribution triggered both downturns throughout the episodes of the crises, as well as the brief recovery phase in between. The negative effects from demand factors were compounded by unfavourable monetary conditions during the financial crisis.[32] The model assigns a strong positive role in the initial years of the recovery, which started in 2014, to aggregate supply-side shocks. These shocks captured, together with other factors, a positive impact from very low energy prices, as they coincided with an unexpected drop in oil prices that gave a considerable boost to euro area households’ purchasing power and thereby supported consumption expenditure.[33] The slowdown in consumption growth since 2018 can be explained by a combination of demand and supply shocks, the latter possibly capturing the adverse effects on consumer purchasing power from rising energy prices since 2017.
Chart 10
Model-based historical decomposition of private consumption in the euro area
(percentage point contributions from structural factors to the average annual growth rate of private consumption excluding trend, as percentages)
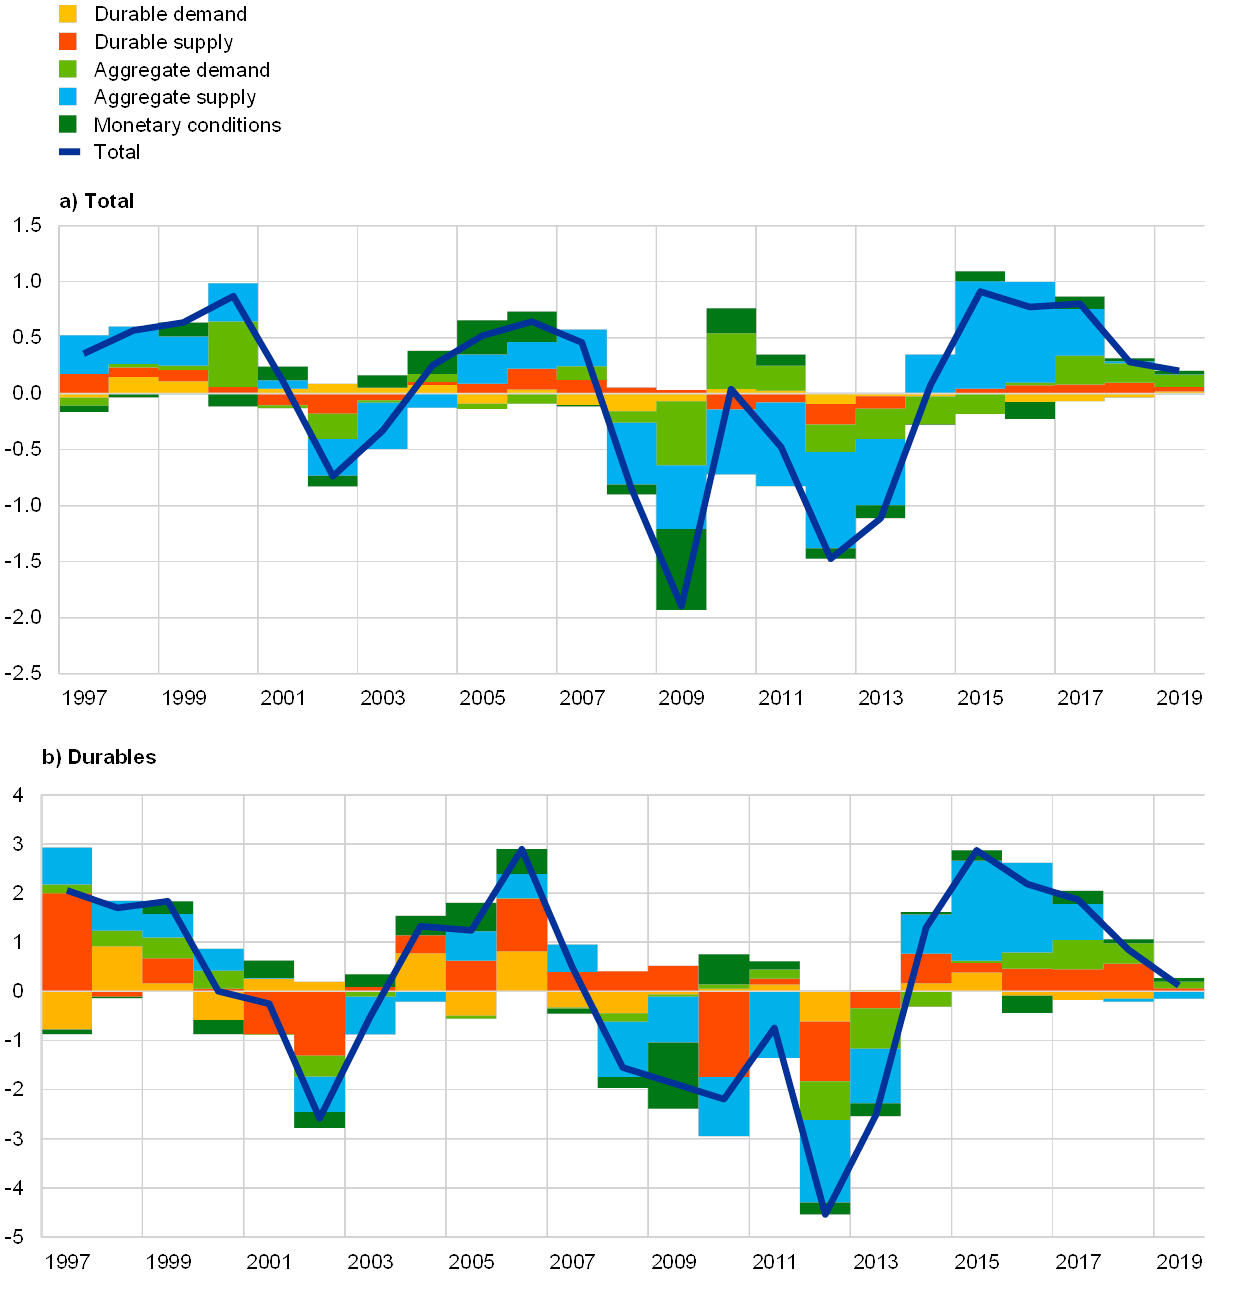
Source: ECB calculations.
Notes: The decomposition of the annual growth rate of private consumption is based on a time-varying parameter Bayesian VAR (TVP-BVAR) model of consumption featuring durable goods. It is based on Casalis, A. and Krustev, G., “Cyclical drivers of euro area consumption – what can we learn from durable goods?”, Working Paper Series, No 2386, ECB, April 2020. The decomposition of private consumption into structural shocks (durable goods demand, durable goods supply, aggregate demand, aggregate supply and broad monetary/credit conditions) is based on an identification scheme using a combination of zero and sign restrictions.
The results from the model confirm the pro-cyclical role played by durable goods-specific factors. In particular, durable goods-specific supply shocks have continued to provide positive, albeit modest, support to consumption throughout the last years of the sample ending in 2019. By contrast, the negative contribution from durable goods-specific demand factors since approximately 2016 may capture the waning of catch-up effects arising from the accumulation of pent-up demand for durables during the crisis.
Aggregate macroeconomic shocks contribute strongly in driving durable consumption and the broader economy. As expected, durable goods-specific shocks play a larger role in driving durables expenditure (see panel (b) of Chart 10) than overall consumption (see panel (a) of Chart 10). At the same time, aggregate shocks –such as shocks to aggregate demand, aggregate supply and monetary conditions – matter at least as much for durables as sector-specific shocks. This validates the evidence that durables are greatly affected by the broader business cycle and thus they are a useful indicator for tracking cyclical conditions in the economy.
6 Conclusions
Focusing on longer-run trends, this article has explored the role played by durable goods as a cyclical driver of euro area consumption. On the basis of the empirical results, the slowdown during 2018-19, in comparison with the buoyant dynamics in consumption during the earlier phases of the latest recovery, is best interpreted as a normalisation following the dissipation of some favourable but transitory factors at play in the preceding years.
Looking ahead, with the spread of the coronavirus having triggered a deep recession, expenditure on durables is very likely to contract severely in 2020 owing to many shops closing under lockdown and households postponing purchases of big-ticket items. In the current environment of high uncertainty, past experience highlights the benefits for economic analyses coming from the availability of durable goods expenditure data and invites policymakers to monitor closely the behaviour of durables, as they can help track the health of the broader economy and provide clues about the path to recovery. If the pandemic crisis turns out to be temporary and financial amplification effects can be contained, as expected, the delay in durable purchases in the short term may generate pent-up demand and bring catch-up effects later on, once economic conditions normalise. In a less favourable scenario, the rebound in durable consumption may be more muted as households readjust to a lower desired stock in view of lower long-run income expectations.
- . Durable goods consumption, alongside residential investment, is generally considered a strong leading indicator of business cycles. See Mian, A. and Sufi, A., “Household Leverage and the Recession of 2007–09”, IMF Economic Review, Vol. 58, No 1, 2010, pp. 74-117.
- Average annual consumption growth in the euro area slowed from 1.9% in 2015-17 to 1.3% in 2018-19. The reduction of the contribution of durables expenditure to total consumption growth amounted to 0.2 percentage points between the two periods, or roughly one-third of the overall slowdown.
- Part of the adjustment is necessary owing to depreciation.
- Studies using US data find that the reaction of durable goods expenditure to monetary shocks is larger than that of non-durables, despite always being of the same sign; this phenomenon is commonly referred to as co-movement. See, for instance, Monacelli, T., “New Keynesian models, durable goods, and collateral constraints”, Journal of Monetary Economics, Vol. 56, No 2, 2009, pp. 242-254 and Cantelmo, A. and Melina, G., “Monetary policy and the relative price of durable goods”, Journal of Economic Dynamics and Control, Vol. 86, Issue C, 2018, pp. 1-48.
- See Caballero, R.J., “Durable Goods: An Explanation for Their Slow Adjustment”, Journal of Political Economy, Vol. 101, No 2, 1993, pp. 351-384.
- Consumer durables held by households as final consumers include typical asset-type goods, for example those in the ESA 2010-defined asset groups of “transport equipment” (AN.1131) and “other machinery and equipment” (AN.1139), which are acquired by households for final consumption. In such cases they are not accounted for as assets, which is otherwise the case for the non-household sector.
- Quarterly data for Malta start only in the first quarter of 2000 owing to national derogations. Data for Finland and France are available from before 1995.
- See Grigolon, L., Leheyda, N. and Verboven, F., “Scrapping subsidies during the financial crisis — Evidence from Europe”, International Journal of Industrial Organization, Vol. 44, 2016, pp. 41-59. In contrast to the full sample in Table 1, the correlation of durables to GDP in Germany is positive, rather than negative, for a sub-sample up to the fourth quarter of 2007, which excludes the financial crisis and the counter-cyclical behaviour of the cars component induced by the vehicle scrappage schemes.
- The CEPR approach defines a recession as “a significant decline in the level of economic activity, spread across the economy of the euro area, usually visible in two or more consecutive quarters of negative growth in GDP, employment and other measures of aggregate economic activity for the euro area as a whole”.
- See Harding, D. and Pagan, A., “Dissecting the cycle: a methodological investigation”, Journal of Monetary Economics, Vol. 49, No 2, 2002, pp. 365-381 and Bry, G. and Boschan, C., “Programmed Selection of Cyclical Turning Points” in Bry, G. and Boschan, C. (eds.), Cyclical Analysis of Time Series: Selected Procedures and Computer Programs, NBER, 1971, pp. 7-63.
- Note that the first two quarters of 2003 have been characterised by the CEPR as a “prolonged pause in the growth of economic activity, rather than a full-fledged recession” in the euro area.
- On the distinction between recessions and soft patches in the euro area economy, see Duma, M. Forsells, M. and Kennedy, N., “Definitions and characteristics of soft patches in the euro area”, Economic Bulletin, Issue 4, ECB, 2019.
- Notwithstanding the importance of consumer credit in financing the consumption of durable goods (see Box 2), mortgages associated with the acquisition of housing still account for a larger share of household debt.
- Credit for consumption refers to loans granted for mainly personal use for the purchase of goods and services. It should be noted that revolving loans, overdrafts and credit card debt are covered by consumer credit in the case of outstanding amounts in MFI balance sheet statistics, while in the case of new business volumes they are excluded from MFI interest rate statistics. For more details on the statistical definitions, see the “Manual on MFI balance sheet statistics” and the “Manual on MFI interest rate statistics”.
- See “Recent trends in consumer credit in the euro area”, Economic Bulletin, Issue 7, ECB, 2017.
- See “The euro area bank lending survey – First quarter of 2020”, ECB, April 2020.
- See “Recent trends in consumer credit in the euro area”, Economic Bulletin, Issue 7, ECB, 2017.
- While cars may depreciate faster than some durables, such as furniture, they depreciate much more slowly than other items, such as computers. See Stacchetti, E. and Stolyarov, D., “Obsolescence of Durable Goods and Optimal Purchase Timing”, Review of Economic Dynamics, Vol. 18, No 4, 2015, pp. 752-773.
- See Grigolon, L., Leheyda, N. and Verboven, F., “Scrapping subsidies during the financial crisis – Evidence from Europe”, International Journal of Industrial Organization, Vol. 44, 2016, pp. 41-59.
- See, for instance, Berger, D. and Vavra, J., “Consumption dynamics during recessions”, Econometrica, Vol. 83, No 1, 2015, pp. 101-154.
- The information about car purchases was not collected in the first wave of the HFCS. The description of the main results of the survey can be found in Household Finance and Consumption Network, “The Household Finance and Consumption Survey: Results from the second wave”, Statistics Paper Series, No 18, ECB, 2016; and Household Finance and Consumption Network, “The Household Finance and Consumption Survey: Results from the 2017 wave”, Statistics Paper Series, No 36, ECB, 2020.
- The HFCS data cannot be directly compared with most other data sources because those sources do not separately cover the household sector or because they focus on new cars only. The HFCS data also cover purchases/sales of used cars by households. The data on amounts in euro spent on purchases of cars collected in the HFCS are comparable with the amounts reported in the Household Budget Surveys.
- See, for example, Carroll, C.D. and Dunn, W.E., “Unemployment Expectations, Jumping (S,s) Triggers, and Household Balance Sheets”, in Benjamin S. Bernanke and Julio Rotemberg (eds.), NBER Macroeconomics Annual, Cambridge: MIT Press, 1997, pp. 165–229.
- See Kim, M. and Reinsdorf, M.B., “The Impact of Globalization on Prices: A Test of Hedonic Price Indexes for Imports”, in Houseman, S.N. and Mandel, M. (eds.), Measuring Globalization: Better Trade Statistics for Better Policy, Vol. 1, Kalamazoo: Upjohn Institute Press, 2015.
- The HICP coverage was extended in 2000 to include several social services, with the result that any comparison of weights before 2001, on the one hand, and for 2001 and thereafter, on the other hand, is affected by this structural break.
- These prices have been available only since December 2017 in preparation for the HICP transition to the COICOP5 breakdown in 2019.
- The HICP methodology requires actual price changes to be adjusted for quality improvements. This is a difficult task, in particular for products whose quality changes rapidly and often substantially over time. With a view to providing comparable results, HICPs for euro area countries are designed to present harmonised results, while the statistical tools and methods used to produce these results may vary.
- See Schaefer, S. in Box 1 of Ortega, E. and Osbat, C. (eds.), “Exchange rate pass-through in the euro area and EU countries”, Occasional Paper Series, No 241, ECB, Frankfurt am Main, April 2020.
- See Dossche, M. and Saiz, L., “Consumption of durable goods in the ongoing economic expansion”, Economic Bulletin, Issue 1, ECB, 2018.
- The approach is based on Casalis, A. and Krustev, G., “Cyclical drivers of euro area consumption: what can we learn from durable goods?”, Working Paper Series, No 2386, ECB, April 2020.
- See Chah, E., Ramey, V. and Starr, R., “Liquidity Constraints and Intertemporal Optimisation: Theory and Evidence from Durable Goods”, Journal of Money, Credit and Banking, Vol. 27, Issue 1, 1995, pp. 272-287.
- As noted earlier, monetary conditions in this case encompass both monetary policy and the broader credit environment. Interestingly, the finding of a negative contribution from monetary conditions in 2009 corroborates the evidence of a tightening in credit supply as shown in Chart 5.
- See Dossche, M., Forsells, M., Rossi L. and Stoevsky, G., “Private consumption and its drivers in the current economic expansion”, Economic Bulletin, Issue 5, ECB, 2018.