
Household wealth and consumption in the euro area
Household wealth and consumption in the euro area
Published as part of the ECB Economic Bulletin, Issue 1/2020.
1 Introduction
Household wealth is the difference between the value of a household’s assets and the value of its liabilities and is one of the key determinants of private consumption. Increases in wealth can affect private consumption in the short run, as households may feel richer and become more confident. Moreover, the level of household wealth is an important factor driving longer-term consumption choices and growth. Together with future expected labour income, it determines the level of life-long resources available to households. As private consumption is by far the largest contributor to total economic activity, household wealth may have a substantial impact on the state of the economy and, ultimately, on the outlook for inflation. In turn, monetary policy may have an impact on wealth developments, not only via its impact on asset prices but also through transmission channels. Therefore, it is important to consider levels of and changes in wealth when determining the appropriate monetary policy stance.
The potential importance of household wealth has led to a rich theoretical and empirical literature on its effects on private consumption. There is abundant literature on wealth effects in the United States and other individual countries which has produced a wide range of estimated elasticities of private consumption to wealth.[1] This article focuses on the effect of household wealth on the euro area economy and its four largest countries. The article primarily makes use of sector accounts data, which provide a detailed overview and consistent recording of non-financial and financial transactions and balance sheets at the institutional sector level in the euro area and in its member countries.
This article focuses on wealth effects at the aggregated household sector level rather than on wealth effects at the household level. Apart from the above-mentioned macroeconomic channels, which consider the impact on consumption of changes in the wealth of the total household sector, wealth can also have macroeconomic effects through distributional changes at the micro and individual household level. For example, if rising wealth accrues mostly to rich households, it would add to inequality and its macroeconomic impact might also be more limited, as rich households tend to have a lower marginal propensity to consume and might not step up their spending significantly.
Section 2 describes developments in household wealth since 1999 based on the sector accounts and refers briefly to the distribution of wealth across households in 2014 based on the Eurosystem’s latest available Household Finance and Consumption Survey. Section 3 provides estimates of wealth effects and the role they have played in recent years. Section 4 concludes with a look at monetary policy implications.
2 Household wealth developments
The sector accounts provide a comprehensive framework for the analysis of household wealth developments. The financial accounts include detailed information on financial positions, financial transactions and other flows in the economy, by institutional sector and financial instrument. Non-financial accounts contain, inter alia, data on income, consumption, savings, investment and non-financial asset holdings.[2]
Households hold non-financial and financial wealth. Non-financial wealth mostly reflects dwellings and land underlying dwellings owned by households, but also includes assets owned by unincorporated household enterprises.[3] Non-financial assets can provide important additional resources, either through their sale or refinancing or as income via, for example, the letting of residential property. Owner-occupied dwellings also have, in principle, an effect on consumption insofar as the owner does not have to pay rent and thus has more money for other consumption. In the national accounts, this is taken into account by considering rent as consumption of services and imputing consumption and income flows of the same amounts to the owners of owner-occupied dwellings. It is important to note that landlords are better off as a result of higher house prices, whereas current and future tenants are worse off. However, tenants and landlords balance each other out, meaning that, on average, the inhabitants of a country own the dwellings in which they live, so there is no economy-wide housing wealth effect from this perspective.[4] Financial wealth consists of financial assets, such as holdings of deposits, bonds, equity and investment fund shares. These are an important source of cash flow, either through the sale of such assets or through investment income (such as interest and dividends). However, pension entitlements are only included in the financial wealth of households in the sector accounts if they relate to (funded) employment-related private or civil service schemes. Social security pensions, which consist primarily of pensions related to pay-as-you-go systems and make up the bulk of the total estimated stock of pension entitlements in nearly all euro area countries, are not included in household wealth.[5]
Household wealth is typically captured by the sector accounts concept “households’ net worth”, which is the value of the total assets of households minus the value of their total outstanding liabilities. Any changes in the stock of wealth over a period are the result of three components: net acquisitions of assets, valuation changes and other volume changes. Net acquisitions of non-financial assets mostly reflect net purchases less depreciation of dwellings and correspond to net housing investment; net acquisitions of financial assets are the net investment in those assets. Valuation changes are mostly captured by the development of house prices (for non-financial assets) and equity prices.[6]
The stock of households’ net worth in the euro area amounts to around seven times annual disposable income, highlighting the importance of wealth for household economic resources. Chart 1 shows that households’ net worth increased strongly from some 550% of disposable income in 2002 to around 700% in 2007, after having remained broadly stable in 2000-01, when the bursting of the dotcom bubble and the September 2001 terrorist attacks dampened financial wealth growth considerably. The rise in net worth between 2002 and 2007 mostly reflected the strong housing market dynamics and house price increases witnessed in several countries during this period, which resulted in a marked increase in housing wealth that was partly financed by increased debt.[7] Thereafter, as the global financial crisis erupted and concerns about the sustainability of prevailing asset price levels and private sector indebtedness increased, households’ net worth declined significantly as a percentage of disposable income, reflecting declines in both financial and housing wealth. The decline in households’ net worth amounted to €1.7 trillion between mid-2008 and early 2009. Following the strengthening of the economy and a recovery in asset prices, net worth increased slightly in 2009-10, before moderating again in the context of the European sovereign debt crisis, when net worth contracted by some €0.5 trillion between mid-2011 and early 2013. Since 2013 households’ net worth has increased steadily, and it stood at 710% of disposable income in mid-2019. Net worth growth has been supported by a further easing of monetary policy, resulting in an easing of financing conditions. This, together with the strengthening of the world economy, has led to an improvement in the euro area economy, higher asset prices and increases in housing and financial wealth.
Chart 1
Households’ net worth, assets by component and debt liabilities in the euro area
(stocks; percentages of nominal gross disposable income)

Sources: Eurostat, ECB, ECB estimates and ECB calculations.
Notes: Households’ net worth is defined as the sum of their housing wealth and financial wealth net of their debt liabilities. Households’ housing wealth includes dwellings and land underlying dwellings. Debt liabilities are defined as total liabilities net of equity issued and mainly consist of loans received from banks. The latest observations are for the second quarter of 2019.
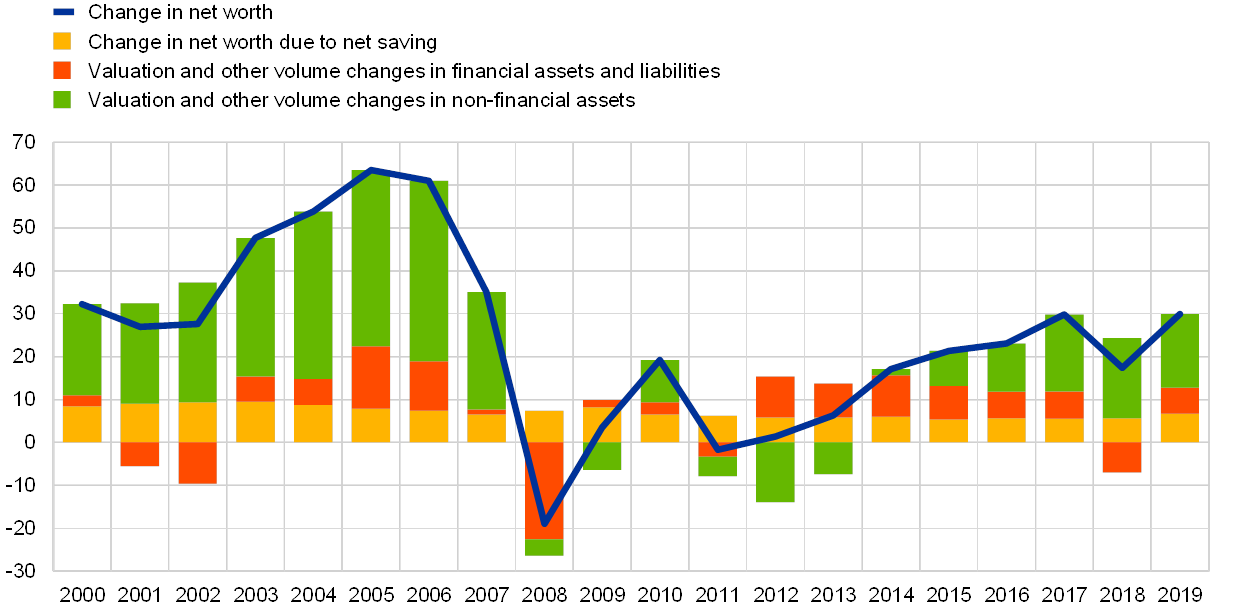
Changes in the net worth of euro area households are primarily driven by valuation gains and losses on real estate holdings. Chart 2 shows that their impact on net worth growth was particularly strong during the housing market booms experienced in a number of countries between 2002 and 2007 and between 2017 and mid-2019. Capital gains and losses on financial asset holdings have occasionally also significantly affected net worth growth. This was especially the case during 2001-02 when the dotcom bubble burst, in September 2001 in the wake of the terrorist attacks and in 2008 after the global financial crisis erupted. In contrast, the contribution of net savings to net worth growth remained relatively stable between 2000 and mid-2019. Chart 3 shows that valuation gains and losses on households’ real estate and financial asset holdings have followed changes in house and stock prices very closely, with correlations of 0.96 and 0.92, respectively. In addition, house price volatility is lower than stock price volatility and the house price cycle can deviate substantially from the stock price cycle.
Chart 2
Changes in the net worth of households in the euro area
(annual flows; percentages of nominal gross disposable income)
Sources: Eurostat, ECB and ECB calculations.
Notes: Change in net worth due to net saving comprises net saving, net capital transfers received and the discrepancy between the non-financial and the financial accounts. Valuation and other volume changes in financial assets and liabilities mainly comprise holding gains and losses on shares and other equity. Valuation and other volume changes in non-financial assets mainly comprise holding gains and losses on real estate (including land). The latest observations are for the second quarter of 2019.
Chart 3
Valuation changes in household non-financial and financial asset holdings and movements in asset prices in the euro area
(standardised annual percentage changes)

Sources: Eurostat, ECB, Thomson Reuters and ECB calculations.
Notes: The standardised annual percentage changes have been calculated by dividing the deviation of annual percentage changes from their mean by their standard deviation. The latest observations are for the second quarter of 2019.
Aggregate euro area household wealth developments have masked marked heterogeneity between countries in terms of both levels and dynamics. Chart 4 shows that, in Spain, the level of households’ total assets has been substantially higher as a percentage of disposable income than in other large euro area economies since the introduction of the euro. Households’ total asset holdings also increased at a markedly faster pace in Spain than in other countries between 2000 and 2007, supported by the housing market and credit boom, before moderating strongly between 2008 and 2013 following the subsequent bust and the necessary deleveraging of the banking and non-financial private sectors. At the same time, the fall in the assets-to-income ratio in Spain over this period was dampened by a strong decline in disposable income. In Germany, households’ total asset holdings have remained significantly lower as a percentage of income than in other large member countries. However, in recent years they have been growing at a considerably faster pace than in other countries, benefiting from robust housing market dynamics.[8]
Chart 4
Households’ total assets in the largest euro area countries
(stocks; percentages of nominal gross disposable income)

Sources: Eurostat, Bank of Spain, ECB estimates and ECB calculations.
Notes: Households’ total assets are defined as the sum of their housing wealth and financial wealth. Housing wealth includes dwellings and land underlying dwellings. The latest observations are for the second quarter of 2019.
The composition of household wealth varies significantly across countries. Chart 5 shows that the share of housing wealth in euro area households’ total assets increased from some 50% in 1999 to around 62% in 2008, supported by strong housing market dynamics and house price increases in a number of countries. Thereafter, the share declined until 2016, before increasing again slightly and stabilising close to the average pre-crisis level. Throughout this period the share of housing wealth in total assets has been much higher in Spain than in other large euro area countries, while in Germany it has been considerably lower for most of the time. The differences observed between countries in the share of housing wealth in total assets reflect a number of factors. These include differences in home ownership ratios, attitudes towards risk and credit, the role of government and non-residents in owning and letting housing, the composition of financial asset holdings, and house and stock price dynamics. In particular, the home ownership ratio is comparatively low in Germany.[9] Together with the differences in economic performance and income growth and possible measurement-related issues, these factors also largely explain the differences in household wealth levels and dynamics across countries.
Chart 5
Share of housing wealth in households’ total assets in the largest euro area countries
(stocks; percentages)

Sources: Eurostat, Bank of Spain, ECB estimates and ECB calculations.
Notes: Households’ total assets are defined as the sum of households’ housing wealth and financial wealth. Housing wealth includes dwellings and land underlying dwellings. The latest observations are for the second quarter of 2019.
Euro area households’ financial wealth consists mostly of liquid assets and pension and life insurance-related assets. Households’ financial wealth accounted for some 43% of their total assets on aggregate in the euro area in mid-2019. However, as indirectly shown in Chart 5 above, this share was significantly higher in Germany than in the euro area for much of the period since 1999 and considerably lower in Spain. At the aggregate euro area level, since 1999 households’ financial assets have mainly been in the form of currency and deposits and pension and life insurance products (see Chart 6). For both asset types, their share in households’ total financial asset holdings stood close to 34% in mid-2019, remaining considerably higher than the levels prevailing before the global financial crisis erupted.[10] Currency and deposits are more liquid and less risky than most other financial instruments, whereas pension and life insurance products are often contractual savings. Listed and unlisted shares and other equity, investment fund shares and debt securities accounted for around 19%, 9% and 2%, respectively, of households’ total financial asset holdings in mid-2019.[11] The shares of these riskier instruments in households’ total financial assets still remain below their pre-crisis levels, albeit recovering gradually (with the exception of debt securities) from their lows at the end of 2011 amid significant increases in stock and bond prices in recent years. Box 1 discusses developments in households’ securities holdings in the euro area and in the four largest euro area economies by issuing sector.[12]
Chart 6
Households’ financial asset holdings in the euro area by instrument
(outstanding amounts; percentages of nominal gross disposable income)

Sources: Eurostat, ECB and ECB calculations.
Notes: “Other” includes loans granted by households to all institutional sectors and other accounts receivable. The latest observations are for the second quarter of 2019.
Box 1 Households’ securities holdings in the euro area and the four largest euro area countries
Detailed statistics are collected and compiled by the Eurosystem regarding the most tradable assets held by households (as well as other institutional sectors), namely debt securities, listed shares and investment fund shares.[13]
In the five years from the first quarter of 2014 to the first quarter of 2019, households’ total holdings of these securities increased slightly at euro area level, from €3,539 billion to €3,707 billion. This increase was mainly driven by German households’ holdings, which grew by €246 billion. At the same time, holdings in Italy decreased by €223 billion, while movements in other euro area countries were more limited.
Chart A
Households’ securities holdings in the euro area by country and by instrument
(outstanding amounts, EUR billions)

Sources: ECB and national central banks.
For all instruments and most countries, the majority of the securities held were issued by residents of the same country, which may be regarded as evidence of a “home bias” (see Table A). In the largest euro area countries, for listed shares, this bias tends to be strongest in France and Spain, while being less pronounced in Italy. As regards debt securities, there is a marked preference for domestic debt securities in Italy, where 75% of the holdings are securities issued by Italian residents (down from 83% in the first quarter of 2014). Other large euro area countries also show a high proportion of domestic holdings, albeit to a lesser extent.
Table A
Proportion of outstanding amount of securities held by households and issued by residents of the same country in the first quarter of 2019

Sources: National central banks.
The value of debt securities held by euro area households dropped substantially between the first quarter of 2014 and the first quarter of 2019. This largely reflects net sales by households (as opposed to price changes) in a period marked by large purchases of debt securities by the Eurosystem under the asset purchase programme (APP). The sales were driven mainly by Italian households, which decreased their holdings of debt securities significantly, although their holdings still remained much larger than those of households in other euro area countries. The most prominent issuers of these securities were monetary financial institutions (MFIs) and the Italian government. The overall decline in holdings of non-euro area debt securities mainly reflected a net €22 billion reduction in holdings of UK debt securities.
Chart B
Households’ securities holdings in the euro area in the first quarter of 2014 and the first quarter of 2019 by issuing sector
(outstanding amounts, EUR billions)
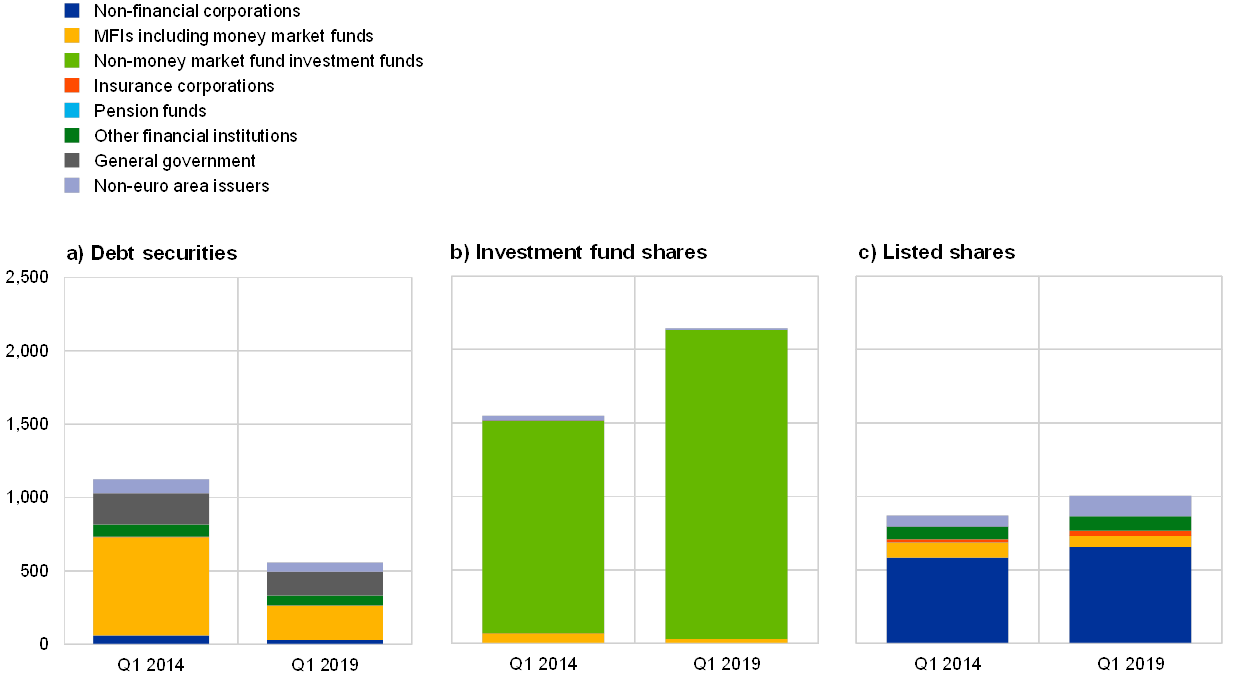
Sources: ECB and national central banks.
In parallel to disinvesting in debt securities, euro area households purchased, on a net basis, investment fund shares amounting to €402 billion over five years. As the prices of these securities also increased significantly over this period, portfolios of investment fund shares held by households increased by €598 billion overall. The increase was mostly due to German, Spanish and Italian households, while there was a slight disinvestment by French households. Holdings of non-euro area investment fund shares remained very limited (only €12 billion in the first quarter of 2019).
The value of euro area households’ holdings of listed shares increased between the first quarter of 2014 and the first quarter of 2019. However, this reflected a rise in prices over this period, excluding which there were net sales of listed shares. The price increases were led mainly by shares issued by non-financial corporations. Meanwhile, the value of holdings of shares issued by MFIs slightly decreased over the period, due both to falls in prices and to sales by euro area households. Holdings of listed shares issued by non-euro area residents nearly doubled over the period, owing to both net purchases and price increases. This increase was particularly noticeable for holdings of securities issued by US and Swiss residents, which together grew by more than €40 billion.
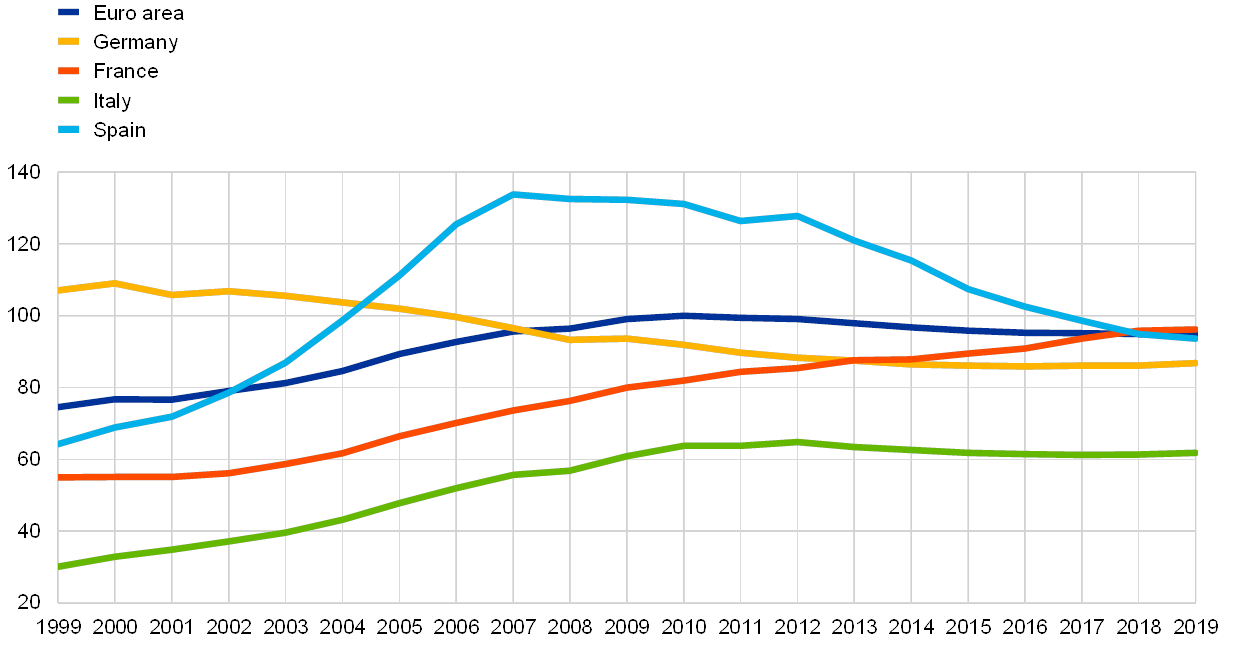
Aggregate euro area household debt figures also conceal a marked heterogeneity across countries in term of levels and dynamics. Chart 7 shows that household indebtedness increased strongly on aggregate in the euro area between 2002 and 2010 against the backdrop of the housing market and credit booms, with the increase being particularly large in Spain. Thereafter, the euro area household debt-to-income ratio moderated gradually, before stabilising in mid-2019 at close to its end-2007 levels. In Spain, household indebtedness has declined significantly from its peak – benefiting from significant net loan redemptions and debt write-offs – to stand slightly below the aggregate euro area level. In France, the household debt-to-income ratio has continued to edge upwards in recent years on account of buoyant mortgage developments. In Germany, household indebtedness steadily declined until 2016, before increasing marginally as debt financing growth exceeded income growth. In Italy, the household debt-to-income ratio has remained stable at moderate levels in recent years.[14]
Chart 7
Household debt in the largest euro area countries
(stocks; percentages of nominal gross disposable income)
Sources: Eurostat, ECB and ECB calculations.
Notes: Debt is defined as total loans granted to households by all institutional sectors. The latest observations are for the second quarter of 2019.
Aggregate euro area household wealth figures also conceal heterogeneity across households. Although household-level data are not available at quarterly frequency, a snapshot of the distribution of wealth is available every three years from the Eurosystem’s Household Finance and Consumption Survey (HFCS).[15] The latest survey results (for 2014) show that households’ portfolio composition is quite heterogeneous. A key dimension of heterogeneity is the income distribution. As illustrated in Chart 8, business wealth and financial assets, such as stocks and mutual funds, constitute an important portfolio share for households in the upper part of the income distribution. By contrast, low and middle income households mainly hold their wealth in the form of housing and deposits. If differences in income go along with differences in spending behaviour, the heterogeneity in portfolio composition could have implications for aggregate wealth effects on consumption.[16]
Chart 8
Household assets and debt by income quintile in the euro area
(x-axis: quintiles and deciles; y-axis: EUR thousands)

Source: The Household Finance and Consumption Survey, results from the second wave.
Notes: The chart shows the average value of assets and debt per household across five income quintiles. The top quintile is further broken down into two deciles. Housing wealth is composed of the households’ main residence and other real estate. Other assets include the value of households’ vehicles, voluntary pension/life insurance, shares, valuables, bonds, managed accounts and money owed to households.
3 Wealth effects on consumption
Wealth may have an impact on private consumption via various channels, which typically distinguish between financial and non-financial or housing wealth effects. A typical starting point is a life-cycle perspective in which consumer spending is determined by the lifetime resources available to consumers. Such resources are made up of human capital, typically captured by labour income, real capital, such as housing assets, and financial wealth, consisting of cash, bonds and equity. Household spending thus depends on both current and expected future cash flows. An increase in lifetime resources of consumers, including those related to wealth, should lead to higher consumption. Household (expected) cash flows also relate to (i) property income, (ii) collateral available for consumers to pledge, and (iii) confidence.[17] Interest and dividend income that households receive out of their wealth may be used for spending. Studies of collateral effects largely relate to housing, with a key role for mortgage equity withdrawal. The latter plays a rather limited role in the euro area compared to United Kingdom and the United States. Confidence may play a role, as consumers might feel more confident due to higher (valuations of) wealth and therefore save less and spend more. For example, a bullish stock market may make consumers feel more optimistic about the future of the economy and hence prompt them to increase their spending.
The impact of wealth on private consumption differs substantially across its components and depends crucially on some key features. A key difference between housing and financial wealth is the role of housing services in consumption. Higher house prices also increase the relative price of consuming housing services. Other key features include household preferences concerning wealth components and debt, the ease with which wealth components can be turned into liquid assets and whether valuation changes are perceived as permanent or temporary. For example, households might be less inclined to sell their owner-occupied houses in the presence of higher house prices than equities in the context of higher stock prices, partly due to higher transaction costs for houses than equities, but also due to their preferences. This also depends on the institutional setting. In countries with more sophisticated mortgage products (e.g. reverse mortgages or home equity loans), non-financial wealth can be made liquid more easily than some kinds of financial wealth, such as insurance products.
The direction of wealth effects at the macro level is, however, not always clear, because wealth components are typically not held equally by consumers. This applies in particular to housing wealth effects. As already mentioned at the start of Section 2, increases in house prices do not necessarily constitute an increase in wealth for the country as a whole. Similarly, it could be argued that fundamental changes in house prices, like other asset prices, represent only a redistribution of wealth between owners of housing and non-owners. Economy-wide there is no pure housing wealth effect from a change in house prices arising from a change in the fundamental value. There can, however, be a wealth effect related to house prices in periods when households are overly optimistic or pessimistic and the change in house prices reflects a change in the speculative bubble component of house prices.[18] Higher house prices can, however, result in redistribution effects, if those long on housing (landlords) spend differently out of their wealth from those short on housing (tenants). In addition, higher house prices improve the scope for mortgage equity withdrawal. The latter may boost consumption in the short run, but will depress it in the long run, as the increased debt will have to be serviced. Box 2 reports wealth effects as found in the literature for the euro area and the largest euro area countries.
Box 2 Estimates of wealth effects for the euro area and the largest euro area countries
Wealth effects are often reported in terms of the marginal propensity to consume (MPC) out of wealth (measured in cent per euro of wealth). This is the proportion of an aggregate rise in wealth that gets spent on consumption. The MPC out of wealth might vary by wealth level, and in micro studies the MPC is typically lower at higher wealth. At the macro level, which is the focus of this article, the empirical literature reports a wide range of MPCs out of wealth. Table A provides an overview of empirical estimates for the euro area and the four largest euro area countries.
In the literature, long-term housing wealth effects in the euro area are consistently found to be weaker than those of financial wealth, with the latter significantly positive. The estimated long-term MPC out of housing wealth in the euro area, as reported in various studies, ranges between −1 and +2 cent per euro and is not always significantly different from zero (see the upper half of Table A). In contrast, the long-term MPC out of financial wealth is always found to be significantly positive, ranging between 1 and 7 cent per euro (see the lower half of Table A). The median and average long-term housing wealth effects are close to zero in the euro area, whereas the median and average reported MPCs out of financial wealth are 1 to 4 cent per euro. Notwithstanding the low estimates of MPC out of wealth, contributions from wealth to consumption growth can be considerable in periods of large swings in asset prices.
Aggregated euro area wealth effects mask striking heterogeneity among the four largest euro area countries, with consistently positive estimated long-term MPC out of housing wealth for Spain and out of financial wealth for France and Spain. There are wide ranges of empirical estimates of the long-term MPC out of housing wealth and financial wealth for the four largest euro area countries. For the former, it varies between −7 and +8 cent per euro (see the upper half of Table A) and, for the latter, between −3 and +15 cent per euro (see the lower half of Table A). Spain is the only large euro area country for which consistently positive housing wealth effects have been estimated. Similarly, for France and Spain, only positive long-term MPCs out of financial wealth have been reported. Focusing on the median outcomes, given the wide range of estimates, the MPC out of housing wealth has been comparatively strong in Spain, at 3 to 4 cent per euro, and relatively weak in Germany and Italy, at 1 cent per euro. Long-term financial wealth effects have similarly been found to be strong in Spain, with an MPC of 4 cent per euro, and weak in Germany, with an MPC of 1 cent per euro.
Table A
Overview of estimated long-term MPC out of wealth in the euro area and the largest euro area countries in selected studies
(cent per euro)
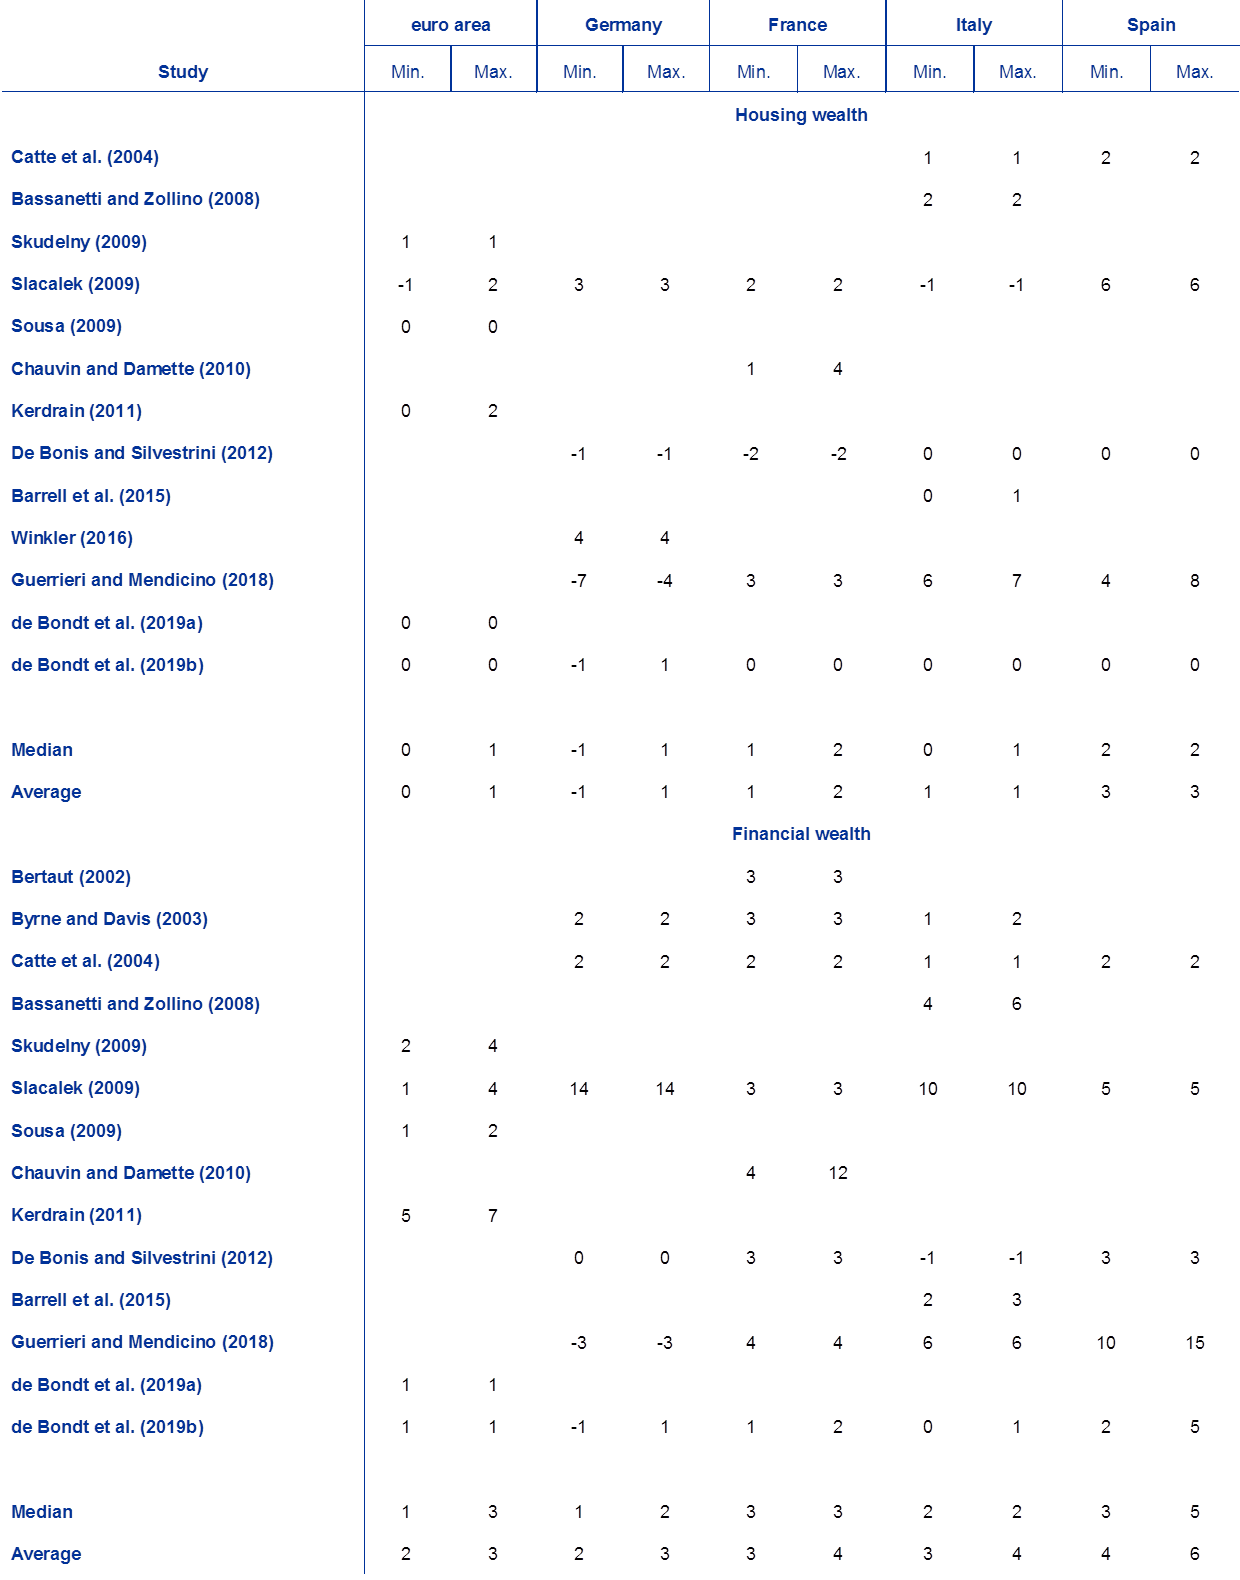
Source: de Bondt, G., Gieseck, A., Herrero, P. and Zekaite, Z., “Disaggregate income and wealth effects in the largest euro area countries", Working Paper Series, No 2343, ECB, December 2019.
4 Conclusions
Observing household wealth developments and understanding their impact on economic activity is important for the conduct of monetary policy. The stock of household wealth is currently about seven times households’ annual disposable income in the euro area. Movements in wealth are mainly driven by capital gains rather than net savings. Monetary policy may thus have an impact on wealth developments, notably via its impact on asset prices. Household wealth can both decline substantially (as in the aftermath of the global financial crisis) and increase significantly (as in the run-up to the global financial crisis and in recent years) and may thus at times contribute significantly to fluctuations in economic activity. It may also have an impact on the assessment of the appropriate monetary policy stance. Empirical analysis and estimates reported in this article suggest wide ranges for non-financial and financial wealth effects and substantial differences across euro area countries. In addition, wealth effects and the relative importance of non-financial wealth and financial wealth vary over time.
The broad nature of, and interplay between, channels through which household wealth may affect private consumption call for multiple perspectives in the assessment of the implications for the macroeconomy and monetary policy. Besides lifetime-related wealth effects, other channels relating to property income, collateral and confidence may play a role in relation to private consumption. In addition, the direction of wealth effects at the macro level is not always clear, because wealth components are typically not held equally by consumers. Some households benefit from rising house prices, whereas other are affected negatively. Given the rather limited role played by home equity withdrawal in the euro area, it is not surprising that long-term housing wealth effects in some euro area countries are estimated to be close to zero. More generally, wealth effects at the aggregated household sector level, which has been the focus of this article, might be different from those at the micro or household level. Finally, the creation of a capital markets union in the euro area would not only help firms to diversify their financing sources and improve their resilience to shocks emanating from the banking system but would also provide more investment opportunities for households and could facilitate the accumulation of wealth.
- For an overview of US-oriented literature, see Cooper, D. and Dynan, K., “Wealth effects and macroeconomic dynamics”, Journal of Economic Surveys, Vol. 30(1), 2016, pp. 34-55.
- For an overview of data availability, see Regulation (EU) No 549/2013 of the European Parliament and of the Council of 21 May 2013 on the European system of national and regional accounts in the European Union (OJ L 174, 26.6.2013, p. 1) and Guideline of the ECB of 25 July 2013 on the statistical reporting requirements of the ECB in the field of quarterly financial accounts (recast) (ECB/2013/24) (OJ L 2, 7.1.2014, p. 34). See also “European system of accounts – ESA 2010”, Eurostat, European Commission, 2013.
- To improve comparability across countries, non-financial wealth includes only housing wealth in this section, as data on other types of non-financial wealth are not available for all countries. This means that the assets owned by unincorporated businesses are not included.
- This is the case if the role of non-residents in owning and letting housing in the country is limited.
- See “Accrued-to-date pension entitlements in social insurance”, published by Eurostat. See also Box 2 in the article entitled “Social spending, a euro area cross-country comparison”, Economic Bulletin, Issue 5, ECB, 2019.
- Other volume changes relate to: (i) normal appearance and disappearance of assets and liabilities other than by transactions; (ii) changes in assets and liabilities due to exceptional events which are not economic in nature; and (iii) changes in statistical classification and structure. For valuation changes, movements in asset prices other than house and equity prices may also play a role.
- See Hofmeister, Z. and van der Helm, R., “Estimating non-financial assets by institutional sector for the euro area”, Statistics Paper Series, No 23, ECB, May 2017.
- A broadly similar picture emerges when comparing households’ net worth in the largest euro area countries.
- For differences in home ownership across European countries, see “The Household Finance and Consumption Survey: results from the second wave”, Statistics Paper Series, No 18, ECB, December 2016.
- See “Euro area economic and financial developments by institutional sector: second quarter of 2019”, ECB, October 2019.
- Nearly 80% of households’ direct holdings of shares and other equity consist of unlisted shares and other equity.
- Data on euro area households’ direct holdings of debt securities and listed shares and indirect holdings through investment funds and through insurance corporations and pension funds, broken down by issuing sector, are available on the ECB's website. See also the article entitled “The role of euro area non-monetary financial institutions in financial intermediation”, Economic Bulletin, Issue 4, ECB, June 2016.
- Who-to-whom tables are published on a quarterly basis in the euro area financial accounts, showing the issuing sectors of the securities held by each euro area investing sector, including households. National financial accounts shed further light on the issuing sectors in each country, including the extent to which investors have a “home bias”, i.e. invest preferentially in securities issued by residents of their own country. In addition, Securities Holdings Statistics, which are also available on a quarterly basis, provide additional information on the country and sector of issuers of securities, including non-euro area entities. These data are available since the beginning of 2014 and can be found on the ECB’s website in the Statistical Data Warehouse sections devoted to Sector Accounts and Securities Holdings Statistics, respectively.
- For the balance sheet structure of euro area households, see the box entitled “The structural dimension of the financing of non-financial corporations and households in the euro area”, Annual Report, ECB, 2017.
- The HFCS collects information on the assets, liabilities, income and consumption of households. See Household Finance and Consumption Network, “The Household Finance and Consumption Survey: results from the second wave”, Statistics Paper Series, No 18, ECB, December 2016; and Domanski, D., Scatigna, M. and Zabai, A., “Wealth inequality and monetary policy”, BIS Quarterly Review, March 2016.
- See, for example, Campbell, J.Y. and Cocco, J.F., “How do house prices affect consumption? Evidence from micro data”, Journal of Monetary Economics, Vol. 54(3), 2007, pp. 591-621; and Mian, A., Rao, K. and Sufi, A., “Household balance sheets, consumption, and the economic slump”, The Quarterly Journal of Economics, Vol. 128(4), 2013, pp. 1687-1726.
- For empirical evidence on (i), see de Bondt, G., Gieseck, A., Herrero, P. and Zekaite, Z., “Disaggregate income and wealth effects in the largest euro area countries”, Working Paper Series, No 2343, ECB, December 2019; on (ii), see Ifo Institute for Economic Research, “Institutional Features of Mortgage Markets across Countries”, CESifo DICE Report, Vol. 6(3), pp. 70-71, 2008; Haffner, M.E.A., Ong, R. and Wood, G.A., “Mortgage equity withdrawal and institutional settings: an exploratory analysis of six countries”, International Journal of Housing Policy, Vol. 15(3), 2015, pp. 235-259; and Haurin, D. and Moulton, S., “International perspectives on homeownership and home equity extraction by senior households”, Journal of European Real Estate Research, Vol. 10(3), 2017, pp. 245-276; and on (iii), see Karnizova. L. and Khan, H., “The stock market and the consumer confidence channel: evidence from Canada”, Empirical Economics, Vol. 49(2), 2015, pp. 551-573, 2015. European empirical evidence is reported in Jansen, W.J. and Nahuis, N.J., “The stock market and consumer confidence: European evidence”, Economics Letters, Vol. 79(1), 2003, pp. 89-98.
- For further reading on the argument of an economy-wide zero housing wealth effect, see White, W.R., “Measured wealth, real wealth and the illusion of saving”, keynote speech at the Irving Fisher Committee Conference on "Measuring the financial position of the household sector", Basel, 30-31 August 2006; and for the distinction between a change in the fundamental or bubble value of house prices, see Buiter, W.H., “Housing Wealth Isn’t Wealth”, Economics: The Open-Access, Open-Assessment E-Journal, Vol. 4, No 2010-22, 2010. A similar distinction is relevant for stock prices, see reported empirical evidence in de Bondt, G., “Equity wealth effects: fundamental or bubble-driven?”, Applied Economics Letters, Vol. 18(7-9), 2011, pp. 601-605.