
The economic implications of rising protectionism: a euro area and global perspective
The economic implications of rising protectionism: a euro area and global perspective
Published as part of the ECB Economic Bulletin, Issue 3/2019.
The risk of a trade war came sharply into focus in 2018, as protectionist threats by the US Administration and its trading partners were followed by concrete actions. Tensions rose over the summer and, while these have been defused on some fronts, the risk of further escalation remains material. The impact of the measures implemented so far on the global and euro area economic outlooks is expected to remain contained. However, large negative effects could materialise if trade tensions were to escalate further. Uncertainty related to protectionism is weighing on economic sentiment and it may raise further, potentially eroding confidence and affecting the euro area and the global economy more significantly. The complexity of intertwined international production chains could also magnify the impact. Against this backdrop, this article reviews the changes in the trade policy landscape over the past decade. It discusses the macroeconomic implications of the recent surge in protectionism and evaluates the possible effects that an escalation in trade tensions could have on the global economy and the euro area.
1 Introduction
Trade integration has slowed over the last decade. The process of trade integration started after the Second World War. It gained new impetus in the 1980s and had a golden age in the period 1990-2008, when total trade in goods and services increased from 39% to 61% of world GDP. Since then, trade has slowed (to its current 58% of world GDP), while protectionism has been on the rise, driven by an increase in non-tariff and, more recently, tariff barriers. At the same time, public support for globalisation has declined on both sides of the Atlantic. While factors such as Brexit and Euroscepticism have challenged the principles of freedom of movement and economic integration in Europe, the benefits of free trade have been openly called into question in the United States. Trade tensions escalated in 2018 and, as protectionist threats by the US Administration and retaliatory responses by its main trading partners were followed by concrete actions, the risk of a trade war came sharply into focus.
Rising protectionism could harm trade and activity. There is widespread consensus among economists on both the overall net benefits of trade openness and the need to cushion the negative impact it has had on certain groups in society. However, raising trade barriers is not the solution to the latter. Reversing trade integration may put at risk the net economic gains that it generated. By unravelling the long-term benefits of closer trade and investment links, retreating into protectionism also has the potential to unsettle global financial markets.
Against this backdrop, the article discusses the macroeconomic implications of rising protectionism and evaluates its effects on the global economy and the euro area. Section 2 puts the recent surge in trade tensions into context, discussing how the trade policy landscape has changed over the past decade. Section 3 reviews the measures announced by the US Administration in 2018 and the retaliation that ensued. Section 4 discusses the short and long-term macroeconomic implications of rising protectionism from a theoretical and model-based perspective. It also investigates whether the tariff measures implemented in 2018 may have already contributed to the progressive deterioration in global and euro area activity and trade in recent months, including via uncertainty effects. Section 5 concludes.
2 A changing trade policy landscape
The trade policy landscape has undergone a significant transformation over the last decade. The drive towards economic integration that characterised previous decades has now faded, which is evident in the slow pace of trade growth in recent years. Having expanded at approximately twice the rate of global GDP in the years leading up to the global financial crisis, the ratio of average imports to GDP growth – or the income elasticity of trade – has fallen to around 1 since 2011.[1] By 2016 there was a growing consensus that lower trade growth had become a permanent feature of the world economy. For example, ECB analysis[2] concluded that global trade was unlikely to revert to its pre-crisis trend and that post-2011 developments constitute a “new normal”.
Several reasons have been identified that explain the recent decline in trade activity, including compositional effects and structural factors. Analysis by the ECB and the International Monetary Fund (IMF)[3] suggests that geographical shifts in economic activity and changes in the composition of aggregate demand (e.g. to services, which are less trade intensive, although they are becoming increasingly more so) may have been weighing on the sensitivity of trade to economic activity. Specifically, it is found that around half of the slowdown in trade elasticity between the periods 1995-2007 and 2012-16 was due to compositional factors, namely the growing weight in the world economy of emerging market countries, which typically have a lower trade intensity than advanced economies. Moreover, countries such as China have progressively moved from being assemblers of foreign inputs to relying increasingly on domestic inputs. Other studies[4] suggest that further structural developments might have contributed to the decline in trade elasticity – these include waning growth in global value chains (GVCs), the relocation of production closer to final markets and the declining marginal impact of financial deepening.[5]
Chart 1
New trade measures announced
(left-hand scale: number; right-hand scale: percentages)
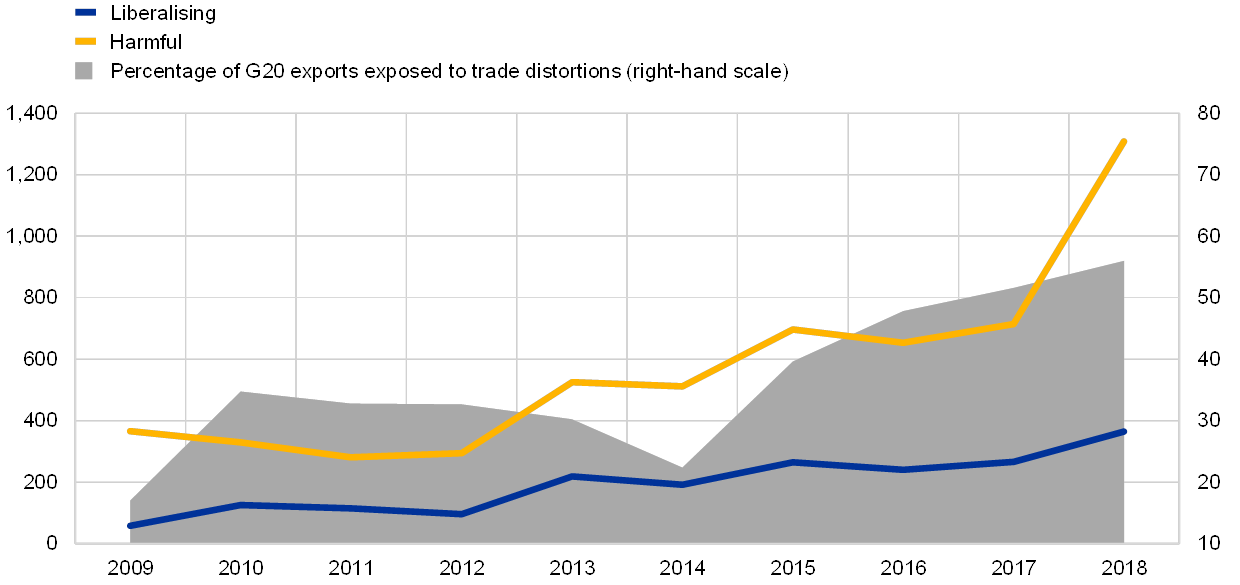
Source: Global Trade Alert database.
Notes: Data have been adjusted for reporting lags. The cut-off date for each year is 31 December.
Steadily rising protectionism may well be an additional factor driving the decline in trade activity. From the end of the Second World War, tariffs followed a downward trend that levelled off in both advanced and emerging market economies during the first part of the 21st century, before starting on an upward trajectory in recent months.[6] At the same time, the use of regulatory measures and non-tariff barriers such as export subsidies, restrictions on licensing or foreign direct investment, and domestic clauses in public procurement, has increased, leading to an overall surge in trade distortions.[7] According to data from the Global Trade Alert database encompassing traditional and non-traditional trade measures, the number of new discriminatory actions announced by G20 economies has risen steadily since 2012 and surged further in 2018 (see Chart 1). Anti-dumping measures[8] and import tariffs were the two most widely used instruments, together accounting for around 30% of all of measures imposed. The use of indirect measures, such as state loans to exporting companies, has also increased gradually.
The rise in protectionism implies that a progressively larger share of global trade has been affected by trade distortions. Data from the Global Trade Alert database show that by 2017 more than 50% of exports from G20 countries was subject to harmful trade measures, up from 20% in 2009 (see Chart 1). Accordingly, trade growth has decelerated more sharply in those sectors in which extensive discriminatory measures have been adopted than in sectors that have benefited from trade liberalisation.
Along with these developments, public support for trade openness has declined, while protectionism has increased globally. Perceptions of the risks associated with open trade have added to the broader list of concerns related to globalisation.[9] For example, free trade is sometimes believed to have made countries more vulnerable to international crises and spillovers from abroad. Given its distributional consequences, free trade is also considered to be a factor behind the rising inequality both within and across countries.[10] However, the merits of free trade are also widely recognised. International trade allows countries to specialise in the production of goods in which they have a comparative advantage, while at the same time enabling consumers to enjoy a greater variety of consumption goods. Empirical studies have found that trade openness has led to higher income per capita across countries, spurring productivity growth and helping to reduce poverty globally.[11] Nevertheless, the benefits of trade openness and their distribution across social groups vary between countries. Factors such as the nature of export specialisation, the degree of production diversification and the quality of a country’s institutions are found to be important pre-conditions for the benefits of trade openness to be fully realised.[12] Some have also challenged the benefits of free trade by claiming that “unfair practices” have damaged domestic growth and job creation.[13]
3 Tariffs announced by the US Administration in 2018
Protectionist threats made by the US Administration in 2017 have been followed by concrete actions over the past year. As shown in Chart 2, the implementation of tariffs on solar panels and washing machines in January 2018 came first, followed by tariffs of 25% on imports of steel and 10% on imports of aluminium for a wide range of countries in March 2018. After an initial exemption, in June 2018 the tariffs on steel and aluminium were also applied to Canada, Mexico and the European Union, which resulted in a raft of retaliatory measures. The European Union imposed a 25% duty on a range of US products worth USD 3.2 billion, which came into force in the same month. The US Administration in turn initiated a new investigation of automobile and auto parts imports to determine their effects on national security, hinting at the possibility of a 20%-25% tariff increase. Box 1 assesses the potential impact that this would have on the world economy and the euro area if it were to materialise.
Chart 2
Timeline of tariffs proposed and implemented in 2018
(USD billions)

Sources: Peterson Institute for International Economics, United States Trade Representative and ECB calculations.
Notes: The values of imports affected by the tariffs on washing machines and solar panels, and steel and aluminium refer to estimates produced by the Peterson Institute for International Economics. The percentages in brackets indicate the size of the applied tariffs.
Tensions with China escalated in the second half of 2018. Following an investigation by the US authorities into Chinese intellectual property practices, which concluded that China has a policy of forced technology transfer,[14] the US Administration initiated trade action against China.[15] The measures, implemented in July 2018, included 25% ad valorem duties on 1,300 product types imported from China, with an annual import value equivalent to USD 50 billion (see Chart 2). In September 2018 the US Administration announced a further wave of tariffs, targeting USD 200 billion of Chinese exports. China responded by imposing tariffs on exports from the United States worth USD 60 billion.
At the same time, there has been some de-escalation of trade tensions on other fronts. Concerns over tensions between the United States and the European Union eased after the summit held in July 2018. In addition, Canada, Mexico and the United States reached an agreement to replace the North American Free Trade Agreement with the United States-Mexico-Canada Agreement (USMCA), which effectively maintains tariff-free trade for most goods. A truce agreed between China and the United States on 1 December 2018, whereby tariffs on USD 200 billion of Chinese imports would remain at 10% rather than be increased to 25% as previously announced, defused the US-China trade tensions temporarily. Nevertheless, there is still a strong risk of renewed escalation.[16]
US tariffs against China target, in particular, the electronics and machinery sectors. The tariffs imposed directly on China affect a broad range of industries, with a total nominal value of USD 217 billion, or 2% of Chinese nominal value added. The industries most affected are those that produce electronic components, electrical equipment and machinery (see Chart 3a), which all feature in the Chinese government’s “Made in China 2025” industrial plan. With regard to the euro area, tariffs imposed by the United States affect around USD 5.5 billion of euro area value added, mainly in the basic metal and, to a lesser extent, the fabricated metal sectors.
Chart 3
Trade affected by tariff measures in 2018
(USD billions)
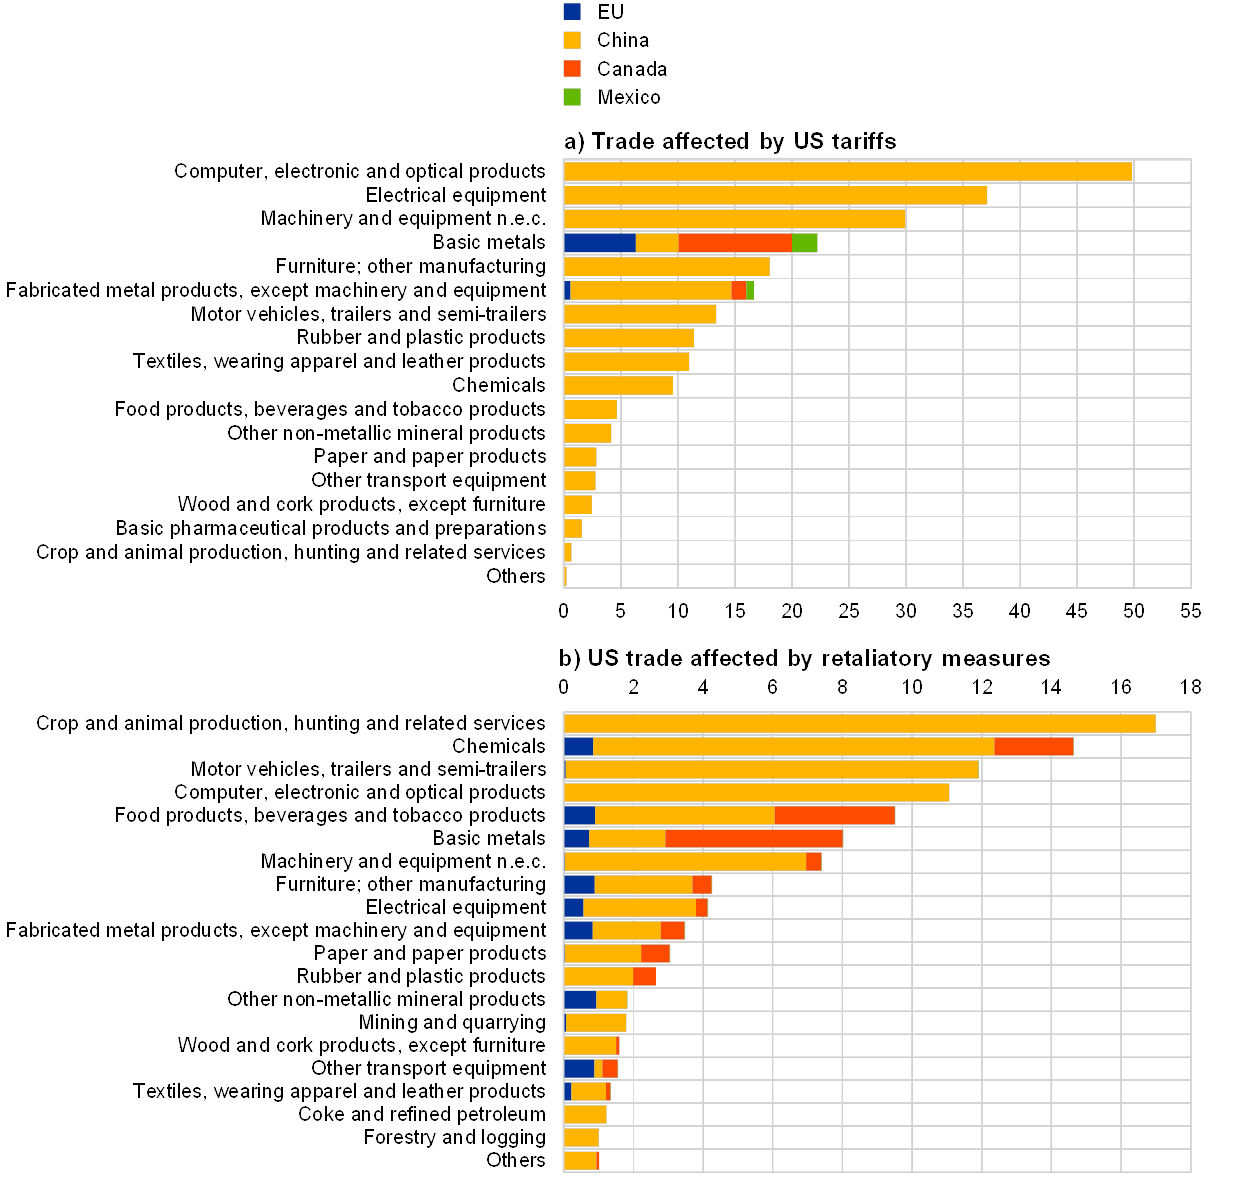
Sources: World Bank World Integrated Trade Solution (WITS), WTO and Comtrade.
Notes: The list of sectors is based on the two-digit ISIC Rev. 4 classification, and quantities have been aggregated from HS6 product lists of affected goods.
Retaliatory responses by the United States’ trading partners, particularly China, have targeted US imports across a wide variety of industries and sectors. The food, chemicals and car industries have been the sectors most affected by China’s retaliation (see Chart 3b), with tariffs affecting around 7.5% of those sectors’ combined value added. EU retaliatory measures have been much smaller and are targeting non-metallic minerals, electrical equipment, textiles, furniture, food products, other transport equipment (including light vehicles such as motorbikes) and chemicals, covering a total of 0.04% of US industrial value added.
The latest round of US tariffs imposed on China target a significant part of the two countries’ bilateral trade, while the share of euro area and global trade directly affected is still limited. As shown in Chart 4, the products targeted by the tariffs announced in the first half of 2018 by the US Administration and its trading partners affect relatively small shares of US (2%), euro area (0.2%), Chinese (2%) and world trade (0.4%). Their impact on the world economy is therefore likely to remain contained. By contrast, the latest round of US tariffs, coupled with China’s retaliation measures in September 2018, target almost half of China’s bilateral trade with the United States. As a result, around 12% of total US and 8% of total Chinese goods trade is affected. To some extent, these tariffs may weigh on activity in the United States and China, and the organisation of production in supply chains could further amplify the adverse effects. The share of euro area and world trade affected remains small (2%).
Chart 4
US tariffs and China’s retaliation measures: shares of US, Chinese and global trade affected
(percentage of total goods trade for the United States, China and the world)

Sources: IMF and ECB staff calculations.
4 The macroeconomic implications of rising protectionism
This section discusses the short and long-term macroeconomic implications of rising protectionism from a theoretical and a model-based perspective. Section 4.1 describes the channels through which higher tariffs may affect activity and trade. In view of the progressive deterioration in global and euro area activity and trade data in recent months, Section 4.2 investigates whether the tariff measures implemented in 2018 might have been a contributing factor, including as a result of uncertainty effects. Finally, Section 4.3 discusses the possible consequences of a renewed surge in trade tensions.
4.1 Channels of transmission of rising protectionism
Rising protectionism can affect economic activity through several channels. Higher import duties increase trade costs, which may alter both the quantity and the price of internationally traded goods. This is often referred to as the trade channel of transmission. The existence of complex global production supply chains can amplify this effect. In addition, higher trade costs can affect financial flows and credit conditions. This may occur, for example, if increased uncertainty over future trade policy leads to financial stress and a broad reassessment of risk premia. The way in which the different channels play out in a trade dispute, and the consequent impact on economic activity, depends on several factors, including whether trading partners retaliate and whether the dispute remains confined to a small number of countries, rather than developing into a full-blown trade war.
The impact on economic activity in the country imposing tariffs depends on a) whether imported goods can be substituted by domestic production, and b) whether trading partners retaliate. To the extent that the higher trade costs brought about by higher tariffs are not absorbed in lower profit margins for producers, import prices rise and relative prices change. Higher import prices push up domestic firms’ production costs and domestic inflation, thereby lowering households’ real disposable income. These effects weigh on consumption, investment and employment, and have a negative impact on activity. However, the higher prices of imported goods may also induce domestic customers to switch from imported to domestically produced goods. The relative importance of these two effects, and the net impact on economic growth, depends on the degree of substitutability between domestically produced goods and imported goods. If imported goods can be easily substituted through domestic production, consumption and activity rise.[17] The positive impact on activity could be lessened if the exchange rate appreciates following the increase in import prices.[18] In addition, if the trading partners hit by the tariffs retaliate – as is often the case – any potential benefit could be reversed. Domestic firms lose competitiveness in foreign markets, and exports and activity fall as a result. As such, rising trade distortions imply higher trade costs for all countries involved, which may hinder the optimal allocation of resources. All economies involved are, in the end, worse off.
In a trade dispute involving two countries, third countries may temporarily benefit from rising protectionism. Specifically, third countries can gain market share in countries where tariffs have risen. For example, in a trade dispute concerning exclusively the United States and China, euro area goods would gain competitiveness vis-à-vis US goods in China and vis-à-vis Chinese goods in the United States. This stems from the fact that higher tariffs make US goods more expensive in China and Chinese goods more expensive in the United States, with bilateral trade flows between the two eventually declining. The extent to which third countries benefit from this trade diversion depends on how easily a country can substitute imported products from different countries. Higher substitutability implies more trade diversion.
Chart 5
Production chain linkages in exports to the United States
(USD billions)

Sources: World Input-Output Database (2016 release), Wang, Z., Wei, S.J. and Zhu, K., (2013), “Quantifying International Production Sharing at the Bilateral and Sector Levels”, NBER Working Papers, No 19677, National Bureau of Economic Research, November 2013, and ECB staff calculations.
Notes: The latest observation is for 2014. The chart shows the breakdown of gross nominal exports to the United States into value added components. “Exporter’s value added in final goods consumed in the United States” refers to an exporter’s value added contained in final products exported to the United States; “Exporter’s value added in intermediate goods for US final production and exports” refers to an exporter’s value added contained in intermediate products which are used as input for US domestic production or the production of US exports; “Foreign value added content in exports” refers the foreign value added (either from the United States or from third countries) contained in exports; “double counted” refers to the value added of intermediate products which cross the borders several times; and “Exporter’s value added that goes to the United States through other countries” is the value added in intermediate products produced by an exporter which is used by third countries to produce goods to be exported to the United States. For the euro area aggregate, only extra-euro area countries are considered as other countries. The following abbreviations are used: CA for Canada, CN for China, MX for Mexico, JP for Japan and KR for South Korea.
While the pace of expansion might have slowed in recent years, GVCs remain highly fragmented and can amplify the impact of tariffs on trade and activity. GVCs have become increasingly complex, with goods crossing borders multiple times during the production process. Although analysis[19] by the Organisation for Economic Co-operation and Development (OECD) suggests that GVCs’ pace of expansion might have slowed since 2011, production remains highly fragmented across borders. This is well illustrated in Chart 5, which considers the GVC linkages embodied in exports of goods to the United States from several trading partners. In the case of the euro area, only around one-third of exports are consumed in the United States (see the blue parts in Chart 5). In fact, a significant share of euro area exports to the United States consists of intermediate goods which are used in the production of goods in the United States and then re-exported to third countries (see the yellow parts in Chart 5). In turn, domestic production and exports include intermediate inputs from third countries. For example, euro area exports to the United States include goods from countries that are closely embedded in European production chains, such as, for instance central and eastern European countries in the automobile sector (see the grey parts in Chart 5). Euro area exports also include value added from the United States itself (see the red parts in Chart 5). Finally, euro area exports are sometimes first shipped for processing to third countries, such as Mexico, before being exported to the United States (see the blue-shaded parts in Chart 5).
In a world characterised by complex GVCs, goods cross borders several times and tariff costs accumulate owing to the cascading effect. This occurs when tariffs are applied to intermediate goods. Intermediate inputs incur tariff costs every time they are shipped to another country for further processing. By the time the finished goods have reached the final consumer, the final price may have risen significantly. Moreover, imported intermediate goods are often used in domestic production. When these goods are subject to tariffs, domestic producers in the country imposing the tariffs may also suffer. Higher production costs are likely to be passed on through the various stages of the value chain, with demand, production and investment being negatively affected in all phases. In addition, tariffs are typically levied on a good’s gross value of imported goods. Therefore, if foreign inputs account for a large share of exports, a low nominal tariff can translate into a high value-added tariff for the exporter. Compared with a situation in which the entire value added of goods is produced domestically, tariffs may have a proportionally larger impact on the profits of exporting firms, thereby increasing the incentive to pass the higher costs on through the value chain. Third countries involved in intermediate stages of production may also face higher production costs, reducing the possible benefits of trade diversion.
An increase in uncertainty, coupled with financial stress, could also amplify the impact of rising protectionism on economic activity. There are several ways in which elevated uncertainty about future trade policies can dampen demand. For example, households may delay spending when economic prospects become more uncertain. Furthermore, firms may reassess their economic prospects amid rising uncertainty, taking a “wait and see” approach and postponing investment.[20] In response to uncertainty shocks, firms can also adjust their inventory policies by disproportionately cutting their foreign orders of intermediate goods, with a disproportionate impact on international trade flows.[21] An uncertain trade policy outlook may also give firms a reason to delay entering a foreign market or upgrading their technology. Finally, elevated uncertainty may push up borrowing costs for households and firms as investors demand greater compensation to protect themselves against future risks.[22] The materialisation of a global uncertainty shock, such as a trade war, may also drive investors to shift their portfolios to safe-haven currencies, with implications for the allocation of capital flows across countries.
Higher trade costs can also weigh on productivity. The tighter financing conditions associated with rising uncertainty can raise the cost of capital, with a negative impact on investment that could hinder productivity growth in the countries affected by the tariffs. Trade barriers can also lead to the misallocation of production factors across firms and countries. Less-open markets diminish global competition, thereby reducing incentives for innovation and technological advances, and keeping less-productive firms in the market. As a result, aggregate productivity may decline.[23]
4.2 Can the impact of the tariffs announced by the United States and its trading partners already be detected in the data? Some initial evidence
In the United States, firms operating in the targeted sectors seem to have initially circumvented part of the adverse impact of tariffs by frontloading their imports. US imports from China of products targeted by the US tariffs increased before the tariffs came into effect and declined in the aftermath (see Chart 6).[24] Total US imports also rose sharply, by 9.1% year on year in the third quarter of 2018, partly reflecting firms’ stockpiling. The increase was associated with a surge in inventories, while business investment declined. Although this suggests the presence of frontloading effects, the sharp rise in imports may also reflect buoyant US domestic demand on the back of procyclical fiscal stimuli and strong labour market conditions.
Chart 6
US imports from China and tariff implementation
(t = months of tariff implementation)

Sources: Census and ECB staff calculations.
Note: The data shown in the chart are for nominal imports.
Trade diversion effects may also be at play. In retaliation for US tariffs on Chinese goods, the Chinese authorities imposed a 25% tariff on Chinese imports of US soybeans in July 2018. While total Chinese imports of vegetable products (mostly soybeans) remained broadly stable following the announcement, imports from the United States were significantly lower than usual. However, imports from Brazil, which are unaffected by additional tariffs, have been rising more sharply than usual (see Chart 7).
Chart 7
Chinese imports of vegetable products by counterparty
(USD millions)

Sources: CEIC and ECB staff calculations.
Notes: The shaded areas show the range of values for imports of vegetable products from the United States and Brazil for each month of the year in the period 2010-17, in order to show the typical seasonal pattern. The latest observation is for September 2018.
The impact of rising tariffs on financial markets appears to have remained confined to the targeted sectors. Global financial markets have generally been resilient to the announcements of new tariffs. This may reflect the fact that they have thus far targeted only a small fraction of global trade. At the same time, US companies potentially affected by higher tariffs, such as those highly exposed to regions outside the United States in terms of revenue generation, have clearly underperformed (see Chart 8). An analysis by the ECB indicates that underperformance in the affected sectors can almost always be traced back to changes in risk premia, whereas fundamentals – such as earnings expectations and credit risk – do not change much.[25] Chinese equity prices were also harder hit in 2018 in the wake of several trade announcements.
Chart 8
Sectoral developments of equity returns
(x-axis: sectoral trade openness as a percentage; y-axis: cumulated percentage return after six tariff announcements)
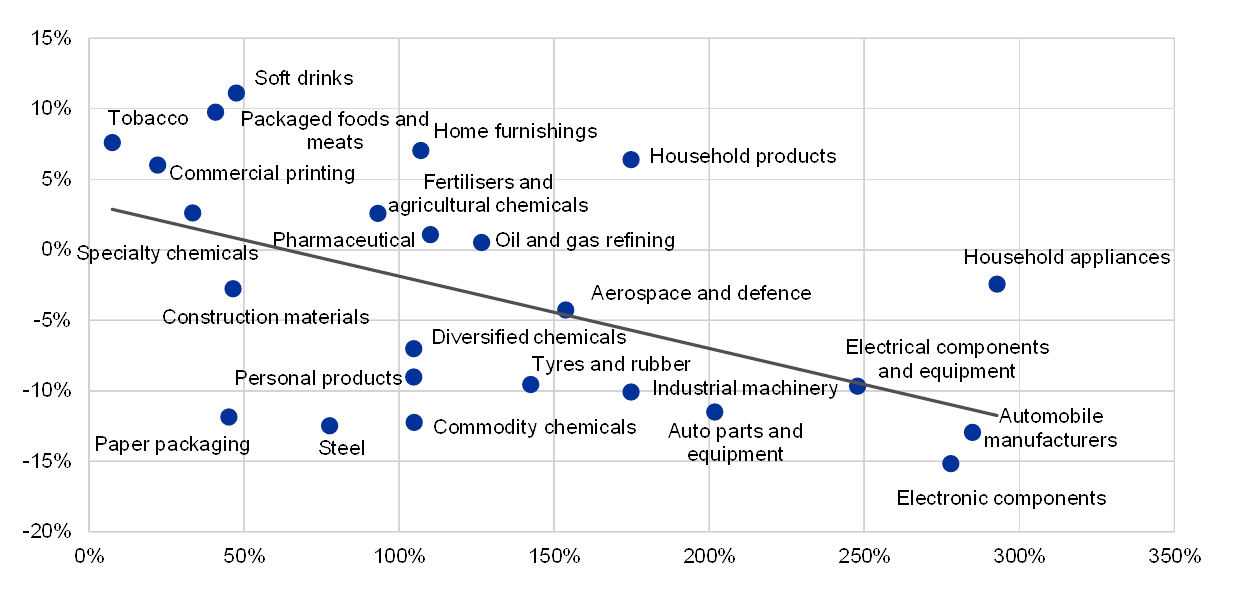
Sources: Haver Analytics, Bloomberg and ECB calculations.
Notes: The chart shows the cumulated shares reaction following six major US and China tariff announcements since the beginning of 2018. Sub-industries classified according to the eight-digit Global Industry Classification Standard (GICS) of the S&P 500 sectoral indexes were matched to imports/exports and value added data according to the three-digit and four-digit North American Industry Classification System (NAICS). Sectoral trade openness is calculated as the sum of imports and exports divided by gross value added in the respective sub-industry in 2016. The latest observation is for 5 October 2018. The GICS sub-industries shown in the chart constitute 35% of the market capitalisation of the five underlying sectors in the S&P 500 for which trade and value added data were available (Materials, Industrials, Consumer Discretionary, Consumer Staples and Information Technology) and 20% of the total market capitalisation of the S&P 500. The NAICS classifications used constitute 58% of the total US trade in goods in 2016.
Besides its impact on financial markets, rising protectionism can also affect sentiments more broadly. Recent survey-based indicators point to some tangible moderation in activity in China, with trade disputes often being identified as one of the factors contributing to the weak Chinese investment seen in recent quarters. However, this decline in investment might also have been driven by tighter domestic credit conditions. As discussed in Section 4.1, the extent to which Asian economies’ exports to China are embedded in China’s exports to the United States (e.g. as components of Chinese products), US tariffs could also impinge on their exports via the regional value chain. There seems to be a negative correlation between the exposures of Asian countries to the Chinese-US supply chain and the changes in countries’ manufacturing Purchasing Managers’ Index (PMI) since January 2018, which suggests that rising tariffs may be affecting sentiment across the region (see Chart 9). In the United States, consumer and business confidence indicators have fallen somewhat in recent months, although they remain close to historically high levels. US firms, however, have become increasingly worried about the effects of trade tensions, and a number of companies report that they have reassessed their capital investment plans in the light of tariff concerns.[26]
Chart 9
Changes in Asian countries’ manufacturing PMI and their indirect exposures to United States tariffs
(y-axis: change in manufacturing PMI since January 2018, in index points; x-axis: value added in US imports from China, as a percentage of country GDP)

Sources: OECD and ECB staff calculations.
Note: The countries shown are Australia (AU), Hong Kong (HKG), Indonesia (IDN), India (IND), Japan (JPN), Korea (KOR), Malaysia (MYS), Philippines (PHL), Singapore (SGP), Thailand (THA) and Taiwan (TWN).
Uncertainty related to rising protectionism might also have been affecting external demand for euro area goods. Extra-euro area exports have been particularly weak since the start of 2018, with the decline being driven mainly by a sharp deterioration in the manufacturing, machinery and transport equipment sectors (see Chart 10). Manufacturing exports are closely linked to trading partners’ investment growth and, historically, tend to display a relatively high negative correlation with some measures of uncertainty, such as the VIX[27]. While this suggests that uncertainty related to rising protectionism might have affected euro area exports, it is difficult to disentangle this possible effect from other factors, including the introduction of new emission standards in Europe, specific adverse changes to regulations in the car sector in China, financial turbulence in emerging markets and Brexit.
Chart 10
Euro area exports
(volume; three-month moving average of year-on-year growth rates and contributions)
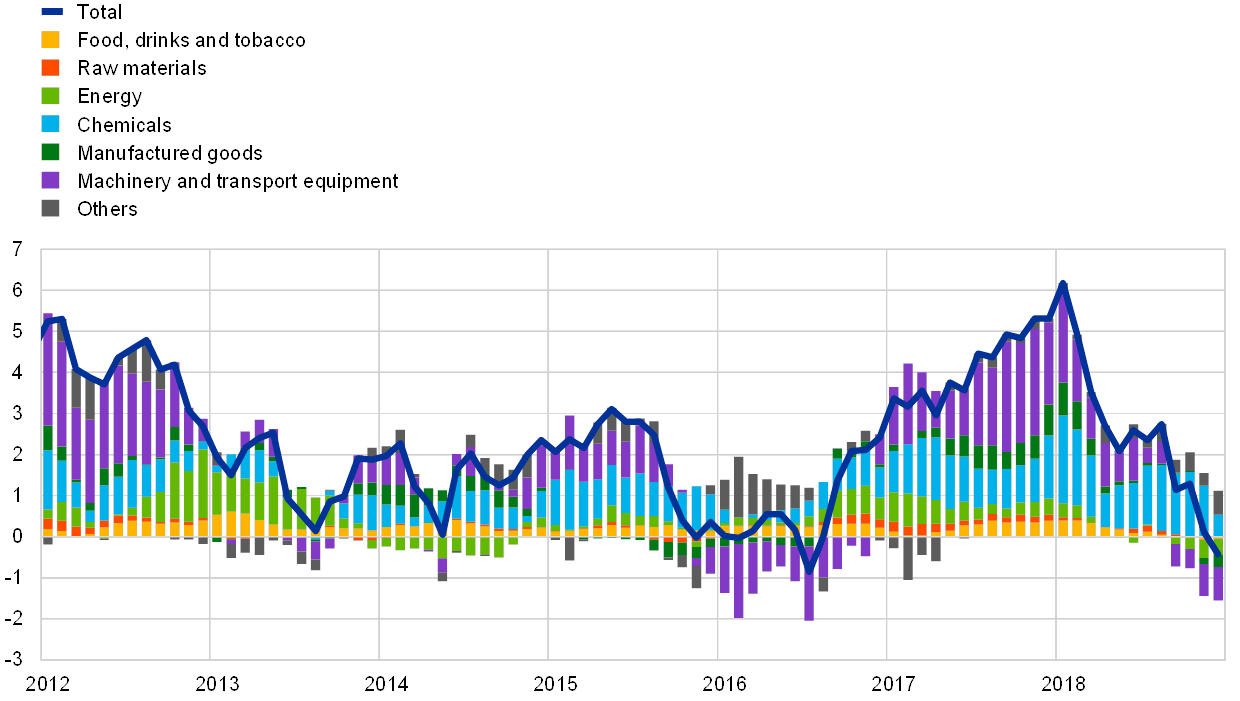
Sources: Eurostat and ECB staff calculations.
Note: The latest observation is for December 2018.
Higher trade uncertainty may also have caused euro area exporters to curb investment. Survey and model-based evidence shows that global uncertainty has an adverse effect on euro area business investment.[28] Chart 11 shows that in 2018 the capital expenditure to asset ratio of firms operating in sectors affected by the US tariff actions and threats (solar panels, washing machines, metal and cars) was lower than it was for firms operating in other sectors.[29] While investment in the two groups of firms showed similar dynamics before 2018, trends in the investment-to-asset ratio have been decoupling since then. Apart from this, investment dynamics might also have been affected by developments specific to the car sector.
Chart 11
Change in the investment-to-total-asset ratio of firms positively/negatively affected by tariffs
(year-on-year percentage change in investment-to-total-asset ratio)
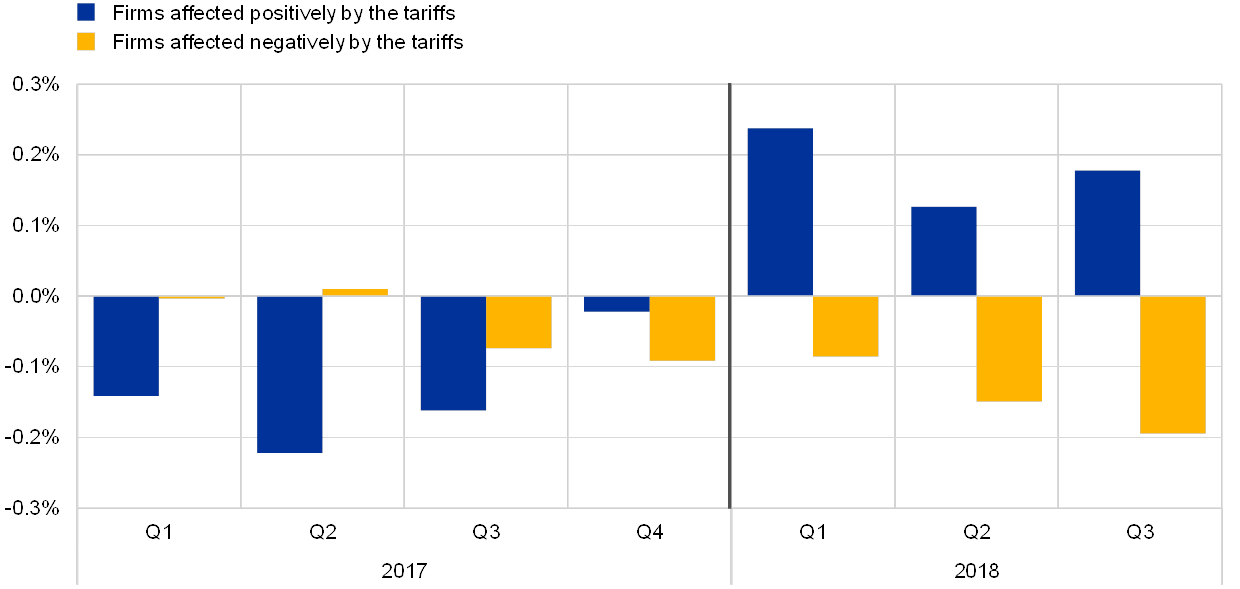
Source: Non-financial corporations (NFCs) in the Dow Jones Euro Stoxx 300 index.
Notes: The sample consists of NFCs in the Dow Jones Euro Stoxx 300 index and varies over time owing to data availability. The measure shown is the year-on-year percentage change in investment-to-total-asset ratio, defined as the ratio of capital expenditure to total assets. NFCs are grouped on the basis of whether they are positively (blue) or negatively (yellow) affected by the threat of tariffs in the simulations.
4.3 What might be the impact of a renewed escalation of trade tensions? Some model-based simulations
The risks related to a further exacerbation of trade tensions remain prominent, as more concrete actions could follow. To assess the impact of a renewed escalation of trade tensions, this subsection investigates the scenario of a hypothetical trade war in which the United States increases tariff and non-tariff barriers on imports from all trading partners by 10%, and the other countries retaliate symmetrically. The impact would, of course, be much more pronounced in the case of a free-for-all, full-blown trade war.
Despite their limitations, model-based estimates can help to gauge some of the medium and long-term implications of an escalation in trade tensions. Two different methodologies are used to shed light on both medium and long-term outcomes. The IMF’s Global Integrated Monetary and Fiscal Model (GIMF)[30], in combination with the ECB’s Global model[31], are employed to investigate the effects of a trade war scenario over a medium-term horizon. Under this scenario, not only trade, but also confidence effects are assessed.[32] In order to gauge the long-term (steady-state) implications for trade, a multi-country and multi-sector general equilibrium model is used. In this model, tariff and non-tariff barriers are assumed to be 10% higher on a permanent basis, thereby allowing long-term predictions to be made.[33]
In the simulations of medium-term effects, an escalation of trade tensions might have a significant direct impact on US activity, compounded by heightened financial stress and a drop in confidence. An increase in tariff and non-tariff barriers on imports induces domestic consumers and firms to switch to domestically produced goods. However, this effect is likely to be more than offset by the increase in prices and the reduction in exports resulting from the retaliatory measures taken by all trading partners. Consequently, the direct effects on US GDP are negative and could lower activity by 1.5% (relative to the baseline after the first year). Confidence effects stemming from a tightening of financing conditions could depress US GDP further. For the purpose of this scenario, confidence effects are simulated assuming an increase in corporate bond risk premia of 50 basis points and a fall in stock prices of two standard deviations in all countries.[34]
Although some countries may initially benefit from trade diversion, global trade and global activity are expected to decline significantly. Chinese producers may improve their competitiveness in third countries vis-à-vis US producers, as all US trading partners would raise tariff and non-tariff barriers on imports from the United States in the simulated scenario (see Chart 12 for the first-year effects). Therefore, in this simulation, the trade effects on China’s GDP are slightly positive (+0.6%) and are only partially outweighed by confidence effects. Turning to the euro area, despite some possible gains in export market shares, the spillovers arising from the deterioration in global confidence would most probably outweigh the gains in competitiveness, thus causing an overall modest decrease in activity. Finally, global trade and global activity could fall by more than 2.5% and 1% respectively as a result of the combined negative effects via the trade and the financial channels.
Chart 12
Estimated impact of an escalation in trade tensions – first-year effects
(GDP response, deviation from baseline levels; percentages)

Source: ECB calculations.
Notes: The results are a combination of the direct trade effects derived from the GIMF model and the confidence effects modelled using the ECB’s global model.
Heightened trade tensions could also have pronounced long-term effects on US exports and imports. In the model simulations, the steady-state effects account for trade through supply chains, although they disregard financial channels and the confidence effects that might arise in the medium term.[35] In the long term, consumers and producers could fully switch to products from domestic or third markets, while some production processes could be partly relocated to destination markets affected by the measures. In the United States, trade flows could be severely affected, with real exports declining by 26.6% and imports decreasing to a lesser extent (22.8%), with an overall negative net trade effect on activity. The large impact on US flows reflects the fact that US exports to and imports from all trading partners face higher tariffs. By contrast, China is likely to incur more limited losses (see Chart 13), as lower exports to the United States are partly offset by higher exports to those countries in which China has improved its price competitiveness vis-à-vis US producers. Similarly, other countries could improve their competitiveness in Chinese markets at the expense of the United States, replacing them as a source of exports to China.[36]
Chart 13
Estimated impact of an escalation in trade tensions on trade – long-term effects
(deviations from current real trade as a percentage)

Sources: World Input-Output Database (2016 release) and ECB staff calculations.
Notes: Changes in total real exports and imports have been aggregated from changes in sector-level real bilateral trade by using shares of corresponding nominal values. Nominal bilateral sector-level trade changes have been deflated by the respective price changes. The euro area includes both intra- and extra-euro area trade. CN is used as an abbreviation for China.
For the euro area, the trade effects would be relatively contained. The impact through the trade channel on the euro area’s trade would be small overall, with heterogeneous effects across countries and sectors (see Chart 13). However, the effects of an escalation of trade tensions could be more pronounced owing to uncertainty effects and productivity losses.
Box 1 Assessing the impact of the threat of auto tariffs on the global economy and the euro area
This box assesses the possible impact of an increase in tariffs on automotive imports to the United States. The simulations assume an increase in tariffs on US car imports from all trading partners except Canada and Mexico.[37] Trading partners would retaliate symmetrically[38].
Vehicle production is organised in very complex cross-border supply chains. Sector interconnectedness is extremely high across the countries party to the United States-Mexico-Canada Agreement (USMCA). Taken together, vehicles assembled in Canada and Mexico and exported to the United States contain levels of US value added as high as 22% (see the red part in Chart A). Conversely, vehicles imported from Japan, Korea and Germany have little US content (around 2%). Exports to the United States also consist of intermediate inputs used by the US domestic vehicle industry to produce cars for domestic consumption and export (see the yellow part in Chart A). Therefore, while tariffs on US car imports could be discriminatory against foreign producers, US domestic production and exports could also suffer from the increase in the prices of car parts (proportionately to the red and the yellow parts in Chart A). In particular, foreign carmakers exporting to the United States would be affected by tariffs on products exported directly to the United States (see the blue part in Chart A) and, to a smaller extent, indirectly through products exported via other countries (see the blue-shaded part in Chart A). However, they would not be affected with regard to the value added content of exports which is attributable to third countries or with regard to the share of exports – this is merely back-and-forth trade which does not involve any value added (see the grey part in Chart A).
Chart A
Production chain linkages in vehicle exports to the United States
(exports to the United States; USD billions)

Sources: World Input-Output Database (2016 release), Wang, Z., Wei, S.J. and Zhu, K., “Quantifying International Production Sharing at the Bilateral and Sector Levels”, NBER Working Papers, No 19677, National Bureau of Economic Research, November 2013, and ECB staff calculations.
Notes: The latest observation is for 2014. The chart reports the breakdown of gross nominal exports to the United States into value added components. “Exporter’s value added in final goods consumed in the United States” refers to an exporter’s value added contained in final products exported to the United States; “Exporter’s value added in intermediate goods for US final production and exports” refers to an exporter’s value added contained in intermediate products which are used as input to US domestic production or to the production of US exports; “Foreign value added content in exports” refers to the foreign value added (either from the United States or from third countries) contained in exports; “double counted” refers to the value added of intermediate products which cross borders several times and “Exporter’s value added that goes to the United States through other countries” is the value added in intermediate products produced by an exporter which is used by third countries to produce exports to the United States. For the euro area aggregate, only extra-euro area countries are considered as other countries. The following abbreviations are used: CA for Canada, CN for China, MX for Mexico, JP for Japan and KR for South Korea.
The steady-state effects of an increase in tariffs on US vehicle imports would be concentrated in the car sector. Simulations performed using the multi-country multi-sector general equilibrium model described above suggest that US consumers could switch to vehicles produced in the United States or in Mexico and Canada (which are not subject to the tariff measure) and the production of vehicles would be partly relocated there. As a consequence, the car industry in the United States would increase its value added by 12% (0.1% of US nominal value added) as, also, would Canada and Mexico (14% and 10% increase in value added respectively). In terms of value added, the Japanese and the euro area car sectors would incur a loss of around 10% and 4% respectively. Retaliatory tariffs and the increase in input prices could affect other sectors in the United States, thereby offsetting the positive effect arising from gains in competitiveness for US car producers.
The effects of tariffs are amplified by the car industry’s cross-border global value chains (GVCs). Chart B compares the welfare effects deriving from the multi-sector model with global GVC effects in place against the same model, but with trade attributed only to final goods (so that the amount of trade subject to tariffs stays the same). Trade between sectors within a country is also totally attributed to final goods – in the model without GVCs, tariffs would only be applied once a final good crossed a border. The results confirm that the organisation of car production in supply chains involving several stages of production in several countries (see Chart A) plays an important role in transmitting tariff effects: failing to account for the GVC-related trade in the sector-level model would understate the welfare effects by at least 10% in the case of the euro area. The amplifying effects of GVCs are even more evident in the case of the United States, whose car sector relies heavily on imported intermediate inputs. The role of GVCs is particularly interesting in the case of Canada. Without accounting for GVC effects, Canada would experience some gains in terms of welfare. However, when the indirect and loop effects of tariffs through supply chains (e.g. increase in prices also through tariffs affecting the United States) are taken into account, the welfare effects turn negative.
Chart B
Welfare effects of tariffs
(deviation from non-tariff welfare as a percentage)

Sources: World Input-Output Database (2016 release) and ECB staff calculations.
Notes: Welfare is defined as real household income. The following abbreviations are used: CA for Canada, CN for China, MX for Mexico, JP for Japan and KR for South Korea.
Overall, the impact of rising tariffs on cars is assessed as being more pronounced for car-exporting countries and could be intensified by confidence effects. Although world unit production of cars is large, the auto industry accounts for only a small share of value added in most countries. It is estimated that the impact on the euro area as a whole would be small, even when the magnifying effects of global supply chains are taken into account. However, the consequences of an increase in car tariffs may weigh significantly on some countries. It is assessed that a possible increase in tariffs would have some negative effects in the United States and in those countries with a large exposure to the US market – chiefly South Korea and Japan. In addition, confidence effects or the effects of uncertainty with regard to the car industry that have not been taken into account could have a more negative impact on the world economy.
5 Conclusions
Taken in isolation, the repercussions of the tariffs implemented in 2018 pose only a modest adverse risk to the global and euro area outlooks. Preliminary evidence indicates that, in order to circumvent the effects of rising tariffs, firms operating in the targeted sectors may have been frontloading their import orders. While trade flows in the affected sectors may have started to decelerate after the tariffs came into effect, particularly in China, the impact of implemented tariffs and tariff announcements owing to uncertainty effects appears to have remained confined to the targeted sectors for the time being.
If trade tensions were to escalate once again, however, the impact would be larger. Model-based simulations indicate that the medium-term direct impact of an escalation could be sizeable, compounded by heightened financial stress and a drop in confidence. Despite some trade diversion effects, euro area and global trade and, therefore, activity, would decline. The longer-term effects would be even more pronounced.
Trade liberalisation within the framework of multilateral cooperation has been a key factor driving global economic prosperity. Trade integration helped to drive economic growth in advanced and developing economies in the second part of the 20th century, while also helping to pull hundreds of millions of people out of poverty. At the same time, although free trade is often seen as one of the factors behind rising inequality both within and across countries, winding back globalisation is the wrong way to address these negative effects. A retreat from openness will only fuel more inequality, depriving people of the undisputed economic advantages that trade and integration bring. Instead, countries should seek to resolve any trade disputes in multilateral fora. By encouraging regulatory convergence, multilateral cooperation helps to protect people from the unwelcome consequences of openness, and therefore remains crucial as a response to concerns about the fairness and equity of trade. The distributional and social effects of greater economic integration should also be addressed by targeted policies that achieve fairer outcomes, including, for example, redistributive policies or adequate training and educational measures.
- In countries that are not financially globalised, investment must be funded by domestic savings. In countries that are financially globalised, investment can also be funded through borrowing from abroad, hence domestic investment and domestic savings are not as closely correlated. The correlation between domestic savings and investment across OECD countries bounced back to almost 70% in 2017, from less than 50% between 2000 and 2006 – a further sign that the process of de-globalisation might have become entrenched.
- See “Understanding the weakness in global trade: what is the new normal?”, Occasional Paper Series, No 178, ECB, September 2016. See also Constantinescu, C., Mattoo, A. and Ruta, M., “The Global Trade Slowdown: Cyclical or Structural?”, IMF Working Papers, No 15/6, International Monetary Fund, Washington, DC, 2015; and Haugh, D. et al., “Cardiac Arrest or Dizzy Spell: Why is World Trade So Weak and What can Policy Do About It?”, OECD Economic Policy Papers, No 18, OECD Publishing, Paris, 2016.
- See World Economic Outlook, IMF, October 2016.
- See Constantinescu, C., Mattoo, A. and Ruta, M., “The Global Trade Slowdown: Cyclical or Structural?”, The World Bank Economic Review, The World Bank, May 2018; and ECB Working Group on Global Value Chains, “The impact of global value chains on the euro area economy”, Occasional Paper Series, (forthcoming).
- See Gächter, M. and Gkrintzalis, I., “The finance-trade nexus revisited: Is the global trade slowdown also a financial story?”, Economics Letters, Elsevier, Vol. 158(C), September 2017, pp. 21-25.
- See the box entitled “Implications of rising trade tensions for the global economy”, Economic Bulletin, Issue 3, ECB, 2018.
- Trade policies have been driven by unilateral actions. Since the Doha trade round came to a standstill, countries have increasingly relied on preferential trade agreements (PTAs) in order to gain access to new markets and resolve trade-related issues that are currently not addressed within the World Trade Organization (WTO). The number of PTAs surged from 50 in the early 1990s to around 200 in the early 2000s. All WTO members have concluded at least one PTA; some, such as the European Union, Chile and Mexico, have concluded more than 20.
- Further information on the use of anti-dumping measures according to WTO rules is available on the WTO’s website.
- Draghi, M., “Sustaining openness in a dynamic global economy”, speech at the Economic Policy Symposium of the Federal Reserve Bank of Kansas City, Jackson Hole, 25 August 2017.
- See, for example, Antràs, P., de Gortari, A. and Itskhoki, O., “Globalization, Inequality and Welfare”, Journal of International Economics, No 108, September 2017, pp.387-412; and Rodrik, D., “The Globalization Paradox: Democracy and the Future of the World Economy”, W.W. Norton, New York and London, 2011. However, other factors, such as technological change, were also identified as drivers of the rising inequality. For a review of the literature, see Helpman, E., “Globalization and Wage Inequality”, NBER Working Papers, No 22944, National Bureau of Economic Research, December 2016.
- The Role of Trade in Ending Poverty, The World Bank and World Trade Organization, 2015.
- See, for example, Helpman, E, “Globalization and Wage Inequality”, NBER Working Papers, No 22944, National Bureau of Economic Research, December 2016; and Rodrik, D., Subramanian, A. and Trebbi, F., “Institutions Rule: The Primacy of Institutions Over Geography and Integration in Economic Development”, Journal of Economic Growth, Vol. 9, No 2, June 2004, pp.131-165.
- For instance, forced intellectual property transfers from multinational companies investing in China are a long-standing concern, in both the United States and the European Union. For an account of recent disputes on technology transfer and intellectual property rights, see Jiming, H. and Posen, A.S. (eds.), “US-China Economic Relations: From Conflict to Solutions”, PIIE Briefing, January 2019.
- The investigation concluded that “China uses foreign ownership restrictions, including joint venture requirements, equity limitations, and other investment restrictions, to require or pressure technology transfer from U.S. companies to Chinese entities”. In addition, it was found that “China also uses administrative review and licensing procedures to require or pressure technology transfer which, inter alia, undermines the value of U.S. investments and technology and weakens the global competitiveness of US firms”. For more information on the investigation, see the Office of the United States Trade Representative’s March 2018 press release.
- For further information on the tariffs imposed under the Section 301 investigation of Chinese intellectual policy practices, see the Office of the United States Trade Representative’s June 2018 press release.
- On 8 April 2019 the Office of the United States Trade Representative released a list of products to which additional tariffs are to be applied in response to harm allegedly caused by European Union aircraft subsidies. It also confirmed that the value of goods to be targeted is subject to an arbitration at the WTO, the result of which is expected in the summer.
- According to the economic literature, the dynamic effects of protectionism are similar to a negative supply-side shock, as its effects are recessionary and inflationary, with an ambiguous or minor impact on the trade balance. See Barattieri, A., Cacciatore, M. and Ghironi, F., “Protectionism and the Business Cycle”, NBER Working Papers, No 24353, National Bureau of Economic Research, February 2018; and Furceri, D. et al., “Macroeconomic Consequences of Tariffs”, NBER Working Papers, No 25402, National Bureau of Economic Research, December 2018.
- See Erceg, C., Prestipino, A. and Raffo, A., “The Macroeconomic Effects of Trade Policy”, International Finance Discussion Papers, No 1242, December 2018. This paper shows that when tariffs are used in combination with export subsidies and this policy is expected to remain in place for a limited period, the exchange rate may not be able to fully offset the expenditure-switching effects of the policy, and this may have an expansionary impact. However, this is driven mostly by export subsidies (while tariffs have negligible or contractionary effects) and only applies if foreign countries do not take retaliatory measures.
- See Trade Policy Implications of Global Value Chains, Trade Policy Brief, OECD, December 2018.
- See Bloom, N., “The Impact of Uncertainty Shocks”, Econometrica, Vol. 77, No 3, May 2009; and Handley, K. and Limão, N., “Trade and Investment under Policy Uncertainty: Theory and Firm Evidence”, American Economic Journal: Economic Policy, Vol. 7, No 4, November 2015, pp.189-222.
- See Novy, D. and Taylor, A.M., “Trade and Uncertainty”, CEP Discussion Papers, No 1266, Centre for Economic Performance, The London School of Economics and Political Science, May 2014; and Handley, K. and Limão, N., “Trade and Investment under Policy Uncertainty: Theory and Firm Evidence”, American Economic Journal: Economic Policy, Vol. 7, No 4, November 2015, pp.189-222.
- See Goldberg, P. and Pavcnik, N., “The Effects of Trade Policy”, in Bagwell, K. and Staiger, R.W. (eds.), Handbook of Commercial Policy, Volume 1, Part A, February 2016.
- See Melitz, M.J., “The Impact of Trade on Intra‐Industry Reallocations and Aggregate Industry Productivity”, Econometrica, Vol. 71, No 6, November 2003, pp. 1695-1725; and Berthou, A. et al., “Quantifying the losses from a global trade war”, Eco Notepad, Banque de France, for a review and an analysis of the impact of trade openness on aggregate productivity.
- See Amiti, M., Redding, S.J. and Weinstein D.E., “The Impact of the 2018 Trade War on U.S. Prices and Welfare”, CEPR Discussion Papers, No 13564, March 2019. This paper finds that tariffs imposed on US imports in 2018 were completely passed through to domestic prices of targeted goods and implied a decrease in imports in affected sectors by around 54%, relative to those in the unaffected sectors.
- For a further analysis of the financial stability implications of rising protectionism, see Dizioli, A.G. and van Roye, B., “The resurgence of protectionism: potential implications for global financial stability”, Financial Stability Review, ECB, November 2018.
- Survey of Business Uncertainty conducted by the Federal Reserve Bank of Atlanta, Stanford University and the University of Chicago Booth School of Business in July 2018.
- Volatility index created by the Chicago Board Options Exchange.
- See the box entitled “Driving factors of and risks to domestic demand in the euro area”, Economic Bulletin, Issue 1, ECB, 2019.
- A multi-country, multi-sector model simulates the effects of tariffs that have already been implemented (from official lists) and the threat of tariffs on US car imports and the respective retaliations against sectors in the United States. The model identifies sectors that are negatively affected by the tariff measures and sectors that benefit from the tariff measures (through trade diversion).The resulting effects include an indirect impact on competitiveness and supply chains.
- See Kumhof, M. et al., “The Global Integrated Monetary and Fiscal Model (GIMF) – Theoretical Structure”, IMF Working Papers, No 10/34, IMF, February 2010.
- See Dieppe, A. et al., “ECB-Global: Introducing the ECB’s global macroeconomic model for spillover analysis”, Economic Modelling, Vol. 72(C), June 2018, pp. 78-98.
- The scenario reproduces model-based simulations as reported in the box entitled “Macroeconomic implications of increasing protectionism”, Economic Bulletin, Issue 6, ECB, September 2018; and in Cœuré, B., “The consequences of protectionism”, panel contribution at the 29th edition of the workshop “The Outlook for the Economy and Finance”, “Villa d’Este”, Cernobbio, 6 April 2018.
- While measures are assumed to be in place for only two years when assessing the medium-term effects, in the steady-state simulations it is presumed that all substitutions and adjustments have been made, given that increases in trade costs are permanent.
- The results of the simulations are predicated on some important modelling choices. Trade disputes are assumed to last only two years, and it is assumed that additional fiscal revenues generated by tariff increases are used to reduce budget deficits rather than to support demand. Monetary policy and exchange rates are assumed to react endogenously in all countries. The results should therefore be treated with a degree of caution.
- For details of the model, see Cappariello, R. et al., “Protectionism and Value Chains, Quantifying the General Equilibrium Effects”, Working Paper Series, ECB, forthcoming.
- The estimated impact on trade is sensitive to the choice of trade elasticities. The rather sizeable response of trade volumes to higher tariffs in our simulations reflects the specific characteristics of this class of models. It is well documented in the academic literature that standard macroeconomic models find lower price elasticities than models estimated at the sectoral level. Aggregating those sectoral elasticities to the country level leads to higher elasticities, which are heterogeneous across countries and depend on the degree of specialisation and openness across sectors. See, for example, Imbs, J. and Mejean, I., “Trade elasticities”, Review of International Economics, Vol. 25, No 2, 2017, pp. 383-402.
- A side agreement within the USMCA trade deal excludes the application of Section 232 tariffs (including a potential auto tariff) on Canada and Mexico.
- Specifically, countries hit by the 25% tariff on cars would retaliate by targeting the US car sector and by raising tariffs on the products that had previously been involved in retaliatory action.