Euro area balance of payments (Monthly developments in September 2004) and international investment position (as at end-2003)
In September 2004 the seasonally adjusted current account of the euro area recorded a deficit of around EUR 3 billion that resulted from deficits in income and current transfers, which were partly offset by surpluses in goods and services. In the financial account, there were net inflows totalling EUR 45 billion in combined direct and portfolio investment, which were mainly accounted for by net sales of foreign equity securities by euro area residents and net acquisitions of euro area bonds and notes by non-residents.
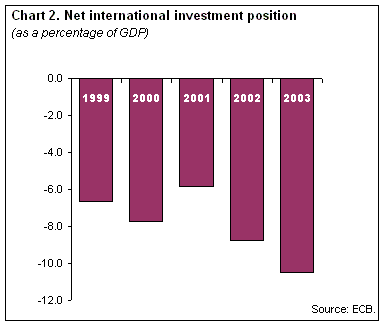
At the end of 2003 the international investment position of the euro area vis-à-vis the rest of the world recorded net liabilities of EUR 760 billion, representing 10.5% of euro area GDP, up from 8.7% of GDP at end-2002.
Current account
The seasonally adjusted current account of the euro area showed a deficit of EUR 3.2 billion in September 2004 (corresponding to a EUR 0.3 billion deficit in non-seasonally adjusted terms). This reflected deficits in income (EUR 3.5 billion) and current transfers (EUR 5.3 billion) that were partly offset by surpluses in goods (EUR 4.6 billion) and services (EUR 1.0 billion).
Compared with revised data for August 2004, the seasonally adjusted current account moved from close to balance to a deficit position, declining by EUR 3.7 billion. This was due mainly to a decrease in the surplus for services (by EUR 1.1 billion) and to a rise in the income deficit (by EUR 1.8 billion), both of which reflected higher debits, and, to a lesser extent, to a decrease in the surplus for goods (by EUR 0.6 billion).
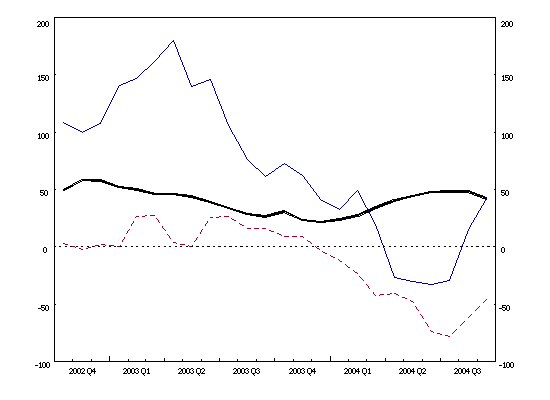
Euro area balance of payments: 12-month cumulated flows (EUR billions) —— current account balance
------ net direct investment
—— net portfolio investment
The 12-month cumulated surplus of the euro area current account up to September 2004 amounted to EUR 40.4 billion, i.e. about 0.5% of GDP, compared with EUR 26.3 billion a year earlier. The EUR 14.1 billion increase in the cumulated current account resulted from higher surpluses in goods and services and from lower income and current transfer deficits (reflecting lower debits).
Financial account
In the financial account, combined direct and portfolio investment recorded net inflows of EUR 44.9 billion in September 2004, reflecting net inflows in portfolio investment (EUR 39.6 billion) and, to a lesser extent, in direct investment (EUR 5.3 billion).
Net inflows in direct investment were largely accounted for by net investment in the form of equity capital and reinvested earnings by non-resident companies to their euro area affiliates, amounting to EUR 6.3 billion.
In portfolio investment, the developments reflected net inflows in both equity securities (EUR 23.2 billion) and debt instruments (EUR 16.4 billion), principally because euro area residents were net sellers of foreign equity securities (EUR 14.3 billion) and non-residents were net buyers of euro area bonds and notes (EUR 39.2 billion).
Other investment recorded net outflows of EUR 38.8 billion, mainly as a result of net short-term outflows registered by monetary financial institutions (MFIs) excluding the Eurosystem (EUR 37.0 billion).
Reserve assets increased by EUR 0.7 billion (excluding valuation effects). The stock of the Eurosystem’s reserve assets stood at EUR 298.2 billion at the end of September 2004.
In the 12-month period up to September 2004, combined direct and portfolio investment recorded cumulated net outflows of EUR 3.2 billion, compared with net inflows of EUR 77.3 billion a year earlier. This reversal stemmed mainly from a switch in direct investment from net inflows of EUR 15.7 billion to net outflows of EUR 45.5 billion, primarily reflecting a reduction of net inter-company loans between foreign companies and their euro area affiliates. Moreover, portfolio investment recorded lower net inflows over the same period that were due to lower net inflows in both equity and debt instruments. Increased net purchases of foreign equity securities by euro area residents were the main drivers of developments in portfolio equity investment. At the same time, the lower net investment in debt instruments reflected a higher net acquisition of foreign money market instruments by euro area residents, as well as a lower net acquisition of euro area money market instruments by non-residents, developments that were not fully compensated for by reverse movements for bonds and notes.
Euro area international investment position as at end-2003
At the end of 2003 the international investment position (i.i.p.) of the euro area vis-à-vis the rest of the world recorded net liabilities of EUR 760 billion (representing 10.5 % of euro area GDP). This reflects an increase of EUR 142 billion in net liabilities, as compared with revised end-2002 positions which represented 8.7% of euro area GDP (see Chart 2).

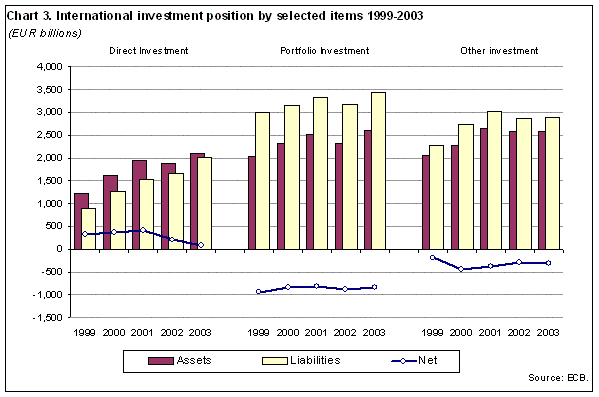
At the end of 2003 outstanding foreign assets held by euro area residents totalled EUR 7,768 billion. This reflects an increase of EUR 508 billion or 7.0 % in comparison with end-2002. At the end of 2003 outstanding euro area liabilities amounted to EUR 8,528 billion, reflecting a rise of EUR 649 billion or 8.2 % compared with the previous year.
The increase in the net debtor position of the euro area in 2003 resulted primarily from the decrease in the net direct investment asset position, which fell by EUR 125 billion to EUR 80 billion at the end of 2003. Conversely, the net debtor position in portfolio investment was EUR 56 billion lower than at the end of 2002, mainly owing to a reduction in the debtor position in equities (by EUR 51 billion). The liability position in financial derivatives fell by EUR 5 billion to EUR 8 billion at the end of 2003.
The net debtor position in other investment rose from EUR 297 billion at the end of 2002 to EUR 315 billion at the end of 2003. Finally, euro area reserve assets (held by the Eurosystem) decreased from EUR 366 billion at the end of 2002 to EUR 307 billion at the end of 2003.

Data revisions
In addition to the monthly balance of payments (b.o.p.) data for September 2004, and to the end-2003 international investment position (i.i.p.) data, this press release incorporates a revised set of b.o.p. statistics for the period from 2001 to 2003 and for August 2004 as well as an update of the complete i.i.p. since 1999.
Revisions in the b.o.p. have reduced the euro area current account deficit in 2001 by EUR 5.6 billion, to EUR 11.0 billion, and increased the surplus in 2002 by EUR 3.4 billion, to EUR 57.8 billion. In both cases, these revisions mainly concerned income on direct investment. In 2003 the current account surplus has been revised down by EUR 3.0 billion, to EUR 21.8 billion.
In the financial account, the main change consisted of higher net combined direct and portfolio investment inflows in 2003, which were revised from EUR 4.5 billion to EUR 38.3 billion. This resulted mainly from higher net inflows in portfolio investment (by EUR 24.1 billion), due to an increase in net inflows of euro area equity securities and a decrease in net outflows of foreign money market instruments by the non-MFI sector. Lower net outflows in direct investment (by EUR 9.7 billion) resulted in part from higher inter-company loans from non-resident companies to their euro area affiliates.
For August 2004, revisions in the financial account mostly concerned direct investment, for which net inflows were revised from EUR 4.4 billion to EUR 9.3 billion.
The revisions introduced in the i.i.p. include methodological changes applied in some Member States, which were mainly due to a more comprehensive coverage of the reporting population, in particular with respect to direct investment enterprises. These revisions have resulted in an increase in the euro area net debtor position.
Additional information on the euro area balance of payments and international investment position
A complete set of updated euro area balance of payments and international investment position statistics is available in the “Statistics” section of the ECB’s website, under the heading “Data services”/“Latest monetary, financial markets and balance of payments statistics”. The results up to September 2004 will also be published in the December 2004 issue of the ECB’s Monthly Bulletin. A detailed methodological note is available on the ECB’s website. The next press release on the euro area balance of payments will be published on 22 December 2004.
Annexes
Table 1: Euro area current account – seasonally adjusted data
Table 2: Monthly balance of payments of the euro area – non-seasonally adjusted data
Table 3: International investment position of the euro area (Euro 12).
European Central Bank
Directorate General Communications
- Sonnemannstrasse 20
- 60314 Frankfurt am Main, Germany
- +49 69 1344 7455
- media@ecb.europa.eu
Reproduction is permitted provided that the source is acknowledged.
Media contacts

