


Published as part of the ECB Economic Bulletin, Issue 1/2026.
Consumers’ perceptions of economic uncertainty play a critical role in shaping their spending and saving behaviour. Beyond its notable impact on aggregate demand, the effect of uncertainty on household decisions varies significantly across individual households.[1] In this context, the ECB Consumer Expectations Survey (CES) offers unique insights by providing timely and granular measures of uncertainty. This box first uses a measure of implied uncertainty based on an existing question in the CES about the probabilistic distribution of the expected income growth of households to assess the evolution of uncertainty over time.[2] It then combines information from a new question in the survey about the degree of perceived predictability of the financial situation of households. The survey also includes a follow-up question about their planned response to such economic uncertainty, making it possible to assess cross-household heterogeneity.[3]
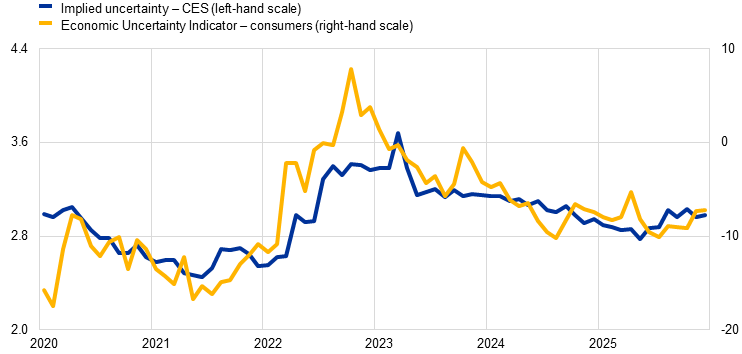
Although conceptually different, the CES and European Commission consumer uncertainty indicators are closely aligned and both suggest that uncertainty is still elevated (Chart A). The implied uncertainty measure derived from the CES is a quantitative indicator that relies on the probabilistic reasoning of respondents. It is defined as the average implied interquartile range across respondents. The European Commission consumer uncertainty indicator is qualitative and captures a subjective perception about predictability. It represents the net percentage of respondents who consider it difficult to predict their own financial situation. These methodological differences notwithstanding, the two measures correlate closely over time and across households. They suggest that uncertainty is currently below its peak in 2022-23 – recorded during the period of exceptional uncertainty following the outbreak of the war in Ukraine and the subsequent surge in energy and food prices – but still higher than the trough seen in mid-2021, when the economy was recovering from the COVID-19 pandemic.
Chart A
Evolution of survey-based consumer uncertainty measures
(left-hand scale: mean implied interquartile ranges; right-hand scale: aggregate balances)
Sources: European Commission, ECB (CES) and ECB calculations.
Notes: The implied uncertainty measure derived from the CES is based on respondent-specific probability distributions derived from the probabilistic bin question on expectations about households’ net income developments. Implied income uncertainty is computed as the average interquartile range across respondents in each wave, using survey weights. The latest observations are for December 2025.
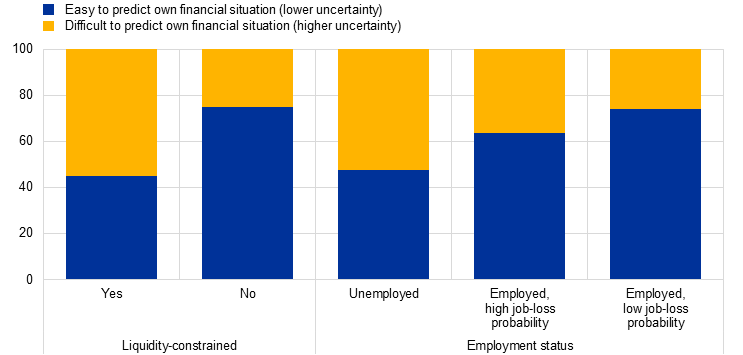
Liquidity-constrained and unemployed households find it more difficult to predict their financial situation (Chart B). Most liquidity-constrained households (53%) find it difficult to predict their financial situation, compared with only 24% of unconstrained households.[4] Similarly, 49% of unemployed respondents report such difficulty, while, among the employed, the share of households reporting high and low job-loss probability that find it difficult to predict their financial situation drops to 35% and 25% respectively. This suggests that perceived job security is a key driver of household income risk.[5] These cross-sectional differences are consistent with previous evidence pointing to the fact that households that are more uncertain about their financial situation tend to place greater emphasis on precautionary motives for their savings decisions (Dimou et al., 2026).
Chart B
Perceived uncertainty, by household type
(percentages of respondents, weighted)
Sources: ECB (CES) and ECB calculations.
Notes: Households are classified as liquidity-constrained if they indicate that they would not have sufficient financial resources to cover an unexpected payment equal to their household’s monthly income, if such a need were to arise. Households are classified as reporting a high (low) job-loss probability if the value they report is above (below) the sample median. Data taken from the November 2025 CES.
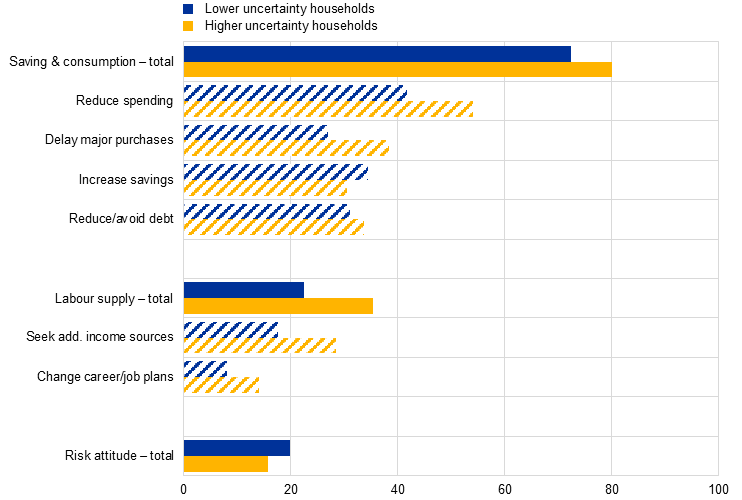
Households that face higher uncertainty are more likely to plan to reduce their consumption or adjust their labour supply (Chart C). When asked what decisions they would consider changing due to the difficulty in predicting their future financial situation, a larger share of uncertain households than certain ones reported that they plan to reduce spending (53% vs. 42%) or delay major purchases (37% vs. 26%). Additionally, a larger share of uncertain households reported that they plan to adjust their labour supply (35% vs. 22% of certain households), either by seeking additional income sources or by changing their career plans. Differences between the two groups are more muted for plans related directly to savings or to other aspects of saving (reducing or avoiding taking on debt), as well as plans to adjust their risk attitude (through more cautious investments).
Chart C
Planned actions in response to economic uncertainty
(percentages of respondents, weighted)
Sources: ECB (CES) and ECB calculations.
Notes: Shares for categories labelled “– total” (indicated by solid horizontal bars) are calculated by counting (only once) respondents that selected at least one of the reply options included in that category (indicated by hashed horizontal bars). Data taken from the November 2025 CES.
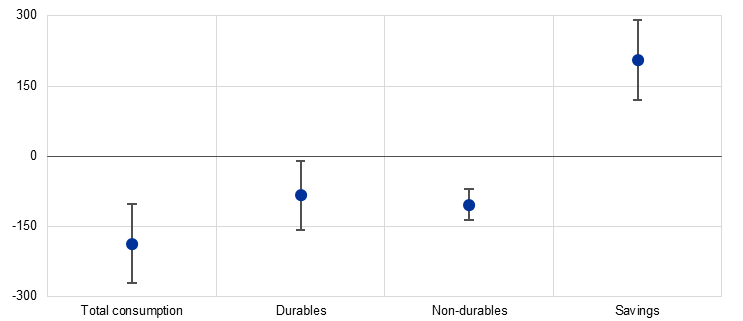
Uncertain households report lower realised consumption and higher realised savings, in line with precautionary saving theory (Chart D). On average, uncertain households spend around €100 less per month on non-durables and almost another €100 less on durables than certain households, while this is also fully reflected in higher savings. To put this into perspective, a difference of around €100 corresponds to almost 25% of the average monthly savings, and slightly less than 5% of the average total monthly spending, as reported in the CES.
Chart D
Difference-in-means in consumption and savings, by perceived uncertainty
(regression coefficients in EUR of monthly spending/savings)
Sources: ECB (CES) and ECB calculations.
Notes: The blue dots represent coefficient estimates from regressions of individual consumption (total, durables, non-durables)/savings on an uncertainty dummy, individual controls and country fixed effects. The whiskers represent 90% confidence bands based on robust standard errors. Data on uncertainty are from the August and November 2025 CES and data on consumption and savings variables are from the July and October 2025 CES.
This box has highlighted the importance of economic uncertainty for understanding current aggregate consumption and saving decisions. Together with recent evidence on the prevalence of precautionary and Ricardian saving motives among euro area households (Dimou et al., 2026), elevated uncertainty remains an important factor underlying the persistently high household saving rate in the euro area.[6]
References
Bayer, C., Luetticke, R., Pham-Dao, L. and Tjaden, V. (2019), “Precautionary savings, illiquid assets, and the aggregate consequences of shocks to household income risk”, Econometrica, Vol. 87, No 1, pp. 255-290.
Coibion, O., Georgarakos, D., Gorodnichenko, Y., Kenny, G. and Weber, M. (2024), “The Effect of Macroeconomic Uncertainty on Household Spending”, The American Economic Review, Vol. 114, No 3, pp. 645-677.
Dimou, M., Flaccadoro, M. and Gareis, J. (2025), “The household saving rate revisited: recent dynamics and underlying drivers”, Economic Bulletin, Issue 8, ECB.
Dossche, M. and Hartwig, J. (2019), “Household income risk over the business cycle”, Economic Bulletin, Issue 6, ECB.
European Commission (2021), “Special topic: New survey-based measures of economic uncertainty”, European Business Cycle Indicators − Technical Paper 051, October.
For instance, liquidity-constrained households display higher sensitivity of consumption to income and uncertainty shocks (Bayer et al., 2019). In addition, survey-based evidence shows that higher perceived uncertainty lowers household spending, especially for households holding risky asset portfolios (Coibion et al., 2024).
Respondents were asked: “Below you see ten possible ways in which your household’s total net income could change over the next 12 months. Please distribute 100 points among them, to indicate how likely you think it is that each income change will happen”.
The question was asked in the CES in August and November 2025 and mirrors the formulation used in the European Commission’s consumer survey within its Business and Consumer Survey (BCS) Programme (see also European Commission, 2021). Respondents were asked: “The future financial position/situation of your household is currently…: easy to predict / moderately easy to predict / moderately difficult to predict / difficult to predict”. In a follow-up question, respondents were asked: “Given the current economic uncertainty (i.e. the difficulty of predicting your household’s future financial situation), how (if at all) do you plan to adjust your actions or decisions? (Please select all that apply.) I plan to…(1) Reduce usual spending; (2) Delay or cancel major purchases (e.g. home, car, appliances); (3) Increase my savings/emergency fund; (4) Reduce or avoid taking on new debt; (5) Invest more cautiously (e.g. avoiding risky investments); (6) Seek additional income sources (e.g. additional jobs); (7) Make changes to my career or job plans; (8) None of the above”.
The survey question, which identifies liquidity constraints, asks respondents whether or not their household would have sufficient funds to cover an unexpected payment equal to their household’s monthly income.
For further empirical evidence on the relationship between labour market performance and income risk over the business cycle in the euro area, see Dossche and Hartwig (2019).
While household-level regressions provide insights into behavioural responses to uncertainty, their aggregate implications depend on the distribution of uncertainty across households and the relative contribution of different income groups to overall consumption and savings. Further analysis indicates that uncertainty significantly affects not only lower-income but also higher-income households, supporting the relevance of the reported coefficients for aggregate dynamics.