


- THE ECB BLOG
Fiscal policy to the rescue: How governments shielded households from inflation
23 November 2023
With rising inflation, people need more money to buy the same amount of goods. Governments can take measures to counteract this negative effect. The ECB Blog finds that recent euro area policies to support households were successful at first – but also very costly.
Inflation in the euro area rose quickly throughout 2022, peaking at 10.6% in October that year. Whenever prices increase rapidly like this, households have to choose between paying more to maintain their lifestyle – by drawing on their savings, if they can – or cutting back. Either way, many people are left with less at the end of the day. We call this a negative welfare effect.
Euro area governments quickly moved to cushion against the economic and social fallout of rising prices, often with the explicit aim of supporting pensioners and low-income households. They adopted measures to limit the increase in prices, particularly for energy, by introducing price caps, subsidies or discounts, and by reducing taxes on goods and services (“price measures”). Governments also adopted measures to shield households’ disposable income more directly, for example in the form of transfers or tax credits (“income measures”).
Taking a closer look at the effects of these fiscal measures, we find that they were effective in offsetting the negative welfare effects of inflation. They even helped reduce the unequal distribution of these welfare effects, even though some countries were more successful than others.
Inflation could have hit people even harder
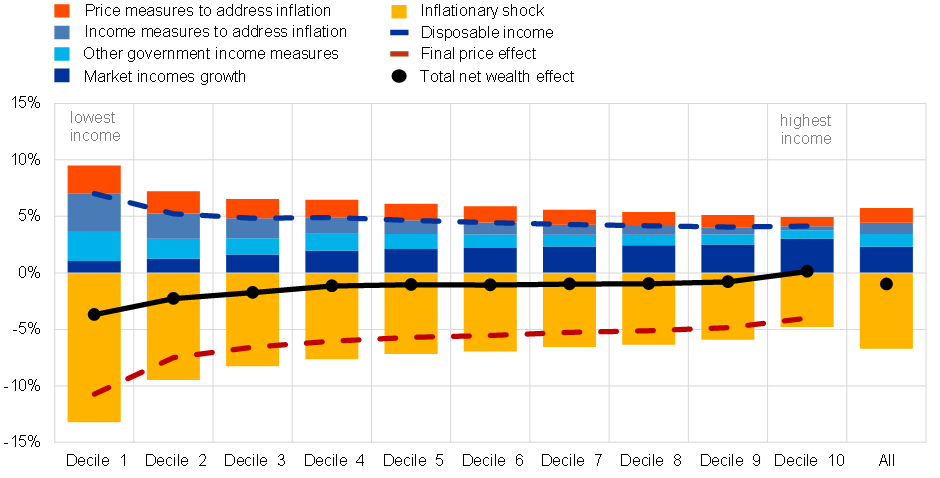
Looked at in isolation, consumer price inflation in 2022 had a detrimental impact on households in the euro area. In the absence of any government measures and income growth, average household welfare would have dropped by almost 6.7 percentage points in so-called equivalent income units (Chart 1, yellow bars).[1]
At the same time, the poorest suffer significantly more from inflation than those who are better off. The welfare loss for the bottom ten percent of households from the inflation shock alone was 13.2%, 8.4 percentage points higher than that for the highest income households (4.8%). These differences are driven, first, by consumption behaviour. Second and even more importantly, poorer households have to spend a larger share of their income on consumption than wealthier households. Simply put, spending one more euro feels like a bigger step when your budget is €100 than it does when it’s €1,000.
Chart 1
Price and income effects based on household welfare
(% change in equivalised disposable household income, 2021, per decile)
Source: Amores et al. 2023.
Notes: Contributions to changes in disposable income pertaining to the price (income) side are shown in yellow/red (blue) tones. The dashed lines show the total effect on the income (price) side in blue (yellow/red). Equivalised disposable income is computed by dividing the household’s disposable income by its size on the OECD’s modified equivalence scale, which assigns a weight of one to the first adult of the household and a weight of 0.5 (0.3) to each additional household member over (under) 14.
Governments helped households as prices rose
Government measures, as well as higher nominal wages, mitigated the negative welfare effect of the surge in inflation.[2]
- Price measures reduced the increase in inflation by about 1.6 percentage points. While price caps or tax reductions for goods and services cannot be targeted towards particular households, low-income households benefitted more in relative terms given their higher exposure to energy price inflation. It should be noted, however, that the unwinding of price measures can result in a surge in inflation, partly undoing the initial beneficial impact on household welfare.
- At the same time income measures explicitly linked to the surge in inflation led to a 1 percentage point increase in disposable income growth. In contrast to the price measures, these were very much targeted at lower-income households. For the bottom ten percent these measures accounted for almost half of disposable income growth.
- The third element that offset the increase in inflation was nominal income growth from market income (income after taxes and transfers), such as growth in salaries and wages. It also includes income growth from government measures not explicitly related to the surge in inflation (e.g. pension and unemployment benefit increases).
Overall, these factors offset around 85% of the welfare loss for the average euro area household. At the same time government measures, particularly those on the income side, contributed to closing more than half of the gap in the welfare loss between the bottom ten percent and the top ten percent.
These inflation-linked government measures were more effective in some euro area countries than in others. In France and Italy, they helped to offset the welfare loss across the income distribution (Chart 2). Other countries, however, experienced more significant welfare losses that hit low-income households even more severely. In Germany, for example, the average household lost 0.7%, while the disparity between the top and bottom ten percent increased by around 7.5 percentage points. In Spain the average welfare loss amounted to 3.5% and the inequality gap between the top and bottom ten percent increased by more than 5 percentage points.
Chart 2
Price and income effects based on households’ welfare in euro area countries
(% change in equivalised disposable household income, 2021, per decile)

Source: Amores et al. 2023.
Notes: Contributions to changes in disposable income pertaining to the price (income) side are shown in yellow/red (blue) tones. The dashed lines show the total effect on the income (price) side in blue (yellow/red). Equivalised disposable income is computed by dividing the household’s disposable income by its size on the OECD’s modified equivalence scale, which assigns a weight of one to the first adult of the household and a weight of 0.5 (0.3) to each additional household member over (under) 14.
The fiscal cost of reducing inequality
Both price and income measures helped to slow the rising inequality that came with the inflation surge. However, these government measures did not come cheaply. In the euro area, inflation-related measures are estimated to have totalled almost 2% of GDP in 2022. These resulting budget deficits added to the already high debt-to-GDP ratios in many euro area countries.
This raises questions about the efficiency of the government measures in helping the most vulnerable households. Our simulations suggest that income measures are much more effective in reducing inequality than price measures. If governments aim to help pensioners and low-income households, price measures are not the most cost-effective policy choice, as they are far more difficult to tailor to particular households.
As a result, the cost of closing the same inequality gap was much higher in countries that focused on price measures than in countries that used income measures. Our simulations show that the cost of achieving the same inequality reduction was approximately twice as high for countries which predominantly relied on price measures. In addition, when price measures expire, this may result in a sudden surge of inflation, at least partly undoing the initial beneficial impact on households’ welfare.
The views expressed in each blog entry are those of the author(s) and do not necessarily represent the views of the European Central Bank and the Eurosystem.
A money metric change in welfare is defined as the difference in the cost of the consumption basket at 2021 and 2022 prices, net of any income changes. To make this measure immediately comparable across countries, such a welfare loss is expressed as a percentage of household disposable income. Expressing welfare loss in terms of disposable income instead of consumption expenditure implies that households with negative savings will see their losses amplified, while the opposite will occur for households with positive savings.
The analysis is static as it does not consider behavioural responses or general equilibrium effects. Accordingly, households are assumed to not alter their consumption behaviour in response to the price surge or government transfers. This assumption is supported by the recent literature that finds little evidence of demand substitution in 2022.