
TARGET2-Securities Annual Report 2019
Introduction
Market infrastructures form the backbone of the financial system. They provide the networks through which financial institutions and financial markets are connected and financial transactions are cleared and settled. Therefore, it is essential to ensure that market infrastructures are safe and efficient, and that they support a stable and well-functioning economy. The Eurosystem is closely involved in this work, as the conduct of monetary policy depends on the availability of reliable and effective financial market infrastructures. It operates platforms for the settlement of large-value payments (TARGET2), securities (TARGET2-Securities) and instant payments (TIPS).
TARGET2-Securities (T2S) is the result of an initiative to address the highly fragmented securities settlement landscape in Europe. Launched in June 2015 as an integrated platform for processing securities against central bank money, T2S revolutionised securities settlement in Europe by bringing an end to complex cross-border settlement procedures and the difficulties caused by different settlement practices among countries.
T2S provides harmonised and commoditised securities settlement, applying a single set of rules, standards and tariffs to all participating Central Securities Depositories (CSDs). It is thus laying the foundations for a single market for securities settlement and contributing to the integration of Europe’s financial markets. Today, the T2S platform connects 21 CSDs from 20 European markets and processes around 600,000 securities transactions per day against both euro and Danish krone.
This is the ninth TARGET2-Securities Annual Report.
In addition to its standard content, the report includes three boxes, providing detailed information on topics of particular relevance in 2019. The boxes focus on changes in the statistical framework of T2S, the third Market Settlement Efficiency workshop and the CSD Regulation (CSDR).
TARGET2-Securites activity
In 2019 T2S settled a total of 154,769,117 transactions, corresponding to a daily average of 606,938 transactions. This was almost seven times higher (up 581%) than at the go-live in 2015. The highest daily volume was recorded on 28 June 2019, when 745,912 transactions were processed. On the value side, T2S settled transactions with a total value of €282,063.67 billion in 2019, corresponding to a daily average of €1,106.13 billion. This was 125% higher than 2015. The highest daily turnover was recorded on 17 April 2019, with a total value of €1,804.44 billion.
In 2019 the share of transactions settled during T2S Night-Time Settlement (NTS) was 49.97% in volume terms and 30.93% in value terms. Real-time settlement (RTS) transactions accounted for 50.03% in terms of volume and 69.07% in terms of value.
The most prevalent transaction type on the platform is Delivery-Versus Payment (DVP) with 66.43% of the volume and a daily average of 403,180 transactions in 2019. DVP also dominates in value terms, accounting for 73.89% of the value in 2019, with a daily average of €817.28 billion. The average value of a transaction processed in the system was €1.82 million.
Volume and value evolution in T2S in 2019
Charts 1 and 2 show the volume and value of T2S traffic over the last five years. Compared to 2018, average monthly volumes are 6.08% higher, while the average monthly value more increased by 19.49%. Monthly volumes and values both reached record highs in 2019, with a peak of around 14 million transactions in May and a peak of €26.5 billion worth of securities settled in July. This confirms the trend towards integrated and harmonised securities settlement and post-trade in Europe.
Chart 1
Evolution of volume in T2S
(left-hand scale : number of transactions ; right-hand scale: settlement efficiency in percentages)

Chart 2
Evolution of value in T2S
(left-hand scale: EUR billions; right-hand scale: settlement efficiency in percentages)

1 Evolution of T2S settlement data in 2019
Table 1 provides an overview of traffic developments in T2S in 2019 compared to 2018.
Table1
Evolution of T2S settlement data and market settlement efficiency

Note: There were 255 operating days in both 2018 and 2019.
The traffic figures take into account settlement transactions, settlement restrictions, liquidity transfers and internally generated transactions. In 2019 T2S settled 154,769,117 transactions, with a total value of €282.06 trillion. This corresponded to a daily average of 606,938 transactions, with an average daily value of €1,106.13 billion. Compared with the previous year, there was an increase of 6.08% in terms of volume and 19.49% in terms of value.
The Platform Settlement Efficiency Indicator (PSEI) reached an average of 97.63% in terms of value and 96.93% in terms of volume. This represented an increase of 0.29 percentage points in terms of value and a decrease of 0.52 percentage points in terms of volume. The Market Settlement Efficiency Indicator (MSEI) reached an average of 93.44% in terms of value and 93.27% in terms of volume. Compared with the previous year, it increased by 0.51 percentage points in terms of value and decreased by 0.28 percentage points in terms of volume.[1]
Box 1
Changes in the T2S statistical framework
T2S statistics have traditionally been oriented towards reporting on the technical performance of the platform. A new methodology was developed in the course of 2019 with the aim of providing more business-oriented indicators. The new methodology was developed by the Data Access Task Force (DATF), which was established to work on T2S data-related topics and consists of representatives from CSDs, National Central Banks (NCBs), the ECB and the four central banks responsible for the development and operation of T2S, i.e. the Deutsche Bundesbank, the Banco de España, the Banque de France and the Banca d’Italia (4CB).
In order to allow comparison throughout the reporting period, the statistical framework applied in the 2019 T2S Annual Report is in line with that used in previous year’s report. The new statistical framework will be adopted as of 2020.
The aim of this box is to provide an overview of the main changes introduced by the new methodology and to show the impact on the calculation of the T2S activity indicators.
The main changes introduced with the new framework are:
- the exclusion of technical transactions in T2S, i.e. transactions that the system generates automatically (such as realignment instructions), from the calculation of the traffic figures;
- the exclusion of liquidity transfers, including those from and to the Real-Time Gross Settlement (RTGS) Dedicated Cash Accounts (DCAs), from the calculation of the traffic figures and the settlement efficiency indicator;
- the inclusion of Party-on-Hold transactions in the calculation of the settlement efficiency indicator;
- the exclusion of transactions related to Corporate Actions from the calculation of the settlement efficiency indicator.
The impact on overall T2S activity of introducing the new framework calculation is presented in the following four charts, which compare indicators calculated using the current PSEI methodology and the DATF methodology from July 2019 onward.
Traffic measures
Chart A compares the daily average T2S volume (panel a) and daily average value (panel b) of settled transactions calculated using the PSEI and DATF methodologies for each month in 2019. Between July and December 2019, the observed reduction in the daily average volume as a result of the change in methodology is around 11% on average, while the daily average value decreases by around 42% on average. The asymmetric impact on volumes and values is mainly driven by the exclusion of liquidity transfers, which are typically high-value transactions.
Chart A
Daily average volumes (left panel) and values (right panel) settled in T2S
(panel a: number of transactions, daily averages; panel b: EUR billions, daily averages)

Settlement efficiency indicator
Chart B compares the PSEI and the indicator computed following the DATF methodology at End of Day (EoD) and after Night Time Settlement (NTS) in 2019. As can be seen, the introduction of the DATF framework leads to an overall reduction in the settlement efficiency indicated. The EoD indicator decreases by around 3% in value terms and 2% in volume terms. After NTS, the reductions are around 24% and 19% in value and volume terms, respectively. The asymmetric impact on the figures at EoD and after NTS is due to various factors, one of which is the inclusion of Party-on-Hold transactions in the DATF indicator.
Chart B
Platform and New Settlement Efficiency Indicators at EoD (left panel) and after NTS (right panel)
(percentages)

Overall, the DATF methodology is expected to lead to a one-off downward shift in reported T2S activity, both in terms of traffic and of settlement efficiency. While this box uses 2019 data to illustrate the impact of the changeover, the DATF methodology will actually replace the current methodology as of January 2020 and will be therefore adopted as of the 2020 T2S Annual Report. The change in methodology will be taken into account when comparing data from before and after the implementation date.
1.1 Volume of settlements in T2S
In 2019 T2S settled on average 606,938 transactions per day. Chart 3 shows the evolution of daily average T2S traffic in volume terms. The daily average volume per month ranged from 564,513 (in January) to 633,925 (in May). At daily level, the highest volume settled was on 28 June (745,912 transactions) and the lowest on 3 January (287,348 transactions).
Chart 3
Daily average and highest and lowest daily volumes of settled T2S transactions each month in 2019
(number of transactions, daily averages)

Real-time settlement and night-time settlement
In T2S the new business day starts at 18:45 CET in the evening on the previous day with the preparation of the night-time settlement. NTS processing starts at 20:00 CET and runs on average until around 22:00 CET. NTS consists of two cycles. The first cycle is subdivided into five sequences and the second cycle into four sequences. Within the different sequences certain transaction or instruction types are settled. At the end of the second cycle, T2S submits, for partial settlement, all eligible transactions for which settlement failed in an earlier attempt the same evening.
After the end of NTS, there is a short preparation phase for RTS, followed by the first RTS phase that runs until the opening of the daily/weekly technical maintenance window. The technical maintenance window is open from 03:00 CET to 05:00 CET, during which time T2S is closed for all activities.
The closing of the technical maintenance window is followed by a second RTS phase, which includes five partial settlement windows, at 8:00 CET, 10:00 CET, 12:00 CET, 14:00 CET and 15:45 CET. In each partial settlement window, T2S partially settles new settlement instructions arriving in T2S that are eligible for partial settlement, as well as previously unprocessed or partially processed settlement instructions eligible for partial settlement. As a result of the work on market settlement efficiency, the duration of two of the partial settlement windows was extended as of 9 December 2019. The first and last partial settlement windows now have a duration of 30 minutes each, while the others each have a duration of 15 minutes. RTS is concluded with the end of real time settlement at 18:00 CET.
In 2019 there were 12,897,426 transactions settled on average each month. Chart 4 shows total monthly traffic in volume terms, broken down by NTS and RTS. The total monthly traffic ranged between a low of 12,060,346 transactions in February and a high of 13,946,359 transactions in May.
Chart 4
Night-time and real-time settlement volumes
(number of transactions, monthly totals)

As depicted in the graph, there is little variation in the share of the total volume settled in NTS and RTS each month in 2019. NTS accounted for 49.97% of the overall volume, while RTS accounted for 50.03%. In absolute terms, the monthly volumes settled in NTS and RTS both reached a peak in May, with 6,945,528 and 7,000,831 transactions, respectively. In percentage terms, the peak volume settled in NTS was in September (51.20%), whereas the peak volume settled in RTS was in November (50.75%). In volume terms, DVP transactions, which account for the majority of T2S traffic, were settled mostly during the NTS phase (60.30%).
Six transaction categories contribute to the T2S volumes: Delivery-versus-Payment (DVP), Free-of-Payment (FOP), Payment-Free-of-Delivery (PFOD), Settlement Restriction on Securities (SRSE), Liquidity transfers (LQT) and Delivery-with-Payment (DWP). Chart 5 displays the T2S daily average traffic broken down by transaction type.
Chart 5
Volume by transaction type
(percentages, daily averages)

Note: The category “Other” includes payment-free-of-delivery (PFOD), settlement restriction on securities (SRSE), liquidity transfers (LQTs) and delivery-with-payment (DWP).
In 2019 DVP and FOP transactions were the largest contributors to T2S traffic, representing together around 97.03% of the T2S daily settled volumes. DVP transactions accounted for the majority of the daily average T2S volume, with 66.43% (corresponding to a daily average of 403,180 transactions). FOP transactions represented 30.60% of the daily average T2S volume (corresponding to a daily average of 185,740 transactions). PFOD transactions, SRSE transactions, LQT transactions and DWP transactions together accounted for 2.97% of the daily average volume (corresponding to a daily average of 18,018 transactions). The percentage contribution of each transaction type relative to the overall volume is consistent with what has been observed in previous years.
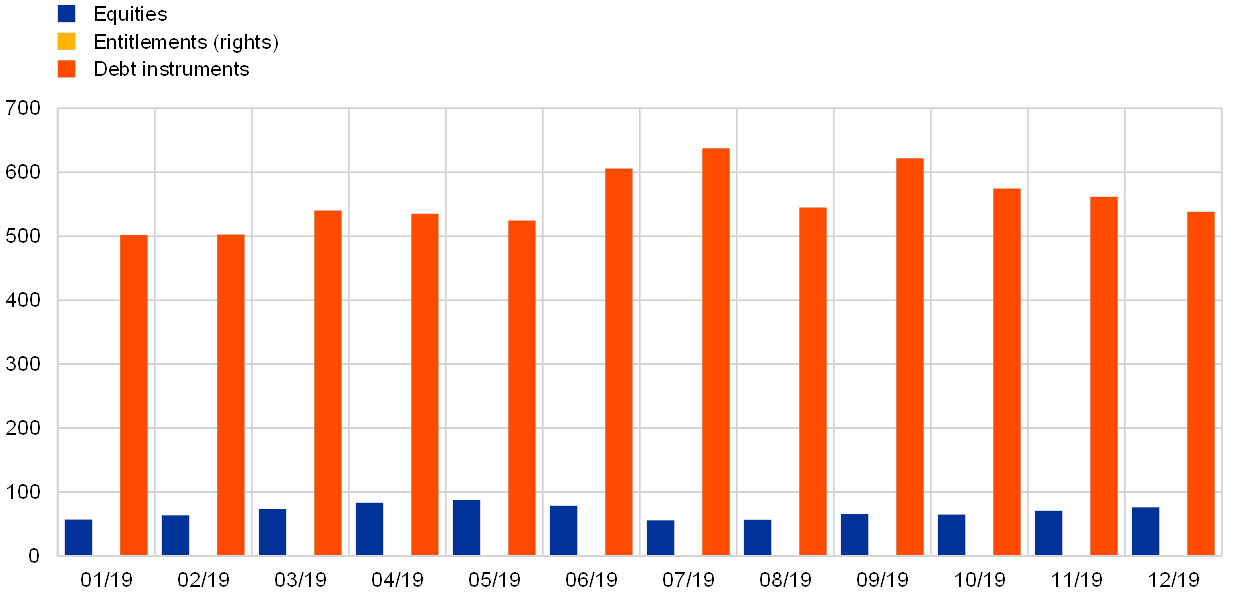
The three largest contributors to T2S traffic in terms of volume are equities, entitlements (rights) and debt instruments. Chart 6 shows the daily average volume settled for each of these three categories. In 2019 equities represented the largest share of overall T2S traffic with an average daily volume of 340,890 transactions (56.32%), followed by entitlements (rights) with 105,279 (17.40%) and debt instruments with 60,141 (9.94%). The remaining share (16.34%) is attributable to other types of securities.
Chart 6
Volume by securities category
(number of transactions, daily averages)

The daily average volume of equities ranged between a low of 310,423 (July) and a high of 364,030 transactions (November). The daily average volume of entitlements (rights) ranged between 88,887 transactions (July) and 121,305 (August). The daily average volume of debt instruments ranged between 53,551 transactions (August) and 62,980 (June). Throughout the year, equities consistently accounted for by far the largest volume, followed by entitlements and then debt instruments.
1.2 Value of settlements in T2S
In 2019 T2S settled an average of €1,106.13 billion per day. Chart 7 shows the evolution of daily average T2S traffic in value terms. By value, 98.56% of T2S traffic related to settlements in euro.[2]
Chart 7
Daily average and highest and lowest daily values of settled T2S transactions each month in 2019
(EUR billions, daily averages)

February, was the month with the lowest daily average value at €1,018.23 billion, which was 7.95% lower than the overall average. The highest daily value was on 17 April (€1,804.44 billion) and the lowest on 3 January (€768.76 billion). Comparing Chart 7 with Chart 3, the month in which the highest daily traffic occurs is different for volume (June) and value (April), while the lowest daily traffic was in the same month for both volume and value (January).
In 2019 T2S settled transactions for an average monthly value of €23,505.30 billion. Chart 8 depicts total monthly traffic in terms of value, broken down by NTS and RTS. Total monthly traffic ranged between a low of €20,364.52 billion in February and a high of €26,582.47 billion in July.
Chart 8
Night-time and real-time settlement values
(EUR billions, monthly totals)

On average, traffic settled in RTS accounted for 69.07% of overall traffic, compared with 30.93% in NTS. As can be seen in Chart 4, settlement was significantly more balanced between RTS and NTS in volume terms (50.03% and 49.97%, respectively). This indicates that the RTS phase was more value-intensive than volume-intensive and characterised by instructions with a higher average value than in the NTS phase. In contrast, the NTS phase was more volume-intensive than value-intensive.
In absolute terms, the monthly values settled in NTS and RTS in 2019 both reached their peak in July, at €8,562.28 billion and €18,020.19 billion, respectively. As a percentage of the total, the peak value settled in NTS was in September (32.71%), whereas the peak value settled in RTS was in June (71.17%).
68.31% of the total value of DVP transactions, which represented the majority of overall T2S traffic, was settled in RTS.
Four transaction categories contribute to settlement values in T2S, namely DVP, DWP, PFOD and LQT, compared to six categories for the volumes.[3] Chart 9 illustrates the daily average value settled in T2S by transaction type in 2019.
Chart 9
Settlement value by transaction type
(percentages, daily averages)
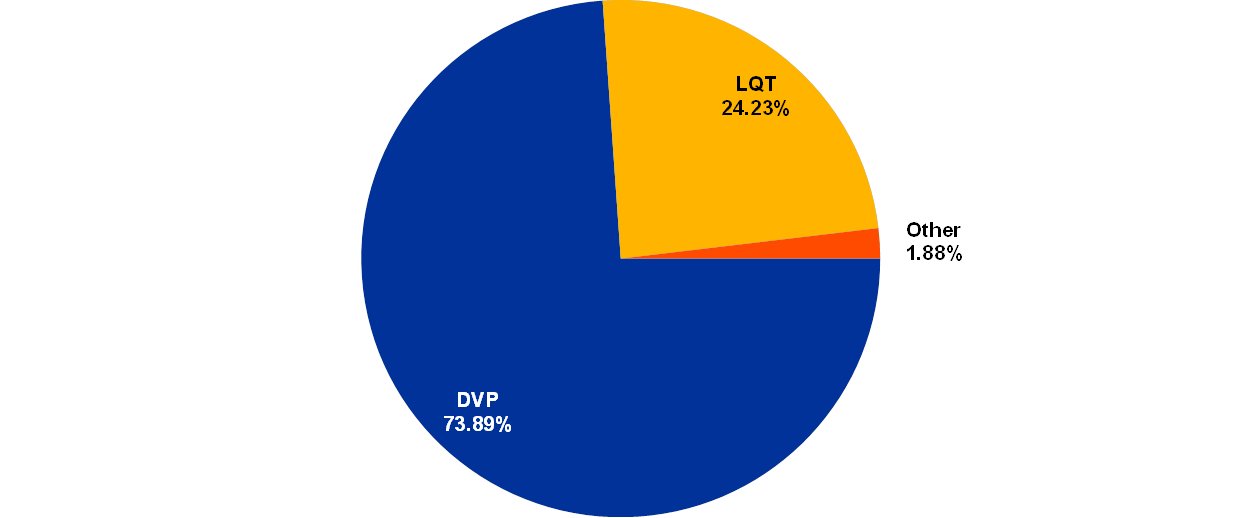
Note: The category “Other” includes PFOD and DWP.
Overall, the split in value by transaction type is consistent with previous years. As with volumes (see Chart 5), DVP represented the largest transaction type in value terms in 2019. Meanwhile, LQTs were typically high-value, low-volume transactions.
DVP transactions were on average the largest contributor to the T2S daily traffic, with 73.89% of the traffic (corresponding to €817.28 billion), followed by LQT transactions with 24.23% (corresponding to €268.04 billion). PFOD and DWP transactions together accounted for only 1.88% (corresponding to €20.82 billion) of the daily average value settled.
As in the case of volumes, the three largest contributors to T2S traffic in terms of value are equities, entitlements (rights) and debt instruments. Chart 10 shows the daily average value settled for these three types of securities in 2019.
Debt instruments were by far the largest securities category in overall T2S traffic in value terms, with a daily average of €557.86 billion (66.48%), followed by equities with €69.21 billion (8.32%) and entitlements (rights) with €0.59 billion (0.07%).
Chart 10
Value by securities category
(EUR billions, daily averages)
Note: Owing to the much lower values of entitlements (rights) settlements compared with the other two categories, the amounts are barely visible on the chart.
Unlike in Chart 6, where equities were the largest securities category in volume terms, they are only the second largest in value terms, whereas debt instruments are by far the largest category in value terms, but were only the third largest in volume terms. This suggests that, on average, equity transactions have a much lower value than debt instrument transactions. Like equities, entitlements (rights) also contribute far more to settlement volumes than to values.
1.3 Settlement efficiency
Settlement efficiency is a measure of the efficiency of the settlement engine of the T2S platform. Two distinct indicators are used to properly monitor settlement efficiency by all parties involved.
- The first indicator is the platform settlement efficiency indicator (PSEI), which concerns the ability of the T2S platform to process transactions and is calculated at the end of the settlement day. It helps determine whether T2S is performing as expected in terms of system configuration and the performance of the optimisation algorithms. For this reason, all settlement activities are taken into account, including those automatically generated by T2S. The indicator is particularly useful for the operator, as it gives an indication of the ability of the platform to process transactions.
- The second indicator is the market settlement efficiency indicator (MSEI), which provides a market-oriented measure of settlement efficiency at the end of the settlement day by taking into account the behaviour of the T2S participants. It excludes internally generated transactions (i.e. transactions that the system created automatically) and liquidity transfers from its calculation, and captures the inability to settle when a participant has put the instruction on hold. This is a business-oriented indicator of particular interest to market participants.
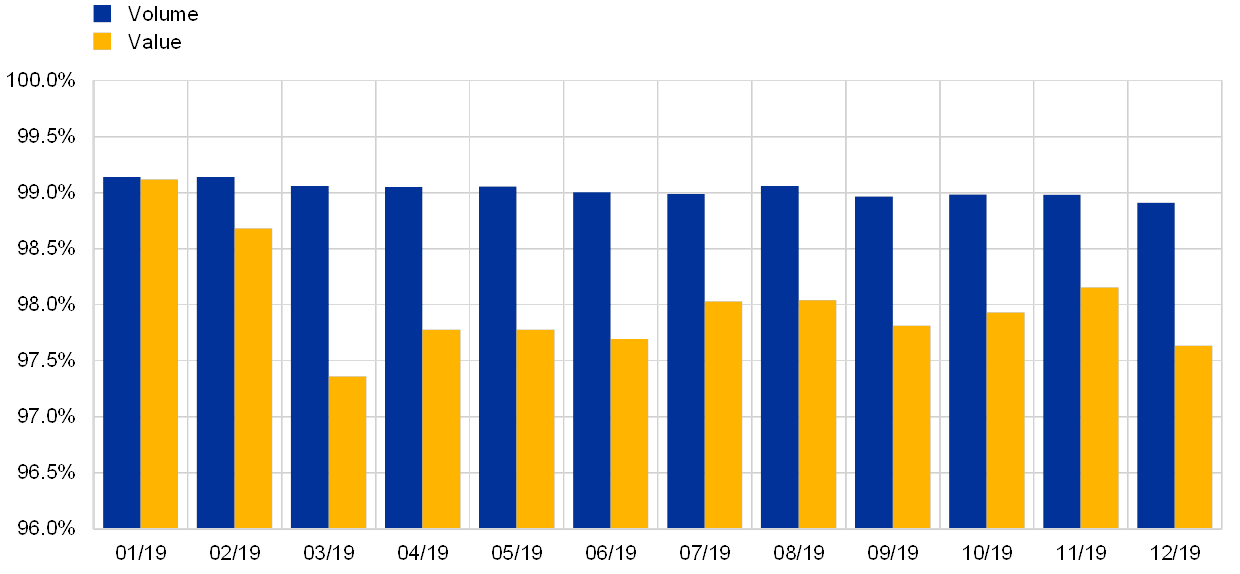
Both indicators are required for a full understanding of the effectiveness of T2S, given that they each have a distinct focus. The PSEI focuses on the performance of the platform, while the MSEI focuses on the performance of the market. Charts 11 and 12 show the evolution of the two settlement efficiency indicators in 2019, at EoD and after NTS respectively.
Chart 11
Platform and Market Settlement Efficiency Indicators at end-of-day
(percentages, at end-of-day)
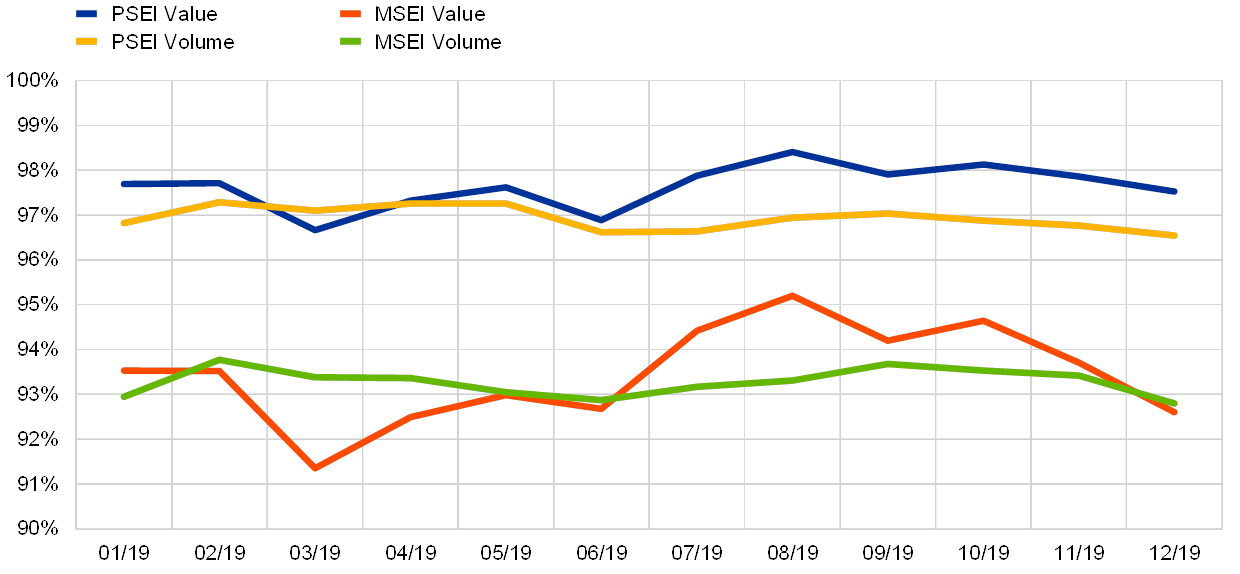
In 2019 the PSEI at EoD remained fairly stable in volume terms, ranging between 96.54% and 97.28%, as illustrated in Chart 11. In value terms, on the other hand, it displayed more volatility, ranging between 96.66% and 98.41%.
In 2019 the MSEI at EoD averaged 93.27% in volume terms and 93.44% in value terms, which was around 3.5 to 4 percentage points lower than the PSEI. While the MSEI was relatively stable in volume terms, the indicator displayed more volatility in value terms, ranging between 91.35% and 95.20%.
The indicators calculated using the two methodologies follow similar patterns, albeit at different levels.
Chart 12
Platform and Market Settlement Efficiency Indicators after NTS
(percentages, after night-time settlement)

In 2019 the PSEI after NTS reached 84.39% in volume terms and 64.19% in value terms, while the MSEI after NTS reached 69.03% in terms of volume and 47.89% in terms of value (see Chart 12).
Compared with the results at EoD, there was a larger gap between results for value and volume for both settlement efficiency indicators after NTS. At the same time, they displayed more stability over the year. Moreover, the PSEI and the MSEI differed from each other by 15.36% in volume terms and 16.30% in value terms.
Box 2
Market Settlement Efficiency Workshop III
The analysis of Settlement Efficiency topics continued in 2019. A third workshop on market settlement efficiency took place in June 2019 with a particular focus on aged transactions. The analysis identified that settlement efficiency in T2S could potentially be improved through the cancellation of aged transactions.
For this reason, CSDs committed themselves to a more active approach towards cleaning up aged settlement transactions and to continuing the analysis of and dialogue with participants on late matching.
The appetite for action may also be driven by the introduction of the new CSDR settlement discipline regime cash penalty mechanism in November 2020. Under this mechanism, aged transactions, among others, will attract penalties alongside the late matching transactions, irrespective of their original intended settlement day.
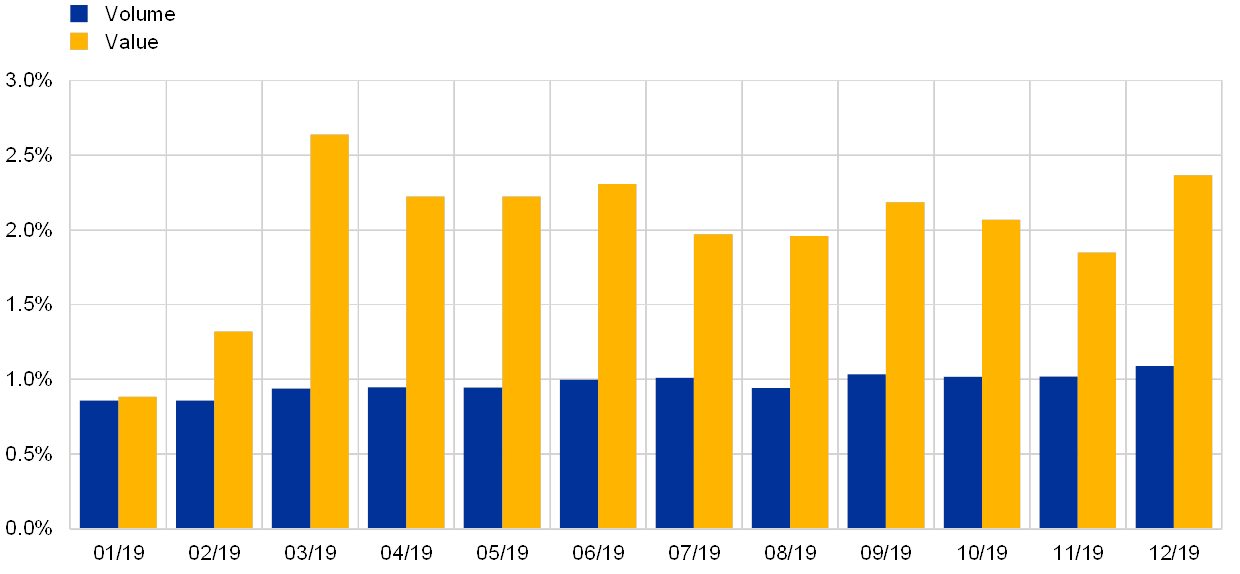
1.4 Unsettled transactions
At the end of each day, unsettled transactions remain in the system and T2S attempts to recycle them for settlement for a period of time known as the recycling period. In other words, the recycling period can be defined as the number of days during which a transaction remains unsettled.
Chart 13 illustrates the daily average volume of unsettled transactions in T2S in 2019. DVP, DWP, PFOD, FOP, SRSE and LQT transactions are included in the calculations.
Chart 13
Volume of unsettled transactions
(number of transactions, daily averages)

In 2019 the daily average number of unsettled transactions reached on average 19,093 transactions, ranging from 16,865 in February to 21,395 in December. This means that, on a daily average basis, out of the total number of transactions process by T2S, 3.07% are unsettled at the end of the day. DVP and FOP represented around 94.32% of all unsettled transactions in volume terms.
Chart 14 shows the daily average value of unsettled transactions in T2S in 2019. The transaction types contributing to the value are DVP, DWP, PFOD and LQT.
Chart 14
Value of unsettled transactions
(EUR billions, daily averages)
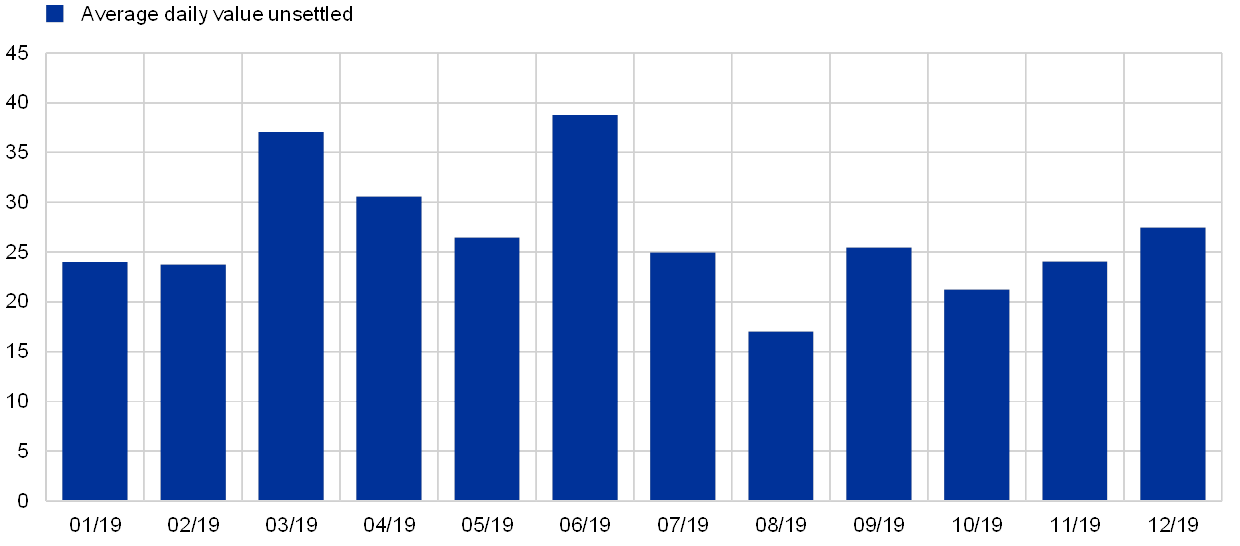
The daily average value of unsettled transactions in T2S ranged between €17.04 billion in August and €38.78 billion in June. The lower values observed in August in particular are due to seasonal effects. DVP represented 92.08% of all unsettled transactions in value terms, followed by PFOD with 5.10%.
Not all transactions offered for processing in T2S are settled on the intended settlement day. This may be, for example, because the resources needed for settlement are not available or because one of the two instructions is on hold. The unsettled transactions are automatically recycled by T2S on the following business day(s). Chart 15 shows the share of unsettled transactions and the recycling days required before settling.
Chart 15
Average unsettled transactions per number of recycling days
(percentages, number of recycling days)
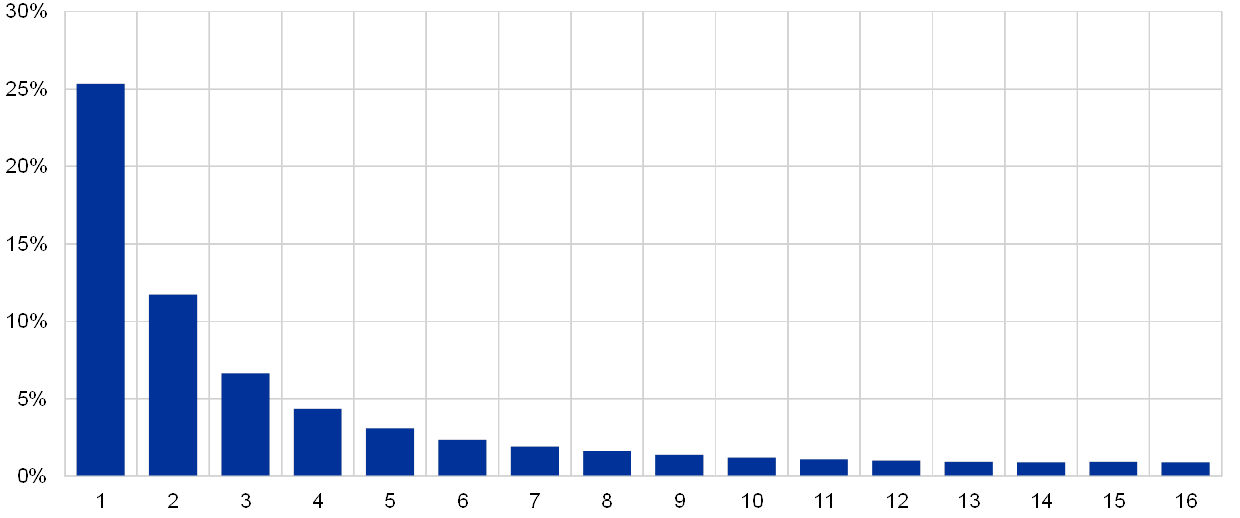
In particular, it shows that on average 25.35% of unsettled transactions sent for recycling were settled on the following business day (first column) and less than half of those (or 11.73% altogether) remained pending for two days. Only 0.92% remained pending for 16 days (last bar).
1.5 Use of auto-collateralisation
Auto-collateralisation in T2S is a credit operation that is triggered when a buyer does not have sufficient funds to settle a securities transaction in order to improve its cash position and secure the funds necessary to settle the transaction. Auto-collateralisation is an automatic process which is aimed at facilitating smooth real-time DVP settlement in central bank money.
Two types of auto-collateralisation are available in T2S:
- Auto-collateralisation on-flow refers to the use of the securities which are about to be purchased as collateral to secure the necessary credit to complete the transaction.
- Auto-collateralisation on-stock is the use of other securities already held by the buyer as collateral to complete the transaction.
In 2019 the overall use of auto-collateralisation reached a daily average value of €103.91 billion. Chart 16 shows the daily average value of auto-collateralisation per month, broken down by type. The daily average use of auto-collateralisation ranged between €93.02 billion in February and €117.02 billion in September.
Chart 16
Value of auto-collateralisation
(EUR billions, daily averages)

In general, the use of auto-collateralisation follows a similar pattern to that observed for the daily average value of DVP transactions settled throughout the year.
On average, 80.63% of the total value of auto-collateralisation was represented by auto-collateralisation on-flow (corresponding to €83.78 billion) and 19.37% by auto-collateralisation on-stock (corresponding to €20.12 billion). While the use of the latter remained relatively stable in 2019, the use of the former displayed a more volatile pattern, reaching a peak of €96.02 billion in June 2019.
In 2019 the overall use of auto-collateralisation at monthly level ranged between €1,860.47 billion in February and €2,513.98 billion in October. Chart 17 shows the monthly total value of auto-collateralisation, broken down by RTS and NTS, and the value of auto-collateralisation as a share of DVP transactions.
Chart 17
Real-time and night-time use of auto-collateralisation
(left-hand scale: EUR billions; right-hand scale: percentages, monthly totals)

On average, 79.44% of auto-collateralisation was used during RTS (corresponding to €1,754.01 billion) and 20.56% during NTS (€454.05 billion) in 2019. The use of auto-collateralisation in RTS and NTS follows a similar pattern to that of the daily average value of transactions settled in T2S (See Chart 8). Auto-collateralisation use during RTS peaked in October (at €2,019.88 billion), while its use during NTS peaked in January (at €505.48 billion).
In 2019 the use of auto-collateralisation represented on average 12.71% of the total monthly value of DVP transactions settled and remained largely stable over the year. As the chart shows, auto-collateralisation use as a share of DVP reached its highest point in October (13.03%).
1.6 Intra-CSD and cross-CSD settlement
In T2S there are multiple technical ways in which investors can access different markets linked to T2S. Depending on the number of CSDs involved, it is possible to distinguish between intra-CSD and cross-CSD traffic:
- Intra-CSD traffic refers to securities transfers where the delivering and the receiving parties belong to the same CSD.
- Cross-CSD traffic is when the delivering and receiving parties belong to different CSDs.
In T2S, intra-CSD transactions represent the vast majority of all settled transactions, in terms of both volume and value.
Chart 18
Intra-CSD settlement
(percentages, daily averages)
As illustrated in Chart 18, in 2019 the daily average volume of intra-CSD transactions represented 99.03% of all settlement volumes in T2S, while the daily average value of intra-CSD settlement represented 98.00% of all settlement values in T2S.
Conversely, only a very small percentage is attributable to cross-CSD traffic. Chart 19 shows the share of cross-CSD transactions compared with total transactions settled in T2S, in terms of daily average volume and value, in 2019.
Chart 19
Cross-CSD settlement
(percentages, daily averages)
In 2019 the daily average volume of cross-CSD settlement transactions represented 0.97% of all settlement volumes in T2S, while the daily average value of cross-CSD settlement transactions represented 2.00% of all settlement values in T2S. The share of cross-CSD traffic increased as of March 2019, which also represents the series peak.
However, the low cross-CSD settlement figures must be treated with caution, as they do not provide a comprehensive picture of cross-CSD activity in T2S. In fact, there are some specific data related to cross-border settlement activity that are not readily available in T2S statistics. This mostly results in domestic transactions being aggregated with intra-CSD settlement statistics, such as transactions settled between two participants of the same CSD where one of them is an external CSD participant.
After further analysis of the low level of cross-CSD market activity in T2S,[4] the following underlying reasons were identified:
- While the consolidation of the domestic markets is still ongoing, the CSDs and their communities have started focusing on other priorities, such as the CSDR. As a result, strategic initiatives, such as developing the use of CSD links or refactoring the operating model for centralising activities for CSD participants, have often been slowed down or put on hold.
- Custodians currently use T2S to offer an enhanced service to their customers investing across borders. This increases competition and decreases the demand for direct cross-CSD settlement.
Some barriers to cross-border settlement integration remain, but their resolution lies to a great extent outside the competency of T2S stakeholders: e.g. remaining gaps in compliance with corporate action (non-T2S) market standards and lack of harmonisation of withholding tax relief procedures.
1.7 Interaction between T2S and connected RTGS systems
At the start of each day, liquidity is sent from the Real-Time Gross Settlement (RTGS) accounts to the dedicated cash accounts (DCAs) in T2S. During the day, liquidity can be transferred from the RTGS system to T2S and vice versa. At the end of the day, all remaining liquidity is pushed back from the DCAs in T2S to the RTGS accounts.
All T2S DCAs must have a zero balance at the end of the day. Any remaining position is transferred to the respective RTGS accounts via the EoD cash management process (referred to as EoD debits).[5]
1.7.1 Interaction between T2S and TARGET2
Inbound liquidity transfers are transfers from the TARGET2 RTGS accounts to the T2S DCAs, while outbound liquidity transfers are transfers from the T2S DCAs to the TARGET2 RTGS accounts.
Chart 20 shows the daily average volumes of liquidity transfers between TARGET2 RTGS accounts and T2S DCAs in 2019. The daily average volume of inbound liquidity transfers from TARGET2 was 573, while the daily average volume of outbound liquidity transfers to TARGET2 was 677.
Chart 20
Volume of liquidity transfers between TARGET2 RTGS accounts and T2S DCAs
(number of transactions, daily averages)
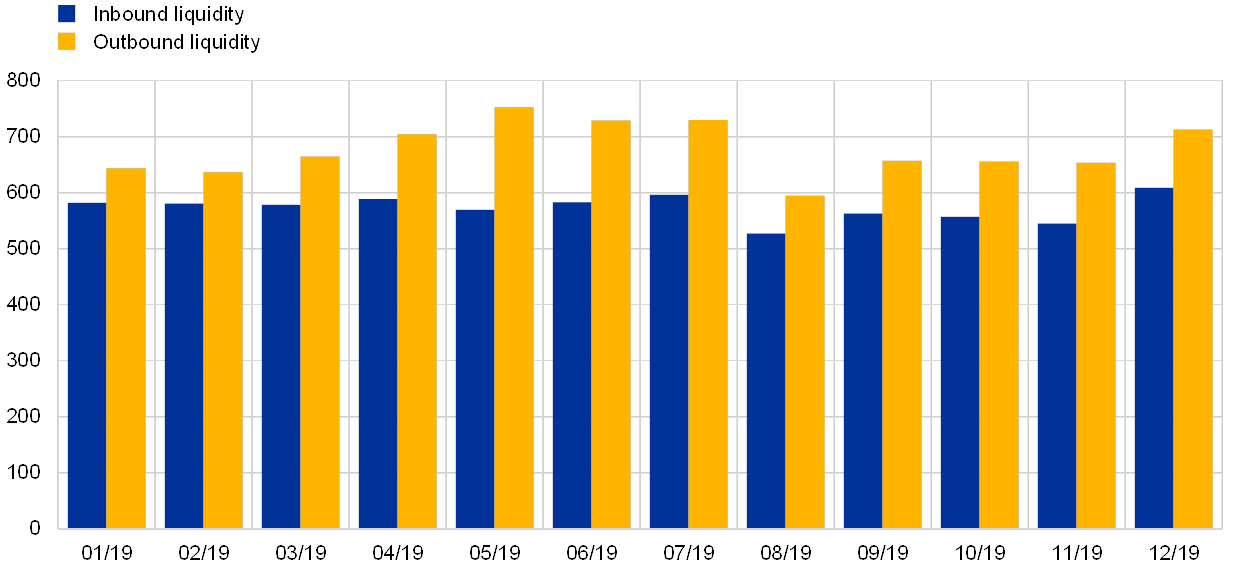
Chart 21 shows the daily average value of liquidity transfers between TARGET2 RTGS accounts and T2S DCAs in 2019. The daily average value of inbound liquidity transfers from TARGET2 was €124.34 billion, while the daily average value of outbound liquidity transfers to TARGET2 was €127.95 billion.
Chart 21
Value of liquidity transfers between TARGET2 RTGS accounts and T2S DCAs
(EUR billions, daily averages)
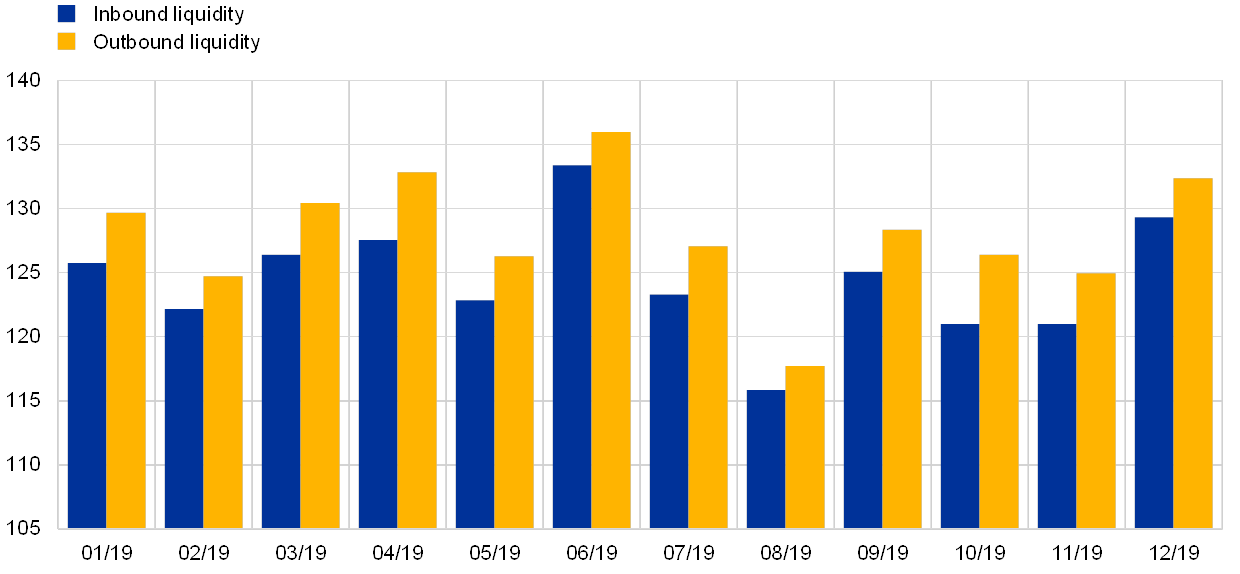
At the end of the day, any existing difference between inbound and outbound liquidity (See Chart 21) is balanced via the EoD cash management process.
1.7.2 Interaction between T2S and Kronos2
Inbound liquidity transfers are transfers from the Kronos2 RTGS accounts to the T2S DCAs, while outbound liquidity transfers are transfers from the T2S DCAs to the Kronos2 RTGS accounts.[6]
Chart 22 shows the daily average volumes of liquidity transfers between Kronos2 RTGS accounts and T2S DCAs in 2019. The daily average volume of inbound liquidity transfers from Kronos2 was 46 transfers, while the daily average volume of outbound liquidity transfers to Kronos2 was 173 transfers.
Chart 22
Volume of liquidity transfers between Kronos2 accounts and T2S DCAs
(number of transactions, daily averages)

Chart 23 shows the daily average value of liquidity transfers between Kronos2 RTGS accounts and T2S DCAs in 2019. The daily average value of inbound liquidity transfers from Kronos2 was €2.69 billion, while the daily average value of outbound liquidity transfers to Kronos2 was €2.80 billion.
Chart 23
Value of liquidity transfers between Kronos2 accounts and T2S DCAs
(EUR billions, daily averages)

As with the interaction between TARGET2 RTGS accounts and T2S DCAs, any difference between inbound and outbound liquidity at the end of the day is balanced via the EoD cash management process.
2 T2S service level and availability data
2.1 Technical availability
The Eurosystem pays particular attention to the good functioning and operation of the system. The availability of the services is measured continuously and objectively for predefined components of T2S throughout each settlement day with the exclusion of the maintenance window.
One way in which the punctuality of T2S is measured is by counting the actual duration of three defined phases of the Business Day and comparing the results with the expected target durations.
The following three phases of the business day are relevant for calculating the key performance indicator (KPI) on the duration:
- SOD – Start of Day – measures the elapsed time between the start-of-day event (BDCD) and the end-of-start-of-day event (ESOD);
- NTS + reporting – Night Time Settlement including reporting – measures the elapsed time between the start of NTS (C1P0) and the end of NTS reporting;
- EOD – End of Day – measures the elapsed time between the start of the end-of-day phase (SEOD) and the end-of-day reports (EEOR).
Table 2 shows the target durations and actual average durations of the three different phases for each month in 2019. The figures show that the platform generally operated within the target expectations in 2019. With the sole exception of the SOD in February, the actual average duration was below the target for each phase in every month.
Table 2
Duration for the three phases of the business day by month
Actual average duration of the three phases on a monthly basis (minutes)

2.2 Incidents in T2S
The ECB is dedicated to ensuring the smooth operation of the T2S system during normal operations and to steering activities aimed at restoring the proper functioning of the T2S services by mitigating the effects of incidents.
In 2019 the T2S platform experienced six major incidents, described as unplanned interruptions or reductions in the quality of an agreed service for which a Crisis Managers’ conference call was required. Three of the incidents were related to a delay request originating from a T2S actor. Each of the other three major incidents was followed up with relevant incident reporting in the Operations Managers Group (OMG) and served as input for the continuous improvement of the service and for the strengthening of capabilities for coping with, mitigating or preventing threats in future. The market was kept informed of any service degradation in T2S.
By comparison, in 2018 the T2S platform registered eight major incidents, of which six related to a delay request originating from a T2S actor and two concerned platform issues.
Chart 24
T2S Service Level Indicator in 2019
(percentages)

As illustrated in Chart 24, throughout 2019, the service level indicator – computed as the weighted average of the platform services – was equal to or above the KPI target of 99.7%. Overall, the results demonstrate a consistently high performance of the platform.
2.2.1 April incident
A major incident occurred during the restart of RTS procedures on 17 April 2020. The root cause was found in the incorrect loading of auto-collateralisation templates at the start of the RTS after NTS resulting in incorrect data in the module used for the settlement of transactions (SETT) and subsequent misalignment between this module and the module performing the validation and matching of individual settlement instructions (Life Cycle Management and Matching – LCMM). This prevented instruction status updates from being correctly reported to T2S Actors – Application-to-Application (A2A) messages were not created. It also prevented, through a misalignment of the information database, the retrieval of updated information via User-to-Application (U2A) queries. As a result of the incident, T2S crisis managers decided to delay the change of business date for 18 April from 18:45 to 22:05. Within the same business day, all the necessary actions to identify the root cause were taken. This was then resolved in the course of the next business day. The missing messages affected CSDs’ EoD reconciliation activities for several days. As a follow up to the incident, the OMG identified several operational tools, some of which have been implemented and some of which will be implemented as part of future T2S releases.
3 T2S financial performance
3.1 Cost recovery objectives
The financial position of T2S is determined by trends regarding costs and revenues. The platform operates on a full cost recovery basis, meaning that all costs incurred should be covered by the revenues generated. The T2S pricing structure is defined in Schedule 7 of the T2S Framework Agreement and its cost recovery is driven by three factors:
- the transaction volumes that are settled in T2S;
- the fees that are charged to T2S users for using its services;
- the predefined T2S cost recovery period.
3.1.1 T2S price increase on 1 January 2019
In November 2010 the ECB’s Governing Council decided to set the T2S DVP price at €0.15 per instruction. The price remained at this level after the go-live of T2S in June 2015.
In June 2018 the Governing Council approved new baselines for T2S pricing in order to continue to pursue full cost recovery while maintaining the pricing structure unchanged in terms of the weights for the different tariff items. This consisted of:
- an increase in the T2S DVP price from €0.15 to €0.195, with a temporary surcharge of €0.04 to reflect lower than anticipated volumes (effective as of 1 January 2019);
- an extension of the T2S cost recovery period from 8.75 to 14.5 years (i.e. until the end of 2029).
Table 2 shows the T2S pricing structure before and after the January 2019 price adjustment.
Table 2
T2S pricing structure
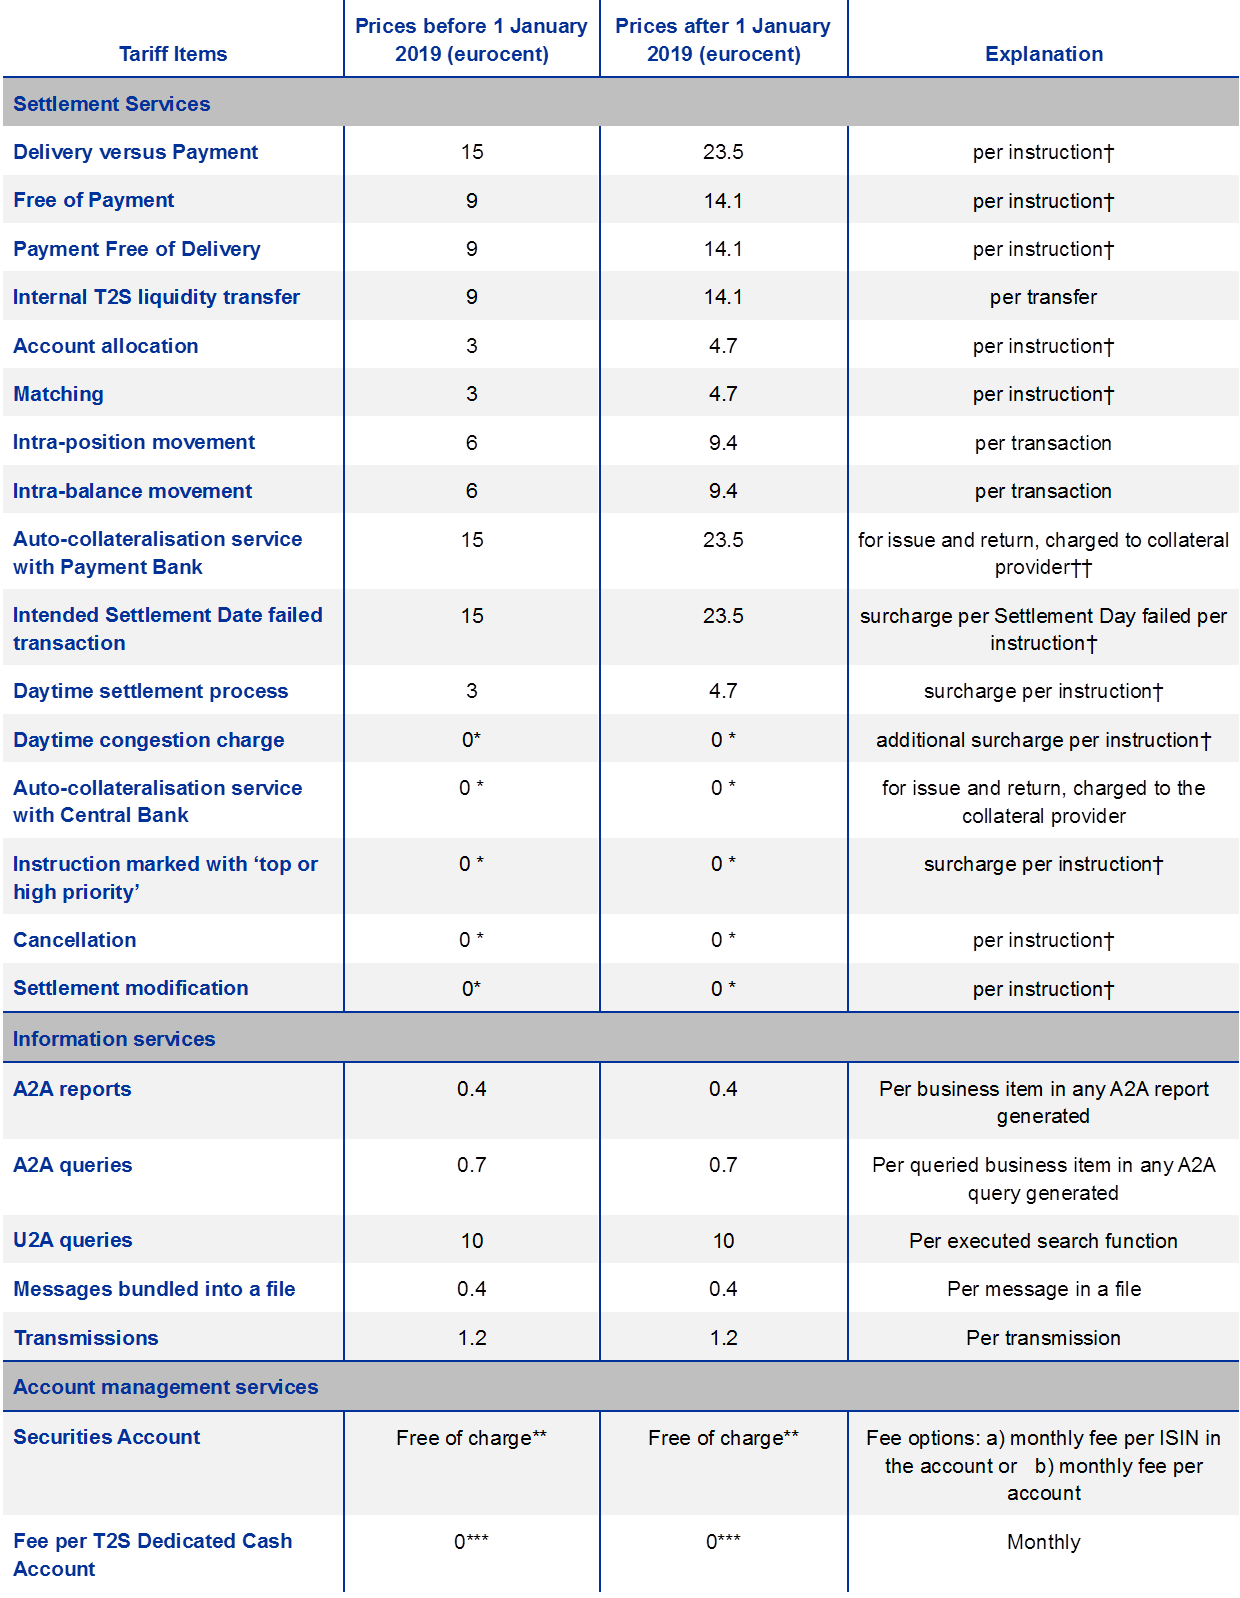
† Two instructions per transaction are charged.
†† The auto-collateralisation with the payment bank (i.e. client-collateralisation) is charged in line with the usage of T2S resources; only the collateral provider is charged. One collateralisation item plus both instructions of each auto-collateralisation leg are charged per International Securities Identification Number (ISIN) and providing account, i.e. X cents * 5 (i.e. 1 collateralisation item + 4 settlement instructions) for each auto-collateralisation service with the payment bank, where X is the price of settlement instructions and collateralisation items.
* T2S is scaled in accordance with an expected consumption pattern, i.e. the anticipated distribution of settlement volumes during night-/day-time and peak hours. These items were initially set at a zero tariff, presuming that actual usage of T2S would remain within this expected consumption pattern over time. However, should there be a stronger than expected use of T2S resources or should the volume distribution pattern be different than expected, thus adversely affecting T2S performance, charging for these items will be reconsidered. The Eurosystem regularly reviews the actual volumes against expected patterns for the different items.
** Account management services for securities accounts are set at zero and will not be changed until at least the end of the cost recovery period.
*** Account management services for T2S dedicated Cash Accounts (DCAs) are not charged, presuming that the actual number and usage of DCAs will remain within expected consumption patterns. However, should DCAs involve a stronger than expected use of T2S resources, thus adversely affecting T2S performance, charging for these items will be reconsidered. The Eurosystem regularly reviews the matter together with the central banks operating the DCAs.
Key considerations that led into this decision included:
- the latest information on T2S operating costs, including the expected impact of (a) the additional costs associated with enhancing the T2S platform’s resilience to cyber threats and (b) the operational savings expected to be made from the ongoing TARGET2/T2S consolidation project, which is expected to be concluded in November 2021;
- actual T2S traffic and revenues in the first three years of operation (June 2015 to June 2018), which was also affected by the gradual migration of some of the largest T2S markets;
- the latest update of the assumptions regarding the future evolution of T2S volumes, based on feedback received from the market (AMI-SeCo).
3.2 Financial performance of T2S
The overall financial position of T2S is detailed in the annual T2S financial statements, which are prepared in accordance with specific accounting policies established by the Market Infrastructure Board (MIB). In the interests of clarity, the financial information is presented in a similar manner to a profit and loss report (T2S operating statement) and a balance sheet report (T2S financial situation report).
The T2S operating statement shows yearly accumulated revenues (collected on a monthly basis) and yearly operational costs (paid on a quarterly basis). The T2S financial situation report provides a snapshot of relevant items in the asset and liability accounts.
For more information on the T2S financial position, see the latest T2S financial statement for 2018.[7]
3.3 Analysis of revenues collected in 2019
Chart 25 shows the split (in percentages) of T2S revenues between settlement services (SETT) and information services (INV). The SETT revenue derives from the core settlement services that are available continuously during the night-time and daytime settlement periods, except for a short period during the maintenance window. Information services include services related to T2S information items, such as queries and reports. As part of this service, a CSD or an NCB may query any of its own assigned accounts, but not those of others.
As can be seen in Chart 25, in 2019 approximately three-quarters (73.4%) of T2S revenues stemmed from settlement services, while approximately one-quarter (26.6%) stemmed from information services. The settlement services portion of T2S revenues has been increasing over the years (with a concomitant reduction in the information services portion of T2S revenues), mainly owing to the gradual migration of some of the largest T2S markets in the first years of the platform’s operations, as well as the increase in T2S prices in January 2019.[8]
Chart 25
Share of T2S revenue from settlement services and information services
(percentages)

Table 3 shows the split (in percentages) of T2S revenues between settlement services (SETT) and information services (INSV) by tariff item. In 2019 the tariff items that contributed the most to the settlement services portion of T2S revenues were DVP (46.0%) and FOP (9.9%). The tariff items that contributed most to the information services portion of T2S revenues in 2019 were transmission (20.3%) and A2A reports (3.7%).
Table 3
Share of T2S revenue from settlement and information services by tariff item
(percentages)

4 T2S risk management and compliance
4.1 Risk management
Managing operational and information security risk is a key element of the governance structure of T2S.
T2S governance is based on the ECB Guideline on T2S[9], which lays down the responsibilities of the Governing Council and MIB concerning T2S, including their risk management-related responsibilities. Thus, the Governing Council decides on the general operational aspects of T2S, including the T2S risk management framework. The MIB’s responsibilities include, among others, preparing proposals for decision (in full respect of the mandates of the European System of Central Bank (ESCB) committees[10]) as regards the T2S risk management framework and implementing and managing the relevant risk management frameworks.
The T2S risk situation, including risk analysis and mitigation measures (if required), is shared on a regular basis with the CSDs and NCBs via the relevant fora: the Operations Managers Group (OMG), the Project Managers Group (PMG), the CSD Steering Group (CSG) and the Securities Managers Group (SMG). Within the context of their own risk management activities, and complying with their own national regulatory requirements, CSDs and NCBs flag new risks to the relevant T2S governance bodies if they consider the risks relevant.
4.2 Oversight
The Eurosystem conducts the oversight of T2S as laid down in the Eurosystem oversight policy framework. The ECB has primary oversight responsibility for T2S and leads and coordinates all oversight activities. T2S oversight is conducted against a subset of the principles for financial market infrastructures (PFMIs) established by the Committee on Payments and Market Infrastructures (CPMI) and the International Organization of Securities Commissions (IOSCO) considered relevant for T2S by the Eurosystem. The PFMIs are the international standards for financial market infrastructures (FMIs), i.e. payment systems, CSDs, securities settlement systems, central counterparties and trade repositories. Although T2S does not fall within the definition of an FMI provided in the PFMI report, the Eurosystem decided to apply the PFMIs to T2S as these principles relate to functions performed by T2S, i.e. the settlement and recording of securities transactions.
In the course of 2018, the ECB oversight function launched the first comprehensive assessment of T2S since its go-live. The T2S comprehensive assessment process is based on the analysis of a self-assessment questionnaire completed by the T2S operation function,[11] as well as of the supporting documentation on T2S. The final assessment report, approved by the Governing Council in 2019, presented the oversight function’s view on the extent to which T2S meets the PFMIs. The report concluded that T2S is largely compliant with the PFMIs. While shortcomings were identified in certain areas, none were assessed to pose a serious risk if not addressed promptly. In response to the request by the oversight function, the T2S operation function commenced at the end of 2019 the work on an action plan to address in a timely manner a number of recommendations and observations aimed at enhancing the safety and efficiency of T2S.
In 2019 the operation function shared the information requested by the oversight function to support the conduct of the oversight assessments regarding operational incidents and changes to the system implemented with T2S Releases 3.0 and 3.2. Furthermore, the operation function provided the oversight function with aggregated settlement statistics and information on operational and financial performance, as well as on risk management, testing and migration activities, with a view to supporting the oversight function’s monitoring of T2S activities that are relevant from an oversight perspective.
With regard to cyber resilience, the ECB published the cyber resilience oversight expectations (CROE) in December 2018. One of their key purposes is to provide FMIs with detailed steps for fostering improvements and enhancing their cyber resilience over a sustained period. Following a self-assessment exercise against the CROE on TARGET2 conducted by the operator on the request of the oversight function in the course of 2019, a similar exercise for T2S is to be concluded in 2020.
4.3 External examination
T2S services are performed on a single technical platform integrated with central banks’ RTGS systems for all participating currencies. Under the T2S Framework Agreement, the Eurosystem and the CSDs agreed that the performance of T2S services shall be subject to technical and operational examinations performed by an external examiner. These examinations provide an independent, third-party assessment to all participating CSDs based on the established industry norm (ISAE 3402). The external examiner has to be a well-reputed, internationally active accounting firm.
The objective of these examinations is to provide the CSDs with reasonable assurance that (a) the organisation set up by the Eurosystem meets the obligations established in the Framework Agreement and (b) the controls implemented by the Eurosystem are suitably designed, effective, and allow for efficient risk assessments to meet the security objectives.
As required by its statute, the Eurosystem conducted a public tender in 2018 and appointed an external examiner for T2S. The first external examination of T2S services took place in 2019, examining T2S services during 2018. Apart from some exceptions, the external examiner confirmed that the examined T2S controls were both suitably designed and implemented and had operated effectively throughout the examination period from 1 January 2018 to 31 December 2018. The findings and recommendations from the 2018 examination report will be addressed via a comprehensive action plan.
The external examination covering 2019 will be performed in 2020. These external examinations will henceforth be a regular yearly exercise.
5 System evolution
5.1 Regular software updates
T2S evolution reflects changes in business needs, regulatory factors and applicable market standards, along with some changes considered to be of a maintenance nature. The typical T2S yearly release schedule includes one major release and one minor release, including change requests (CRs) and production problems (PPs), as well as two production problem releases which only schedule problem tickets (PBIs).
5.1.1 T2S releases in 2019 (R2.3, R3.0, R3.1 and R3.2)
On 7 June 2019, a major T2S release, Release 3.0, went live, with the deployment to production of 12 change requests (listed in the table below). These changes covered a wide range of functional areas, including an upgrade to ISO 2017 message versions; changes to the handling of buy-in information and changes to the communication of settlement finality timestamps.
A minor release, Release 3.2 in November 2019, deployed six change requests to production, including the introduction of the status “Failing” for settlement instructions and a new partial release functionality. This functionality, by allowing a finer control over the quantities allowed to settle, especially through omnibus accounts, could contribute to further increasing the settlement efficiency in T2S over time.
In addition to the scheduled T2S releases (Releases 3.0 and 3.2), two further T2S releases were deployed to fix known production problems. The first of these (Release 2.3, with 24 fixes) was deployed to production in February 2019. The second (Release 3.1, with 21 fixes) was deployed to production in September 2019.
The number of change requests deployed and production problems resolved in 2019 is shown in Table 4.
Table 4
T2S releases in 2019
Table 5
Change requests of T2S Release 3.0
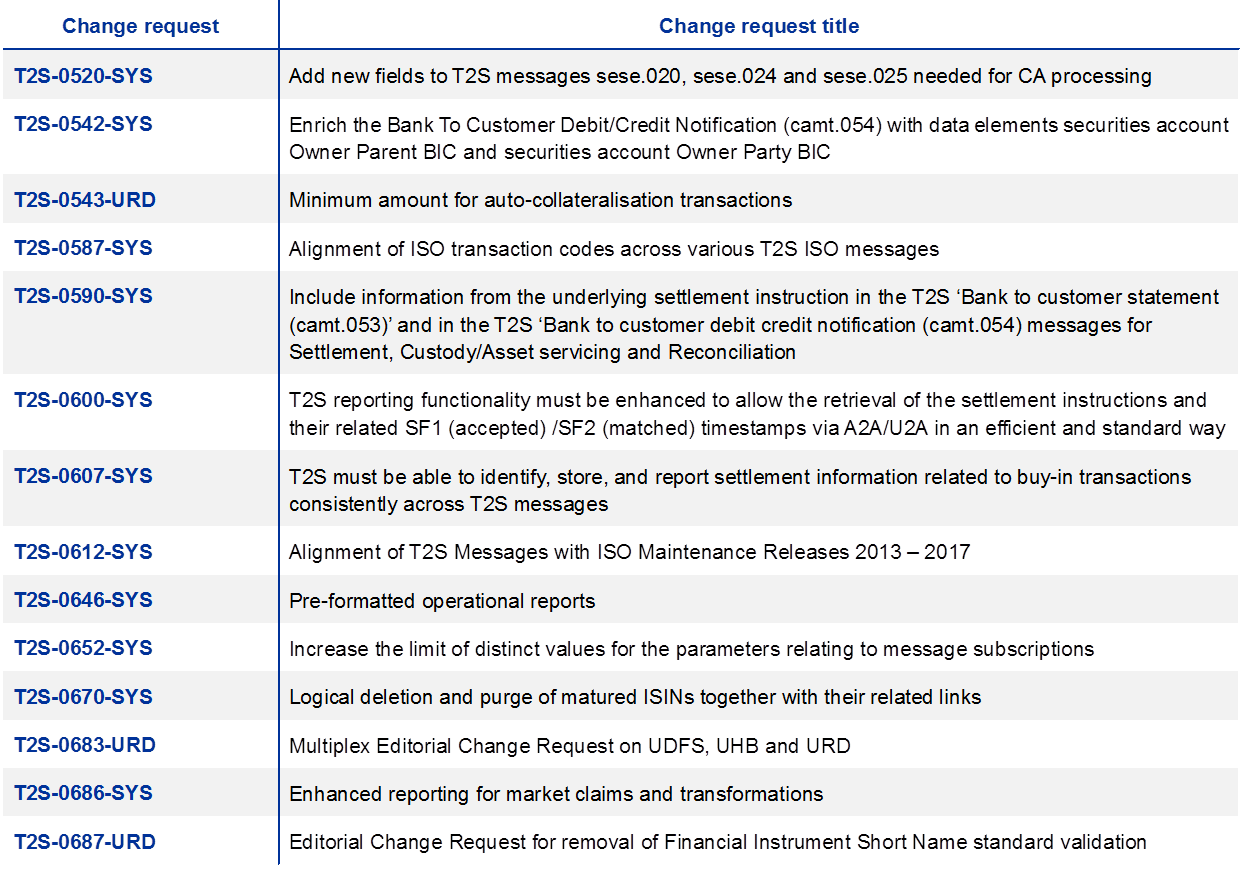
Table 6
Change requests of T2S Release 3.2

5.1.2 Future system evolution
In 2020 changes to T2S will be delivered in two releases, Release 4.0 in June 2020 and Release 4.2 in November 2020. The changes planned for June 2020 will include enhancements focused on the T2S settlement module, additions to the information exchanged between T2S users and T2S, and the first deployment of a change request related to the T2-T2S consolidation project.
Changes planned for November 2020 include the deployment of the T2S Penalty Mechanism, changes related to the CSDR (see Box 3), an upgrade of ISO messages, and further deployments related to the T2-T2S consolidation project.
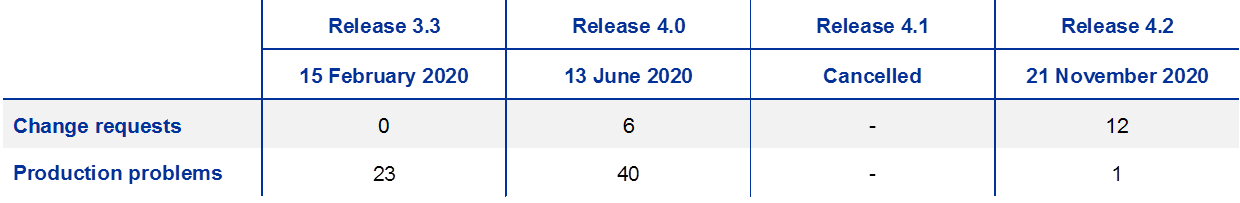
In addition to the major and minor releases in 2020, one production problem release (Release 3.3) was deployed on 15 February 2020. The second production problem release (Release 4.1) was cancelled in 2020 to maximise the testing time available for Release 4.2. The number of change requests and production problems scheduled in 2020 is shown in Table 7, although this may be subject to change.
Table 7
T2S releases in 2020*
* Provisional
Looking further ahead, in June 2021 improvements will be made to T2S cash forecasting and further changes related to the T2-T2S consolidation project will be deployed in anticipation of the go-live of this project, which is scheduled for November 2021.
For further information, see the full list of T2S change requests and the detailed scope of T2S releases on the ECB’s website.
Box 3
CSD Regulation (CSDR)
T2S penalty mechanism – on track for implementation in November 2020
In November 2020 the Eurosystem will provide a major set of new functionalities to support T2S CSDs in their compliance with the CSDR settlement discipline regime via the T2S penalty mechanism.
The T2S penalty mechanism offers identification, calculation and reporting of cash penalties to T2S CSDs based on the analysis of failed transactions in T2S, as well as a set of operational tools deemed necessary in this context.
The full set of scope-defining documents and the draft of the future ISO20022 message for cash penalties were drawn up in 2019. In addition, further change requests have been approved for implementation in order to ensure closer alignment with regulatory requirements and less operational work for T2S CSDs.
The T2S penalty mechanism is on track for a successful implementation in November 2020, ahead of the entry into force of the settlement discipline regime which is now proposed for 1 February 2021 by the European Securities and Markets Authority (ESMA).[12]
5.2 Consolidation of TARGET2 and T2S
In 2019 the T2-T2S consolidation project approached the end of its functional specification phase. The project will replace the current TARGET2 with a new RTGS system and will introduce a tool for centralised liquidity management (CLM) across all TARGET services.
During the year the User Detailed Functional Specification (UDFS) was revised on the basis of more than 1,900 comments
Benefiting from comments received from more than 40 institutions during the public market consultation and incorporating input from international market practice groups (e.g. HVPS+), UDFS version 2.0 was published in July 2019 and further refined during the third and fourth quarters of the year, resulting in the publication of UDFS v2.1 in mid-December 2019. The later version had no public market consultation.
T2S will benefit in particular from the new features offered by the consolidation, such as the enhanced liquidity management tools (including overnight liquidity on T2S), increased cyber-resilience with the migration to the Eurosystem Single Market Infrastructure Gateway (ESMIG), and the new data warehouse.
Eurosystem Single Market Infrastructure Gateway (ESMIG)
As part of the T2-T2S consolidation project, the Eurosystem will offer access to all its market infrastructure services via a harmonised interface. The Eurosystem Single Market Infrastructure Gateway (ESMIG) will be the entry point to all TARGET services, all common components and the Eurosystem Collateral Management System (ECMS).
In July 2019 the Eurosystem granted concessions for the provision of ESMIG connectivity services to SWIFT and SIA-COLT. In December 2019 Banca d’Italia gave the green light to the two network service providers after they passed compliance checks against the technical requirements.
5.3 Eurosystem Collateral Management System (ECMS)
The Eurosystem Collateral Management System (ECMS) will be a single collateral management system used to manage eligible assets mobilised as collateral in Eurosystem monetary policy operations, replacing the current local collateral management systems. The ECMS will interact with the CLM module within T2 in order to ensure the settlement of payments stemming from monetary policy operations, corporate actions and fees, and to update the credit line. In addition, the ECMS will interact with T2S for the settlement of securities and the management of the auto-collateralisation process. The resulting synergies are expected to benefit NCBs and all other ECMS players in their communities – counterparties, CSDs and tri-party agents (TPAs) – by contributing to the efficient exchange of securities, collateral and liquidity within the Eurosystem. It will be accessible via a single common interface across jurisdictions and will facilitate the mobilisation of cross-border collateral.
In 2019 the Eurosystem completed the specifications of the system, leveraging on harmonisation proposals agreed on by the Eurosystem and AMI-SeCo that were relevant to the Eurosystem’s collateral management activities. Further details on the functions and features of the ECMS are also available in the Business Description Document for the ECMS on the ECB’s website.
© European Central Bank, 2020
Postal address 60640 Frankfurt am Main, Germany
Telephone +49 69 1344 0
Website www.ecb.europa.eu
All rights reserved. Reproduction for educational and non-commercial purposes is permitted provided that the source is acknowledged.
For specific terminology please refer to the ECB glossary (available in English only).
PDF ISBN 978-92-899-4363-5, ISSN 2599-9257, doi: 10.2866/590085, QB-CH-20-001-EN-N
HTML ISBN 978-92-899-4364-2, ISSN 2599-9257, doi: 10.2866/000101, QB-CH-20-001-EN-Q
- For further details on the definition of the settlement efficiency indicators, please refer to Section 1.3.
- As of 29 October 2018, all the charts related to settled values also include transactions settled in Danish krone. The traffic in Danish krone is converted into euro at an exchange rate of €0.13 to DKK 1.
- As SRSE and FOP transactions do not imply a cash movement on a dedicated cash account (DCA), these two transaction types do not contribute to the calculation of value-based statistics.
- See the AMI-SeCo report of November 2017 on cross-CSD market activity in T2S.
- EoD debits represent the push of liquidity from T2S back to TARGET2 and are not included in the calculations to avoid double-counting.
- Kronos2 is the RTGS system of Danmarks Nationalbank. The traffic in Danish krone is converted into euro at an exchange rate of €0.13 to DKK 1.
- The T2S financial statement for 2019 will be made available in June 2020. Following its publication, the T2S Annual Report 2019 will be updated to include a link to the latest financial statement.
- See Section 3.1for more information on the T2S price increase.
- 2012/473/EU: Guideline of the European Central Bank of 18 July 2012 on TARGET2-Securities (ECB/2012/13) (OJ L 215, 11.8.2012, p. 19).
- See the Market Infrastructure Board’s mandate.
- The four central banks responsible for operating T2S (the Deutsche Bundesbank, the Banca d’Italia, the Banco de España and the Banque de France) and the ECB.
- See “ESMA proposes to amend the technical standards in view of the postponing of the entry into force of the CSDR settlement discipline”, ESMA, 5 February 2020.