
T2S Annual Report 2018
Introduction
Market infrastructures form the backbone of the financial system. They provide the networks through which financial institutions and financial markets are connected and financial transactions are cleared and settled. Therefore, it is essential to ensure that market infrastructures are safe and efficient, and that they provide for a stable and well-functioning economy. The Eurosystem is closely involved in this work as the conduct of monetary policy depends on the availability of reliable and effective financial market infrastructures. It operates platforms for the settlement of large-value payments (TARGET2), securities (TARGET2‑Securities) and instant payments (TIPS).
TARGET2‑Securities (T2S) came as an initiative to address the highly fragmented securities settlement landscape in Europe. Launched in June 2015 as an integrated platform for processing securities against central bank money, T2S revolutionised securities settlement in Europe by bringing an end to complex cross-border settlement procedures and the difficulties caused by settlement practices that differed from country to country.
T2S provides harmonised and commoditised securities settlement to Central Securities Depositories (CSDs), and applies a single set of rules, standards and tariffs to all participant CSDs. The securities settlement platform therefore lays the foundations for a single market for securities settlement and as a result contributes to achieving greater integration in Europe’s financial market. Today, the T2S platform connects 21 CSDs from 20 European markets and processes around 600,000 securities transactions per day against both euro and Danish kroner.
The report and its structure
This report is the 8th edition of the TARGET2‑Securities Annual Report. The first edition was published in 2011, a pivotal year for the finalisation of the legal and technical documentation of T2S and for the CSDs’ preparation of their T2S adaptation plans.
This year, the report presents the evolution of T2S settlement data, while confirming the continuity of operational stability, and describes the developments which took place in T2S in the course of 2018. The report is mainly addressed to decision-makers, practitioners, lawyers and academics wishing to acquire an in-depth understanding of T2S. It will hopefully also appeal to members of the general public with an interest in market infrastructure issues and T2S in particular.
In addition to the core content, the report includes five boxes, providing detailed information on topics of particular relevance in 2018. The boxes focus, respectively, on the Market Settlement Efficiency workshops; harmonisation in T2S; the impact of the General Data Protection Regulation (GDPR); the nomination of the External Examiner; and the CSD Regulation (CSDR).
TARGET2‑Securites activity
T2S went live in June 2015 and became fully operational at the end of the T2S implementation phase on 18 September 2017, when the final migration wave was completed. The newly-formed Slovakian central securities depository (CSD), NCDCP, also joined T2S on 30 October 2017. This report thus covers the first full year after the end of the T2S migration period.
Charts 1 and 2 show the evolution of volume and value in T2S, as well as settlement efficiency, over the last four years. As illustrated, compared with 2015, the T2S average monthly volumes increased more than fivefold (543%), while the average monthly value almost doubled (88%). Settlement efficiency stabilised both in volume and in value terms, ranging between 96% and 98.5% starting from the year 2017. The year 2018 was the first period of stable, but nonetheless record-high, securities transactions figures since the T2S Go-Live. Prior to 2018, the observed volatility in settlement efficiency (for volume and value) from one migration wave to another can be mostly explained by market behaviour and the adaptation of existing business models to the new platform.
An additional milestone in this reporting year was achieved on 29 October when, for the first time, T2S offered delivery-versus-payment (DVP) settlement in a currency other than the euro. Danmarks Nationalbank successfully connected its real-time gross settlement and collateral management system Kronos2 to T2S, thereby allowing for the settlement of securities transactions in Danish kroner (DKK).[1] On the same date, VP Securities – a Danish CSD that had already been using T2S for settlement in euro – migrated its Danish krone settlement to the platform.
Chart 1
Evolution of volume in T2S
(left-hand scale: number of transactions; right-hand scale: settlement efficiency in percentages)

Notes: Wave 1: 22 June – 31 August 2015; Wave 2: 29 March 2016; Wave 3: 12 September 2016; Wave 4: 6 February 2017; Final wave: 18 September 2017; NCDCP: 27 October 2017; DKK, ID2S: 29 October 2018.
For the evolution of volume in 2018, see Section 1.
Chart 2
Evolution of value in T2S
(left-hand scale: EUR billions; right-hand scale: settlement efficiency in percentages)

Notes: Wave 1: 22 June – 31 August 2015; Wave 2: 29 March 2016; Wave 3: 12 September 2016; Wave 4: 6 February 2017; Final wave: 18 September 2017; NCDCP: 27 October 2017; DKK, ID2S: 29 October 2018.
For the evolution of value in 2018, see Section 1.
1 Evolution of T2S settlement data in 2018
Table 1 compares the overall traffic in T2S in 2017 and 2018 in terms of totals, daily averages, the Platform Settlement Efficiency Indicator (PSEI) at End-of-Day (EoD), the Market Settlement Efficiency Indicator (MSEI)[2] at EoD and percentage changes, both in value and volume terms.
Table1
Summary of T2S evolution of settlement data and market settlement efficiency

*MSEI (EoD) for 2017 is available for the period September-December 2017 only.
Note: There were 255 operating days both in 2017 and 2018.
In 2018 the T2S turnover amounted to a total value of €236.05 trillion, corresponding to a daily average of €925.69 billion. In volume terms, T2S processed a total of 145,903,975 transactions in 2018[3], corresponding to an average of 572,172 transactions settled per day. Between 2017 and 2018 the value and volume of settled transactions increased by 22.83% and 16.14% respectively.
In 2018 the PSEI at EoD stood at 97.35% in value and 97.44% in volume on average. Compared with 2017, it decreased by 0.37% in value and 0.43% in volume.
The MSEI at EoD stood at 92.97% in value and 93.53% in volume on average. In comparison with the previous year, it decreased by 1.09% in value and 0.93% in volume.
1.1 Volume of settlements in T2S
The section provides an overview of the volume developments at platform level in T2S in 2018.
Chart 3 shows the evolution of T2S daily average traffic in 2018 in volume terms.
Chart 3
Volume of settled transactions
(number of transactions, daily averages)
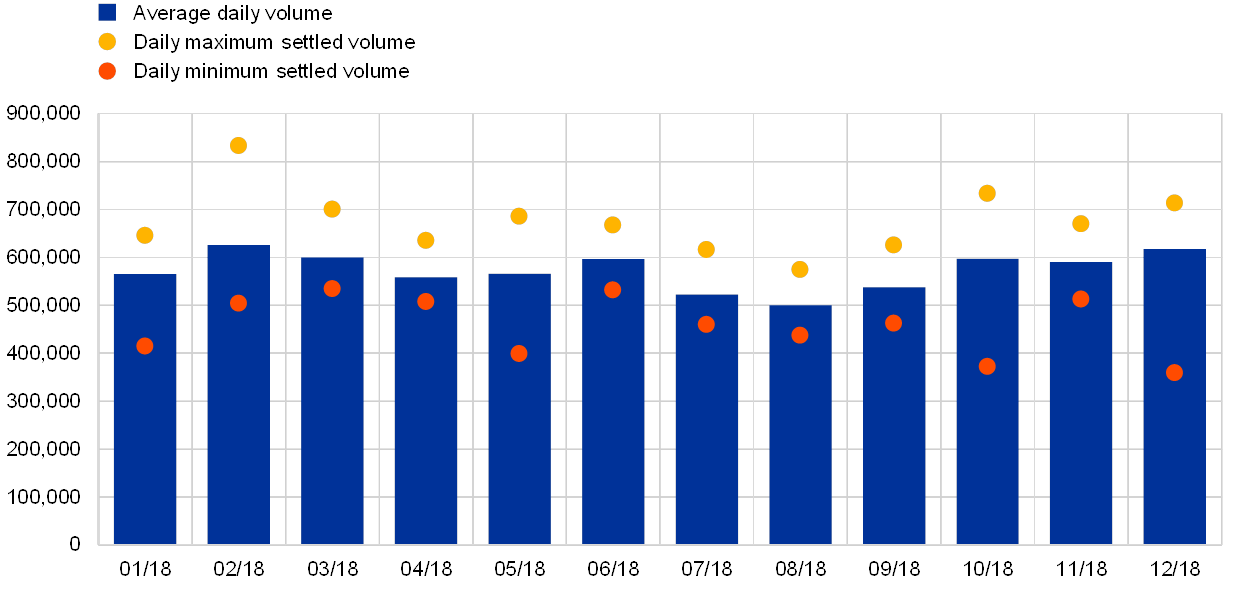
In 2018 T2S settled on average 572,172 transactions per day. Seasonal effects can be observed in the months of July and August, when the daily traffic decreased to an average of 510,905 transactions.
The daily average volume per month ranged between 499,748 (August 2018) and 625,883 (February 2018). At daily level, the maximum traffic settled was registered in February (832,872 transactions), and the minimum in December (359,420 transactions).
Real-time settlement and night-time settlement
T2S operates during the day, when the real-time settlement (RTS) occurs, and also offers the possibility to settle transactions during the night (NTS). The start-of-day process is launched at 18:45 and includes the change of settlement date and the preparation for NTS.
During the night-time phase, settlement instructions and settlement restrictions are selected into cycles/sequences and submitted for optimisation procedures in order to identify sets of settlement instructions and settlement restrictions that can be settled successfully. The first NTS cycle starts at 20:00, and the last NTS cycle is completed at 23:30. At the end of NTS, and before the maintenance window, there is an additional RTS period that includes the preparation for RTS.
There is one technical maintenance window from 03:00 to 05:00, during which T2S is closed for all activities.
RTS is scheduled from 05:00 to 18:00 and includes five partial settlement windows with a duration of 15 minutes each, at 8:00, 10:00, 12:00, 14:00 and 15:45. During the partial settlement windows, T2S partially settles new settlement instructions arriving in T2S and eligible for partial settlement, as well as previously unprocessed or partially processed settlement instructions eligible for partial settlement.
Chart 4 shows the monthly total traffic in volume terms, broken down by NTS and RTS.
Chart 4
Comparison of night-time and real-time settlement volume
(number of transactions, monthly totals)

In 2018, 12,158,665 transactions were settled on average each month, ranging between a minimum of 10,747,235 transactions in September and a maximum of 13,745,534 transactions in October.
As depicted in the graph, there is almost an identical distribution between the volumes settled in NTS and RTS. Of the overall volume, the average traffic settled during NTS accounted for 49.83%, while RTS accounted for 50.17%. In absolute terms, the monthly volume settled in NTS and RTS reached a peak in October 2018, with 6,877,260 and 6,868,274 transactions respectively. In relative terms, the peak volume settled during NTS was in January 2018 (51.02%), whereas the peak volume settled during RTS was in August 2018 (51.41%).
The delivery-versus-payment (DVP) transactions, which represented the majority of the overall T2S traffic, were settled mostly during the NTS phase (59.95%) in volume terms.
Chart 5 displays the T2S daily average traffic broken down by transaction type. Six categories contribute to the T2S volumes: Delivery-versus-Payment (DVP), Free-of-Payment (FOP), Payment-Free-of-Delivery (PFOD), Settlement Restriction on Securities (SRSE), Liquidity transfers (LQT) and Delivery-with-Payment (DWP).
Chart 5
Volume by transaction type
(number of transactions, daily averages)

In 2018, DVP and FOP transactions represented on average the largest contributors to the T2S traffic, together representing around 97.21% of the T2S daily volumes.
T2S settled on average a daily volume of 390,380 DVP transactions (corresponding to 68.23% of the traffic); 165,805 FOP transactions (28.98%); 7,901 PFOD transactions, 6,660 SRSE transactions, 1,274 LQT and 152 DWP transactions (corresponding altogether to 2.79%). The percentage contribution of each of the transaction types to the overall volume is consistent with what has been observed in previous years.
The daily average volume of DVP transactions ranged between 342,714 (August 2018) and 439,159 (February 2018), whereas the daily average volume of FOP transactions ranged between 143,771 (August 2018) and 191,542 (December 2018).
The seasonal effects observed in Chart 3 are also reflected in Chart 5, and are in general proportional to all transaction types.
Lastly, Chart 6 shows the daily average volume settled per securities category.[4]
In 2018 equities represented the largest share of the overall T2S traffic with an average daily volume of 324,748 transactions (57%), followed by entitlements (rights) with 114,520 transactions (20%) and debt instruments with 55,330 transactions. (10%).[5]
Chart 6
Volume by securities category
(number of transactions, daily averages)

The daily average volume of equities ranged between a minimum of 283,686 (August 2018) and a maximum of 355,444 transactions (February 2018). The daily average volume of entitlements (rights) ranged between 98,996 (July 2018) and 133,108 transactions (February 2018). The daily average volume of debt instruments ranged between 45,101 (August 2018) and 60,624 transactions (June 2018). The relevance of each securities category compared with the others remained stable throughout the year.
1.2 Value of settlements in T2S
This section provides an overview of the value developments at platform level in T2S in 2018.[6] As of 29 October 2018, all the charts related to values settled also include traffic settled in Danish kroner. The traffic in Danish kroner is converted into euro at an exchange rate of €0.13 to kr. 1.
Chart 7 shows the evolution of the T2S daily average traffic in 2018 in value terms.
Chart 7
Value of settled transactions
(EUR billions, daily averages)

In 2018 T2S settled an average of €925.69 billion per day. Since the DKK migration, 98.69% of the T2S daily average value related to euro activity.
Seasonal effects are once again observed between August, which saw an average monthly value of €789.02 billion, and December, which recorded the highest monthly value of the year, with €1,002.65 billion. At daily level, the maximum traffic was settled in September (€1,302.64 billion) and the minimum in August (€679.34 billion). Combined with the information shown in Chart 3, the days of maximum and minimum traffic thus differ when considering the volume and the value settled.
Chart 8 depicts the monthly total traffic in value terms, broken down by NTS and RTS.
Chart 8
Comparison of night-time and real-time settlement value
(EUR billions, monthly totals)

In 2018 T2S settled transactions for an average monthly value of €19,670.90 billion, ranging between a minimum of €18,011.56 billion in February and a maximum of €22,080.23 billion in October.
As can be seen, the traffic settled during RTS accounted for 69.90% of the overall traffic on average, compared with 30.10% in NTS. However, as shown in Chart 4, in terms of value, the result was significantly more balanced between settlement in RTS and NTS (50.17% and 49.83%). The RTS phase was more value- than volume-intensive, being characterised by instructions with a higher average value than seen in the NTS phase. In contrast, the NTS phase was more volume- than value-intensive.
In absolute terms, the monthly value settled in NTS and RTS reached a peak in October 2018, with €6,672.64 billion and €15,407.59 billion respectively. In relative terms, the peak value settled during NTS was in July 2018 (30.95%), whereas the peak value settled during RTS was in May 2018 (71.25%).
70.13% of the daily average value of DVP transactions, which represented the majority of the overall T2S traffic, was settled during RTS.
Chart 9 illustrates the daily average value settled in T2S in 2018 by transaction type. Compared with Chart 5, which considers six transaction types for volumes, only four categories contribute to the T2S values: DVP, DWP, PFOD and LQT.
Chart 9
Value by transaction type
(EUR billions, daily averages)

Overall, the split of value by transaction type is consistent with previous years. Similarly to the results in volume terms depicted in Chart 5, in 2018 DVP represented the largest transaction type in value terms. Meanwhile, LQT were typically high-value, low-volume transactions.
DVP transactions represented on average the largest contributor to the T2S daily traffic with €659.40 billion (corresponding to 71.23% of the traffic), followed by LQT transactions with €246.50 billion (corresponding to 26.63%). PFOD and DWP transactions accounted for a minor portion (2.14%) of the daily average value settled.
The graph shows the daily average value of DVP transactions ranging between a minimum of €544.20 billion (August 2018) and a maximum of €728.23 billion (December 2018) and the daily average value of LQT transactions ranging between €231.40 billion (August 2018) and €262.12 billion (April 2018).
As observable, all transaction types tend to be subject to the seasonal patterns seen at aggregate level in Chart 7.
Chart 10 shows the daily average value settled per securities category.[7]
Chart 10
Value by securities category
(EUR billions, daily averages)

In 2018 debt instruments represented by far the most relevant securities category in value terms, with a daily average of €455.13 billion, followed by equities with €72.26 billion and entitlements (rights) with €0.63 billion.[8]
Compared with Chart 6, equities represented the first securities category in volume terms and the second in value terms, while debt instruments represented the first securities category in value and the third in volume terms. This suggests that, on average, transactions related to equities have a lower value compared with transactions related to debt instruments. Similarly to equities, entitlements (rights) contribute more to volumes than values.
1.3 Settlement efficiency
Settlement efficiency is a measure of the overall performance of the T2S platform. Two distinct indicators are used to properly monitor settlement efficiency by all parties involved.
- The first indicator is the platform settlement efficiency indicator (PSEI), which helps determine whether T2S is performing as expected, in terms of system configuration and performance of the optimisation algorithms. For this reason, all settlement activities are considered, including those generated by T2S. The indicator is particularly useful for the operator, as it gives an indication of the ability of the platform to process transactions.
- The second indicator is the market settlement efficiency indicator (MSEI), which is calculated similarly to the PSEI. However the MSEI excludes internally generated transactions and liquidity transfers from its calculation, and captures the inability to settle when a participant has put the instruction on hold.[9] This is a market-oriented indicator, as it is useful for determining whether business objectives are being met.
Charts 11 and 12 show the evolution of the two settlement efficiency indicators, at EoD and after NTS respectively, in 2018. While both indicators are required for a thorough understanding of the effectiveness of T2S, they have a distinct focus: platform or market efficiency business performance.
Chart 11
Platform Settlement Efficiency Indicator and Market Settlement Efficiency Indicator
(percentages, at end-of-day)

As illustrated in Chart 11, in 2018 the PSEI remained stable at EoD both in value and in volume terms, and, despite the slight decrease towards the end of the year, the levels remained above 96.17%.
In 2018 the MSEI stood on average at 92.97% in value and 93.53% in volume, and was approximately 4% lower than the PSEI.
Chart 12
Platform Settlement Efficiency Indicator and Market Settlement Efficiency Indicator
(percentages, after night-time settlement)

In 2018 the PSEI reached 85.89% in volume and 61.74% in value after NTS, while the MSEI reached 69.00% in volume and 42.92% in value.
Compared with the EoD, the two settlement efficiency indicators after NTS displayed a greater difference between value and volume. At the same time, they displayed more stability throughout the year. Moreover, the PSEI and the MSEI differed by 18.82% in value, while the PSEI and the MSEI differed by 16.88% in volume.
Box 1
Market Settlement Efficiency workshops
In 2018 the topic of settlement efficiency was identified as a priority for further analysis. Objectives were set on understanding factors underlying current settlement efficiency, and identifying possible ways to increase it. In order to conduct such an assessment, it was decided to organise a workshop on market settlement efficiency. The workshop took place in May 2018, and was attended by members of the CSDs, directly connected parties (DCPs) and representatives from the Eurosystem.
The discussion was continued and complemented with a more in-depth analysis at a second workshop in November 2018, with new calculations and simulations forming part of the assessment.
The workshops considered how the behaviour of T2S market users can affect the efficiency of settlement in T2S, and examined technical and functional aspects of T2S. The conclusions of the workshop included the following points:
- There are a significant number of aged instructions in T2S which affect settlement efficiency; it was agreed to further analyse the topic in 2019.
- Settlement Instructions entering T2S and matching after their intended settlement date are not taken into consideration by the PSEI and MSEI; a retroactive calculation of settlement efficiency for that intended settlement date would result in a lower ratio.
- A higher usage of partial settlement could improve settlement efficiency in T2S.
A third workshop will take place in June 2019 to follow up on the findings identified in the previous workshop and discuss the possibility of a common approach to facilitating settlement efficiency.
1.4 Unsettled transactions
At the end of each day, unsettled transactions remain in the system and T2S attempts to recycle them for settlement for a period of time known as the recycling period. In other words, the recycling period can be defined as the number of days during which a transaction remains unsettled.
Chart 13 illustrates the daily average volume of unsettled transactions in T2S in 2018. DVP, DWP, PFOD, FOP, SRSE and LQT transactions are included in the calculations.
Chart 13
Volume of unsettled transactions
(number of transactions, daily averages)

The daily average number of unsettled transactions ranged from 12,104 to 14,502 between January and September 2018. It then increased to 15,087 in October 2018 and exceeded 23,000 in both November and December 2018, as part of post migration activities in T2S. The lower values observed in July and August are due to seasonal effects.
The lowest number of unsettled transactions was recorded in August (12,104), which is the month with the least activity in T2S, while the largest number of unsettled transactions was, as mentioned above, registered in November (23,435).
DVP and FOP represented around 93% of all unsettled transactions in volume terms.
Chart 14 shows the daily average value of unsettled transactions in T2S in 2018. The transaction types contributing to the value are DVP, DWP, PFOD and LQT.
Chart 14
Value of unsettled transactions
(EUR billions, daily averages)

The daily average value of unsettled transactions in T2S ranged from €17.51 billion to €30.62 billion between January and November 2018 and peaked at €36.11 billion in December 2018. The lower values observed in July and August are due to seasonal effects.
Similarly to the volume, the lowest value of unsettled transactions was recorded in August (€17.51 billion), while the maximum value was registered in December (€36.11 billion).
DVP represented 94.26% of all unsettled transactions in value terms.
Chart 15 shows the share of transactions that remained unsettled for a certain number of recycling days out of the total unsettled volume on a monthly basis in 2018.
Chart 15
Average percentage of unsettled transactions per number of recycling days
(percentages, number of recycling days)
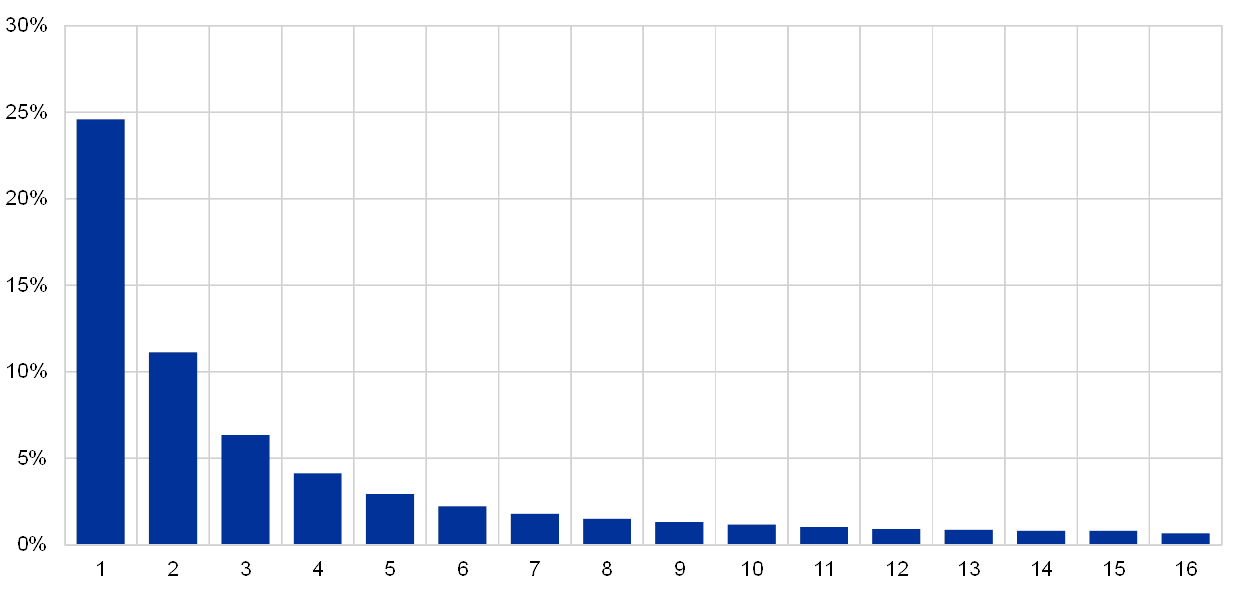
The graph shows that on average 24.58% of unsettled transactions were recycled for more than one day (first column) and less than half of those (or 11.13% altogether) remained pending after the second day. Only 0.67% recycled for 16 days (last column).
1.5 Use of auto-collateralisation
Auto-collateralisation in T2S is a credit operation that is triggered when a buyer does not have sufficient funds to settle a securities transaction, in order to improve its cash position. Auto-collateralisation is an automatic process which is aimed at facilitating smooth real-time DVP settlement in central bank money.
Two types of auto-collateralisation are available in T2S:
- Auto-collateralisation on-flow refers to the usage of the securities which are about to be purchased as collateral to obtain the necessary credit to complete the transaction.
- Auto-collateralisation on-stock is the use of other securities already held by the buyer as collateral to complete the transaction.
Chart 16 shows the daily average value of auto-collateralisation per month in 2018, broken down by type.
Chart 16
Value of auto-collateralisation
(EUR billions, daily averages)

In 2018 the overall use of auto-collateralisation reached a daily average value of €73.98 billion, ranging between €56.69 billion (August) and €96.86 billion (December).
Similarly to the traffic figures, the impact of seasonality can be observed in the use of auto-collateralisation. This holds true because, in general, the use of auto-collateralisation follows a similar pattern as that observed for the daily average value of DVP transactions settled throughout the year.
On average, 92.21% of the total value of auto-collateralisation was represented by auto-collateralisation on-stock (corresponding to €68.06 billion) and 7.79% by auto-collateralisation on-flow (corresponding to €5.75 billion). While the use of the former increased from September onwards, the use of the latter remained relatively stable in 2018.
Chart 17 shows the monthly total value of auto-collateralisation in 2018, broken down by RTS and NTS.
Chart 17
Comparison of real-time and night-time use of auto-collateralisation
(y-axis: left-hand scale: EUR billions, right-hand scale: percentages; monthly totals)

In 2018 the overall use of auto-collateralisation at monthly level ranged between €1,243.12 billion (February) and €2,111.99 billion (October).
On average, 75.71% of auto-collateralisation was used during RTS (corresponding to €1,187.40 billion) and 24.29% during NTS (€381.02 billion). The use of auto-collateralisation in RTS and NTS follows a similar pattern as that of the daily average value of transactions settled in T2S, as Chart 8 shows.
The value of auto-collateralisation use during RTS peaked in October 2018 (at €1,687.73 billion), while use during NTS peaked in November 2018 (at €435.60 billion).
In 2018 the use of auto-collateralisation represented on average 11.13% of the total monthly value of DVP transactions settled. As the chart shows, use of auto-collateralisation as a share of DVP reached its maximum in November (13.64%).
1.6 Intra- and cross-CSD settlement
In T2S there are multiple technical ways in which investors can access different markets linked to T2S. Depending on the number of CSDs involved, it is possible to distinguish between intra-CSD and cross-CSD traffic:
- Intra-CSD traffic refers to securities transfers where the delivering and the receiving parties belong to the same CSD;
- Cross-CSD traffic is when the delivering and receiving parties belong to different CSDs.
In T2S, intra-CSD transactions represent the vast majority of all settled transactions, in terms of both volume and value.
Chart 18
Volume and value of intra-CSD settlement
(percentages, daily averages)

As illustrated in Chart 18, in 2018 the daily average volume of intra-CSD transactions represented 99.33% of all volumes in T2S, while the daily average value of intra-CSD settlement represented 99.26% of all settlement values in T2S.
Respectively, only a very small percentage is attributable to cross-CSD traffic. Chart 19 shows the share of cross-CSD transactions compared with the total transactions settled in T2S, in daily average volume and value, in 2018.
Chart 19
Volume and value of cross-CSD settlement
(percentages, daily averages)

In 2018 the daily average volume of cross-CSD settlement transactions represented 0.67% of all settlement volumes in T2S, while the daily average value of cross-CSD settlement transactions represented 0.74% of all settlement values in T2S. The share of cross-CSD traffic increased as of April 2018, a change that resulted from an increase in cross-border business among some of the T2S CSDs, and reached a peak in July.
However, the low cross-CSD settlement figures must be taken with caution as they do not provide a comprehensive picture of cross-CSD activity in T2S. The lower than expected result is partially due to the fact that data for cross-border settlement activity through multiple CSD participation is not readily available in T2S; this mostly results in domestic transactions being aggregated with intra-CSD settlement statistics.
The low level of cross-CSD market activity in T2S triggered further analysis[10], and, in addition, the following underlying reasons were identified:
- A relatively short time has passed since the completion of T2S migration, and stakeholders’ primary focus is to consolidate their domestic business. As a result, strategic initiatives such as developing the use of CSD links, or refactoring the operating model for centralising activities for CSD participants, have often been slowed down or put on hold.
- Custodians currently use T2S to offer an enhanced service to their customers investing across borders. This increases competition, and decreases the demand for direct cross-CSD settlement.
- There are remaining barriers that hamper cross-border settlement integration and their resolution lies to a great extent outside the competency of T2S stakeholders: i.e. remaining gaps in compliance with corporate action (non-T2S) market standards and lack of harmonisation of withholding tax relief procedures.
1.7 Interaction between T2S and connected RTGS systems
At the start of each day, liquidity is sent from the real time gross settlement (RTGS) accounts to the dedicated cash accounts (DCAs) in T2S. During the day, liquidity can be transferred from the RTGS system to T2S and vice versa. At the end of the day all remaining liquidity is pushed back from DCAs in T2S to the RTGS accounts.
All T2S DCAs must have a zero balance at the end of the day. Via the EoD cash management process (referred to as EoD debits) any remaining position is transferred to the respective RTGS accounts.
1.7.1 Interaction between T2S and TARGET2
Charts 20 and 21 show the daily average volumes and values of liquidity transfers between the TARGET2 RTGS accounts and the T2S DCAs.[11]
Inbound liquidity transfers are transfers from the TARGET2 RTGS accounts to the T2S DCAs, while outbound liquidity transfers are transfers from the T2S DCAs to the TARGET2 RTGS accounts.
Chart 20
Volumes of liquidity transfers between TARGET2 RTGS accounts and T2S DCAs
(number of transactions, daily averages)

In 2018 the daily average volume of inbound liquidity transfers from TARGET2 was 581, while the daily average volume of outbound liquidity transfers to TARGET2 was 648.
Chart 21
Value of liquidity transfers between TARGET2 RTGS accounts and T2S DCAs
(EUR billions, daily averages)

In 2018 the daily average value of inbound liquidity transfers from TARGET2 was €117.38 billion and the daily average value of outbound liquidity transfers to TARGET2 was €121.23 billion.
At the end of the day, any existing difference between inbound and outbound liquidity, as shown in Chart 21, is balanced via the EoD cash management process.
1.7.2 Interaction between T2S and Kronos2
Charts 22 and 23 show the daily average volumes and values of liquidity transfers between the Kronos2[12] RTGS accounts and the T2S DCAs.[13]
Inbound liquidity transfers are transfers from the Kronos2 RTGS accounts to the T2S DCAs, while outbound liquidity transfers are transfers from the T2S DCAs to the Kronos2 RTGS accounts.
Chart 22
Volumes of liquidity transfers between Kronos2 accounts and T2S DCAs
(number of transactions, daily averages)

Since the migration of the Danish krone to T2S on 29 October 2018, the daily average volume of inbound liquidity transfers from Kronos2 was 48 transfers and the daily average volume of outbound liquidity transfers to Kronos2 was 69 transfers.
Chart 23
Value of liquidity transfers between Kronos2 accounts and T2S DCAs
(EUR billions, daily averages)

Starting from the point at which the Danish krone migrated to T2S on 29 October 2018, the daily average value of inbound liquidity transfers from Kronos2 was €2.36 billion and the daily average value of outbound liquidity transfers to Kronos2 was €2.62 billion.
Similarly to the interaction between TARGET2 RTGS accounts and T2S DCAs, any difference between inbound and outbound liquidity at the end of the day is balanced via the EoD cash management process.
2 T2S service level and availability data
2.1 Technical availability
The Eurosystem keeps a close eye on the good functioning and operation of the system. The availability of the services is measured continuously and objectively for predefined components of T2S, throughout each settlement day with the exclusion of the maintenance window.
One way to measure the punctuality of T2S is by calculating the actual duration of three defined phases of the business day and comparing these results against the expected target durations.
The following three phases of the business day are relevant for the calculation of the key performance indicator (KPI), with regard to their duration:
- SOD – measures the elapsed time between the Start of Day processing event until the End of Start of Day event;
- NTS including reporting – measures the elapsed time between the start of Night Time Settlement event until the end of NTS reporting;
- EOD – measures the elapsed time between the Start of the End of Day period event until the End of Day Reports event.
Table 2 summarises the actual average duration on a monthly basis of the different phases in a business day, in parallel to the respective target durations. The figures show that the platform operates within the target expectations. Namely, throughout 2018, for each month the actual average duration registered stayed below the target during the relevant phase of the business day.
Table 2
Punctuality
(actual average duration of the three phases on a monthly basis)

* Starting from November 2018 the target duration of the night-time settlement phase was set to 210 minutes, as defined in the updated Schedule 6 of the Framework Agreement.
2.2 Incidents in T2S
The European Central Bank (ECB) is dedicated to ensuring the smooth operation of the T2S system during normal operations, and to steering activities aimed at restoring the proper functioning of T2S services by mitigating the effects of incidents.
In 2018 the T2S platform experienced eight major incidents, defined as unplanned interruptions to or reductions in the quality of an agreed service, as a result of which a Crisis Managers' conference call was required. Each of the incidents was followed up with a detailed report, which would then serve as input for continuously improving the service and for reinforcing capabilities for coping with, mitigating or preventing threats in the future.
In 2017 the T2S platform registered an equal number of eight incidents.
Chart 24
T2S Service Level Indicator in 2018

As illustrated in Chart 24, throughout 2018 the T2S Service Level Indicator, computed as the weighted average of the platform services, was above the KPI – 99.70%. During the month of November, however, owing to a major incident, the Indicator was slightly below the target. Overall, the results demonstrate a consistently high availability of the platform.
3 T2S participation
With 2018 came the migration of the Danish krone (DKK) to T2S, as well as the connection of the Central Bank of Ireland (CBI) and the static data migration of ID2S. The migration or connection of all involved participants to T2S was successfully performed over the same weekend of 27 and 28 October 2018, with any impact on existing users of the platform being avoided. A further change was made to the list of connected participants given the exit of VP Lux from the T2S platform.
At present, 21 CSDs from 20 European countries, and by extension their local market communities, are connected to T2S.
3.1 Danish krone inclusion in T2S
T2S was designed as a multi-currency system and on business day 29 October 2018 the Danish krone successfully became the first non-euro currency to be made available for settlement in T2S. Danmarks Nationalbank connected their Kronos2 RTGS system to T2S and supplied liquidity to settle transactions versus payment in Danish kroner. VP Securities successfully migrated its Danish krone-denominated business on the same business date, having previously migrated its euro-denominated business in September 2016. Prior to the successful go-live of DKK in T2S, the Danish market had taken part in comprehensive migration dress rehearsals in the different T2S test environments.
In view of the go-live of DKK in T2S, on the basis of Danmarks Nationalbank’s signing of the T2S Currency Participation Agreement (T2S CPA), it was decided to operationalise the Non-euro Currencies Steering Group (NECSG) as part of the T2S governance structure. The NECSG supports the decision-making process in T2S by providing the Eurosystem, to the extent possible, with a common position of the connected national central banks (NCBs) on matters of relevance.
3.2 ID2S migration to T2S
ID2S, which has its operations in the French market, was the latest CSD to join T2S during the same weekend in October 2018. ID2S did not migrate any data from a previously existing legacy system, but rather started its securities settlement business directly in T2S after its successful go-live in T2S. This set-up process had been fully tested in cooperation with the Eurosystem in the different T2S test environments.
3.3 CBI connection
The Central Bank of Ireland benefited from two dress rehearsals before the successful go-live during the same migration weekend. Its connection to T2S allows the Irish community to obtain access to euro liquidity for their securities settlement business.
3.4 VP Lux closure
Owing to VP Securities’ decision to close down VP Lux, a plan was drawn up to allow VP Lux to transfer all its securities positions in T2S to VP Securities. This strategy was developed by VP Securities in cooperation with the Eurosystem. The related T2S processes were tested in the T2S test environments. VP Lux client holdings were successfully transferred in production to VP Securities in November 2018 ahead of the VP Lux closing process.
Box 2
Harmonisation in T2S
When the T2S project was launched in 2008 the European financial system was still highly fragmented. Critical components of the financial system, such as securities settlement systems, were bound by non-harmonised business, operational, technical, legal and regulatory national frameworks. Cross-border settlement was highly inefficient, complex and costly, which led to a less efficient allocation of resources across European securities markets.
The launch of the T2S project was accompanied by an important harmonisation agenda, based on the market participants’ commitment to harmonising and integrating ancillary post-trade processes that were usually conducted in accordance with diverging national rules and practices.
The three key objectives of T2S harmonisation are:
- fostering the creation of a single rulebook for post-trade processes in the T2S Community;
- protecting the “lean T2S” concept, i.e. excluding national specificities from the T2S operational blueprint;
- contributing to financial integration in Europe.
The achievements to date and the continuing work on harmonisation have successfully contributed to completely dismantling or reducing several Giovannini barriers[14] and have paved the way for further integration in the context of the capital markets union. The harmonisation agenda consists of 24 harmonisation activities – for 17 of these, harmonisation standards have been defined and are being monitored. Overall, today there is almost full compliance and harmonisation with core T2S standards (priority 1)[15] across the 20 T2S markets. Significant progress has also been made with other activities related to post-trade services (priority 2).
The milestones reached in T2S harmonisation are detailed in the T2S Harmonisation Progress Report.
4 T2S financial performance
4.1 Cost recovery objectives
The financial position of T2S is determined by trends regarding costs and revenues. The platform operates on a full cost recovery basis, meaning that all costs incurred should be covered by the revenues generated. The T2S pricing structure is defined in Schedule 7 of the T2S Framework Agreement and its cost recovery is driven by three factors:
- the transaction volumes that are settled in T2S;
- the fees that are charged to T2S users for using its services; and
- the predefined T2S cost recovery period.
Decision on increase in T2S price as of 01 January2019
In November 2010 the Governing Council decided to set the T2S delivery-versus ‑payment price at €0.15 per instruction. This price remained fixed at this level from the go-live of T2S in June 2015 until December 2018. The decision to reassess and adjust the price came into force in January 2019.
In 2018 the Governing Council agreed new baselines for T2S pricing with market representatives, in order to continue pursuing full cost recovery while maintaining the pricing structure unchanged in terms of the different weights for the tariff items. This consisted of:
- an increase of T2S delivery-versus-payment (DVP) price levels from €0.15 to €0.195, with an additional surcharge of €0.04 to reflect the current volumes situation (effective as of 1 January 2019); and
- an extension of the T2S cost recovery period from 8.75 to 14.5 years (i.e. until end‑2029)
Key considerations that fed into this decision included:
- the latest information on T2S operational costs, including the expected impact of: (a) the additional costs associated with enhancing the T2S platform’s resilience to cyber threats; and (b) the operational savings expected to be made from the ongoing TARGET2/T2S consolidation project, which is foreseen to be concluded in November 2021;
- the actual T2S traffic and revenues from the service’s first three years of operation (June 2015 to June 2018), which was also affected by the delayed migration of some of the largest T2S markets; and
- the latest update of the assumptions regarding the future evolution of T2S volumes.
The proposal, which was developed and elaborated by the Market Infrastructure Board (MIB)[16], also took account of the market’s advice and feedback, particularly on matters that refer to assumptions regarding future T2S volumes, given that these still come under the market’s responsibility.
The T2S DVP price increase is made up of the following elements:
- €0.012 related to cyber resilience enhancement costs;
- €0.008 related to loss of revenues due to delayed migration to the platform;
- €0.025 related to the new cost situation of T2S (including the costs of delayed migration and the anticipated operational savings from the TARGET2/T2S consolidation project); and
- a temporary surcharge of €0.04 due to the current volumes situation, which may be revisited in the event that T2S volumes grow faster than expected.
The accordingly updated Schedule 7 of the T2S Framework Agreement does not set specific conditions for future T2S pricing revisions. The Eurosystem might reopen this discussion with the market if T2S future volume levels are structurally above or below the new baseline.
4.2 Financial performance of T2S
The overall financial position of T2S is detailed in the annual T2S financial statements, which are prepared in accordance with specific accounting policies established by the MIB. In the interests of clarity, the financial information is presented in a similar manner to a profit and loss report (T2S operating statement) and a balance sheet report (T2S financial situation report).
The T2S operating statement shows yearly accumulated revenues (collected on a monthly basis) and yearly operational costs (paid on a quarterly basis using fees that have been collected and additional financing provided by the Eurosystem). The T2S financial situation report provides a snapshot of relevant items in the asset and liability accounts.
For more information on the T2S financial position, see the latest T2S financial statement for 2018.
4.3 Analysis of revenues collected in 2018
Chart 25 displays the relative split (i.e. in percentage terms) of T2S revenues between settlement services (SETT) and information services (INV). The SETT revenue derives from the core settlement services that are available continuously during the night-time and day-time settlement periods, except for a short period during the maintenance window.
Information services include services related to T2S information items, such as queries and reports. As part of this service, a CSD or an NCB may query any of its assigned accounts, but no others.
As shown in the Chart below, in 2018 approximately two-thirds (63.5%) of T2S revenues stemmed from settlement services, while approximately one-third (36.5%) of T2S revenues stemmed from information services. The settlement services portion of T2S revenues has been increasing over the years (with a concomitant reduction in the information services portion of T2S revenues), mainly owing to the gradual, delayed migration of some of the largest T2S markets. This trend is expected to increase over the upcoming years as a result of the increase of the delivery-versus-payment price, which became effective as of 1 January 2019.[17]
Chart 25
Split of T2S revenue between settlement and information services

5 T2S risk management and compliance
5.1 Risk management
Managing operational and information security risk is a key element of the governance structure of T2S.
The ECB Guideline on T2S (ECB/2013/13) constitutes the foundation of the governance of T2S, as it lays down the responsibilities of the Governing Council and Market Infrastructure Board (MIB) concerning T2S, including their risk management-related responsibilities. Thus, the Governing Council decides on the general operational aspects of T2S, and this includes the T2S risk management framework. The MIB’s responsibilities include, among others, 1) preparing proposals for decision (in full respect of the mandates of the ESCB committees[18]) as regards the T2S risk management framework and 2) implementing and managing the relevant risk management frameworks.
The T2S risk situation, including risk analysis and mitigation measures (if required), is shared on a regular basis with the CSDs and NCBs via the relevant fora: the Operations Managers Group (OMG), Project Managers Group (PMG), CSD Steering Group (CSG) and Information Security Sub-Group (ISSG). Within the context of their own risk management activities, and complying with their own national regulatory requirements, CSDs and NCBs flag new risks with the relevant T2S governance bodies if they consider such risks relevant.
Box 3
General Data Protection Regulation (GDPR)
The General Data Protection Regulation (GDPR) 2016/679 is a regulation in EU law on data protection and privacy for all individuals within the European Union and the European Economic Area. It became effective on 25 May 2018, having been approved by the European Parliament two years before. The GDPR defines strict rules on the handling and storing of personal data and categorises more data as personal data than before. The GDPR concept for personal data now includes any information that can facilitate the identification of a natural person. The regulation equivalent to the GDPR which applies to the Eurosystem is called the EUDPR. Only minor differences exist between the two regulations.
5.2 Oversight
The Eurosystem conducts the oversight of T2S as laid down in the Eurosystem oversight policy framework. The ECB has primary oversight responsibility for T2S and leads and coordinates all oversight activities. T2S oversight is conducted against a subset of the Principles for financial market infrastructures (PFMIs) set by the Committee on Payments and Market Infrastructures (CPMI) and the International Organization of Securities Commissions (IOSCO), which have been considered relevant for T2S by the Eurosystem. The PFMIs are the international standards for financial market infrastructures (FMIs), i.e. payment systems, CSDs, securities settlement systems, central counterparties and trade repositories. Although T2S does not fall within the definition of FMIs provided in the PFMI report, the Eurosystem decided to apply the PFMIs to T2S as these principles refer to functions performed by T2S, i.e. the settlement and recording of securities transactions.
In the course of 2018 the ECB oversight function launched the first comprehensive assessment of T2S since its go-live. The T2S comprehensive assessment process is based on the analysis of a self-assessment questionnaire completed by the operation function,[19] as well as the supporting documentation on T2S. The final assessment report (expected in the third quarter of 2019) will present the oversight function’s view on the extent to which T2S meets the PFMIs. The operation function will then be invited to address in a timely manner any recommendations that may be issued by the oversight function aimed at enhancing the safety and efficiency of T2S.
Regarding regular activities, in 2018 the operation function shared the information requested by the oversight function to support the conduct of oversight assessments of operational incidents and of the changes to the system implemented with T2S Release 2.0. Furthermore, in 2018 the operation function provided the oversight function with aggregated settlement statistics and information on operational performance, financial performance, and risk management, testing and migration activities, with a view to supporting the oversight function’s monitoring of T2S activities which are relevant from an oversight perspective.
With regard to cyber resilience, the oversight function published the Cyber resilience oversight expectations (CROE) for consultation in April 2018. Following the conclusion of the consultation, in which the MIB also provided comments, the final CROE was published at the end of the year. One of its key purposes is to provide FMIs with detailed steps for fostering improvements and enhancing their cyber resilience over a sustained period. The levels of expectation set out in the CROE provide the benchmark for overseers to determine FMIs’ cyber resilience capabilities. To this end, three levels of maturity were defined (i.e. “evolving”, “advancing” and “innovating”). T2S is expected to be at least at the “advancing” level of maturity and should define a strategy for reaching the “innovating” level, if it is not already at this level in the case of some expectations or categories. It is anticipated that a T2S assessment against the CROE will be conducted in 2020.
Box 4
T2S External Examiner
T2S External Examiner to begin T2S service and information security examinations by assessing the year 2018
T2S services are performed on a single technical platform integrated with central banks’ RTGS systems for all participating currencies. Under the T2S Framework Agreement the Eurosystem and the CSDs have agreed that the performance of T2S services is subject to technical and operational examinations performed by an External Examiner. These examinations provide an independent, third-party assessment to all participating CSDs based on the established industry norm ISAE 3402. The External Examiner has to be a well-reputed, internationally active accounting firm.
The objective of these examinations is to provide the CSDs with reasonable assurance that (a) the organisation set up by the Eurosystem meets the obligations established in the Framework Agreement and (b) the controls implemented by the Eurosystem are suitably designed, effective, and allow for efficient risk assessments to meet the security objectives.
As required by its statutes, the Eurosystem ran a public tender in 2018 and nominated an External Examiner. The examination of T2S services will begin with the assessment of the year 2018.
6 System evolution
New software is regularly released for T2S, so that the system can maintain its high standards and meet the expectations of new and existing users.
The three types of T2S releases are:
- A major release, consisting of a set of software changes that affect a significant part of the functionality or that add substantial new functionality. The release may also include the resolution of identified production problems.
- A minor release, encompassing a set of software changes to align with the regularly scheduled update of the ISO 20022 message standard, and, when feasible, to implement a limited number of change requests that do not affect a significant part of the functionality. The release may also include the resolution of identified production problems.
- A production problem resolution release, consisting of a set of software changes to resolve identified production problems.
6.1 Regular software update
T2S evolution reflects changes in business needs, regulatory factors and applicable market standards, along with some changes considered to be of a maintenance nature.
T2S Release 2.0
On 9 June 2018, the major T2S Release 2.0 went live, with deployment to production of 19 change requests (listed in the table below). These changes covered a wide range of functional areas, including in particular liquidity management, management of corporate actions and adjustments in preparation for the start of T2S operations in DKK and of the go-live of TIPS. With the minor release, Release 2.2, in November 2018, no changes were introduced to ensure the most favourable conditions for a smooth start to DKK settlement in T2S.
In addition to T2S Release 2.0, two production problem T2S releases, Release 1.3.2[20] and Release 2.1, were deployed to production in 2018. T2S Release 1.3.2 included 22 fixes for known production problems and was deployed to production in February 2018. T2S Release 2.1 included 26 fixes for known production problems and was deployed to production in September 2018. The numbers of change requests and production problems in 2018 are shown in Table 3.
Table 3
T2S Releases in 2018

Change requests of T2S Release 2.0

Future system evolution (2019)
Release of T2S 3.0 and T2S 3.2
In 2019 changes to T2S will be delivered in two releases, Release 3.0 in June 2019 and Release 3.2 in November 2019. The changes planned for 2019 include in particular the alignment of T2S Messages with ISO Maintenance Releases 2013‑2017, several regulation-driven changes (CSD Regulation) and the introduction of a new functionality, Partial Release, which aims to improve the settlement efficiency of T2S and minimise the impact of the CSDR penalties. In addition, cash and securities reporting will be enhanced to include new fields which are useful, for instance, for processing corporate actions and reconciliation purposes.
In addition to the major and minor releases in 2019, two production problem T2S releases, Release 2.3 and Release 3.1 will have been deployed to production by the end of the year. T2S Release 2.3 was deployed in February 2019 and included 24 fixes for known production problems. T2S Release 3.1 will be deployed in September 2019 – currently 12 fixes for known production problems are allocated to it, although it is acknowledged that changes to the scope might be proposed in the future. The numbers of change requests and production problems in 2019 are shown in Table 4.
Table 4
T2S Releases in 2019*

* Acknowledging that changes to the scope might be still possible
Looking ahead to the following year, in November 2020 a new module part of Release 4.2 will allow T2S to support participating CSDs by calculating the cash penalties applicable in terms of the CSD Regulation.
For further information, a full list of T2S change requests can be found on the ECB’s website, as well as detailed contents per release:
List of change requests Project Managers Group – Scope of T2S ReleasesBox 5
CSD Regulation (CSDR)
T2S penalty mechanism – the Eurosystem will provide a major set of new functionalities to help T2S CSDs comply with the CSDR settlement discipline regime
The main objective of the CSDR is to increase the safety and efficiency of securities settlement and settlement infrastructures (CSDs) in the European Union. In order to foster settlement efficiency, the CSDR has established a settlement discipline regime, which, at the settlement layer, provides for the payment of cash penalties for late settlement of transactions.
In response to this, it was decided at T2S Steering level that the Eurosystem would offer a settlement penalty calculation mechanism. Work on developing the T2S penalty calculation mechanism, which spanned the past two-and-a-half years, was based on the analysis and interpretation of the CSDR draft regulatory texts, and was carried out in close collaboration with regulators, who validated the working assumptions used by the CSDR Task Force to define the requirements.
The T2S penalty mechanism is considered to be one of the largest change requests to date[21]; it offers identification of settlement fails, calculation and reporting of cash penalties to T2S CSDs, as well as the operational tools deemed necessary in this context.
The T2S penalty mechanism has been approved at the T2S Steering level for implementation in November 2020, and represents a key contribution by the Eurosystem to supporting the CSDR’s objective of increased settlement efficiency in Europe.
6.2 Consolidation of TARGET2 and T2S
On 6 December 2017 the Governing Council of the ECB approved the start of the implementation phase of a new project to consolidate, enhance and optimise the market infrastructure services offered by the Eurosystem, i.e. T2‑T2S Consolidation.
The aim of the T2‑T2S Consolidation project is to consolidate and optimise the provision of the TARGET2 and T2S services and to address the increasing demand for an effective facility for the provision of liquidity to existing and future Eurosystem payment and settlement services. The objective is to meet changing market demands by replacing TARGET2 with an RTGS system and optimising liquidity management across all TARGET services. The new consolidated platform will be launched in November 2021. For this purpose, the T2‑T2S Consolidation project assessed four different work streams during the investigation phase:
- Technical consolidation of Eurosystem market infrastructures, which will form the basis of their modernisation. A key objective is compliance with the latest cyber resilience directives, thus ensuring protection against cyber-attacks.
- A consolidated and harmonised connectivity solution, creating a single gateway for Eurosystem market infrastructures based on the consolidation of connectivity and security components.
- Functional convergence into a single platform, which will allow the sharing of common components. It is important to highlight that T2 and T2S will remain separate services.
- New RTGS services, supporting new potential features as well as opportunities to adapt, streamline and improve the existing services to the changing needs of the payment business.
The beginning of 2018 marked the start of the implementation phase. In this connection, the Eurosystem has published the following documents:
- the Business Description Document – introduces the functions and features of the future Eurosystem market infrastructures for real-time interbank and customer payments, and introduces the functions and features of central liquidity management, covering the spectrum from credit institutions and ancillary systems to end-users;
- the User Detailed Functional Specification – presents the detailed information that users need to adapt their internal systems, broken down into functional and technical specifications.
Readers can find more detailed information in the user requirements documents, which have benefited from more than 2,800 comments from over 50 institutions, submitted during a market consultation which ran from 10 May to 30 June 2017.
T2‑T2S Consolidation User Requirements Document (URD) v1.1.1 – Central Liquidity Management (CLM) T2‑T2S Consolidation User Requirements Document (URD) v1.1.1 – future RTGS systems T2‑T2S Consolidation User Requirements Document (URD) v1.1.1 – shared services T2‑T2S Consolidation User Requirements Document (URD) v1.1.1 – glossary6.3 Eurosystem Collateral Management System (ECMS)
In parallel with the consolidation of TARGET2 and T2S, the Eurosystem is developing the Eurosystem Collateral Management System (ECMS). The ECMS will be a single collateral management system used to manage eligible assets mobilised as collateral in Eurosystem monetary policy operations. Together with the T2‑T2S Consolidation project, the ECMS will contribute to the effective exchange of securities, collateral and liquidity within the Eurosystem.
The ECMS will offer a set of advanced and harmonised services, and thus ensure a level playing field for all counterparties. It will be accessible via a single and common interface across jurisdictions and will facilitate the mobilisation of cross-border collateral. For banking groups that access Eurosystem credit operations through more than one NCB, the ECMS should ease the management of collateral across the group.
To effectively manage the collateral, the ECMS will interact with T2S for auto-collateralisation and mobilisation/demobilisation of collateral. These functionalities are currently being specified, while the testing activities will take place in the upcoming project phases.
In 2018 – the initial year of the realisation phase – the Eurosystem specified the system, leveraging the harmonisation proposals agreed on by the Eurosystem and AMI‑SeCo that were relevant to the Eurosystem’s collateral management activities. Once the ECMS has gone live, planned for November 2022, the NCBs will replace their current collateral management systems with the ECMS. The ECMS will become a single interface for communication (available U2A and A2A) for all market participants (CSDs, TPAs, counterparties) and will rely on ISO 20022 as the messaging standard.
© European Central Bank, 2019
Postal address 60640 Frankfurt am Main, Germany
Telephone +49 69 1344 0
Website www.ecb.europa.eu
All rights reserved. Reproduction for educational and non-commercial purposes is permitted provided that the source is acknowledged.
For specific terminology please refer to the ECB glossary (available in English only).
HTML ISBN 978-92-899-3852-5, ISSN 2599-9257, doi:10.2866/591, QB-CH-19-001-EN-Q
- For the purposes of this report, the figures related to Danish krone and euro volumes are aggregated and all the amounts settled in Danish kroner are converted into euros at an exchange rate of €0.13 to kr.1 to present aggregate values. All the charts and figures provided in the report take into consideration the fact that in December 2018 the Danish market was closed on two T2S opening days, namely on 24 and 31 December 2018.
- While the PSEI indicates the ability of the platform to process transactions, the MSEI provides a market-oriented measure of settlement efficiency. It excludes internally generated transactions and liquidity transfers and includes Party-on-Hold transactions estimated by a proxy of the On-Hold transactions (see Section 1.3). An enhanced version of the indicator will be introduced as part of the functionalities of T2S Release 3.0.
- The calculation of volumes takes into account settlement transactions, settlement restrictions, liquidity transfers and internally generated transactions. Excluding the last three categories, the volume would be equal to the overall figures produced in the T2S Service Level Reports (128,619,449 transactions).
- The chart focuses on the three largest contributors in terms of daily average volume, namely equities, entitlements (rights) and debt instruments.
- The remaining 13% is attributable to the other securities categories.
- The T2S Annual Report does not include FOP in the calculation of the value of settlements.
- The chart focuses on the three largest contributors in terms of daily average volume, namely equities, entitlements (rights) and debt instruments.
- Owing to the lower values of the entitlements (rights) category compared with the other two categories, the figure is not visible in Chart 10.
- For a definition of the MSEI see Section 1, Evolution of T2S settlement data.
- See the AMI‑SeCo report of November 2017 on cross-CSD market activity in T2S.
- EoD debits represent the push of liquidity from T2S back to TARGET2 and are not included in the calculation to avoid double-counting.
- The traffic in Danish kroner is converted into euro at an exchange rate of €0.13 to kr. 1.
- EoD debits are not included.
- See the first Giovannini Group report.
- Priority 1 activities are necessary to ensure efficient and safe cross-CSD settlement in T2S. The T2S Community should view the resolution and implementation of these activities as a matter of top priority before the markets’ migration to T2S.
- The Market Infrastructure Board (MIB) is a streamlined management body in charge of Eurosystem initiatives in the field of market infrastructure.
- See Section 4.1 for more information on the T2S price increase.
- Market Infrastructure Board mandate.
- The four central banks (the Deutsche Bundesbank, the Banca d’Italia, the Banco de España and the Banque de France) operating T2S and the ECB.
- T2S Release 1.3.2 was planned before the decision to have four releases per year. For this reason, the numbering is not in line with the current releases.
- Change Request 654.