
PRESS RELEASE
7 April 2016 - Euro area quarterly balance of payments and international investment position (fourth quarter of 2015)
- The current account of the euro area showed a surplus of €329.5 billion (3.2% of euro area GDP) in 2015.[1]
- At the end of 2015 the international investment position of the euro area recorded net liabilities of €0.4 trillion (approximately 4% of euro area GDP).
- For the first time, this press release includes a full reconciliation of the changes in the international investment position broken down into transactions, revaluations (price and exchange rate changes) and other volume changes.

Current account
The current account of the euro area showed a surplus of €107.8 billion in the last quarter of 2015, compared with €96.5 billion in the same quarter of 2014 (see Table 1). The increase in the current account surplus was due to an increase in the surplus for goods (from €79.1 billion to €90.8 billion) and a decrease in the deficit for secondary income (from €32.4 billion to €30.2 billion), which were partly offset by a decrease in the surpluses for services (from €15.6 billion to €14.5 billion) and primary income (from €34.1 billion to €32.8 billion).[2]
The decrease in the surplus for services resulted mainly from a deterioration in the balances for the transport (from a surplus of €1.2 billion to a deficit of €0.3 billion), other business services (an increase in the deficit from €0.2 billion to €1.1 billion) and other services (an increase in the deficit from €5.1 billion to €6.3 billion) components. This was partly offset by an improvement in the balance for the telecommunication, computer and information services component (an increase in the surplus from €14.3 billion to €16.7 billion).
In 2015 the current account of the euro area showed a surplus of €329.5 billion (3.2% of euro area GDP), compared with one of €251.3 billion (2.5% of euro area GDP) in 2014. The rise resulted from increases in the surpluses for goods (from €247.6 billion to €321.6 billion) and primary income (from €69.8 billion to €74.8 billion), and a decrease in the deficit for secondary income (from €141.6 billion to €133.2 billion). These developments were partly offset by a decrease in the surplus for services (from €75.6 billion to €66.4 billion).
The geographical breakdown
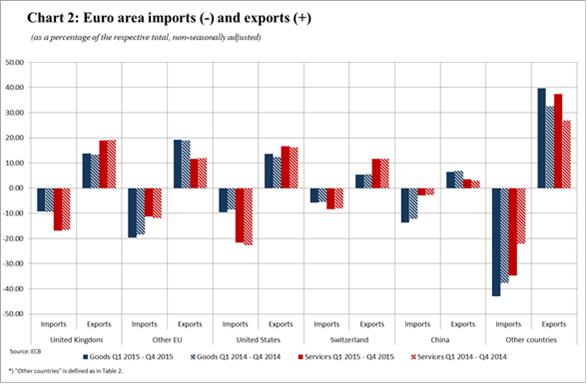
The increase in the surplus in the euro area goods account in 2015 resulted primarily from improvements in the surpluses vis-à-vis the United Kingdom (increased from €99.3 billion to €122.7 billion) and the United States (increased from €94.8 billion to €115.5 billion), and in the change from a deficit (of €8.7 billion) to a surplus (of €43.4 billion) vis-à-vis “other countries” (including most oil producers) (See Table 2). This was partly offset by an increase in the trade in goods deficit vis-à-vis China (from €73.3 billion to €104.3 billion). The decrease in the surplus for services resulted mainly from an increase in the deficit vis-à-vis “offshore financial centres” (from €25.6 billion to €41.2 billion).
In 2015 non-euro area EU Member States (excluding the United Kingdom) remained the euro area’s main partners for trade in goods – accounting for approximately 19% of all euro area imports and exports – followed by the United Kingdom for exports and China for imports (see Chart 2). As regards euro area trade in services, the United Kingdom was the largest recipient of exports (accounting for 19% of the total) and the United States the largest provider, accounting for more than 22% of total euro area imports of services.
International investment position
At the end of 2015 the international investment position of the euro area recorded net liabilities of €0.4 trillion vis-à-vis the rest of the world (approximately 4% of euro area GDP; see Chart 1). This represented a decrease of around €190 billion compared with the net position in the third quarter of 2015 (see Table 3).
The decrease resulted mainly from a higher net asset position for direct investment (€2,174 billion, up from €2,119 billion) and a lower net liability position for portfolio investment (€2,988 billion, down from €3,144 billion). These movements were only partly offset by higher net liability positions for other investment (€206 billion, up from €194 billion) and financial derivatives (€43 billion, up from €34 billion).
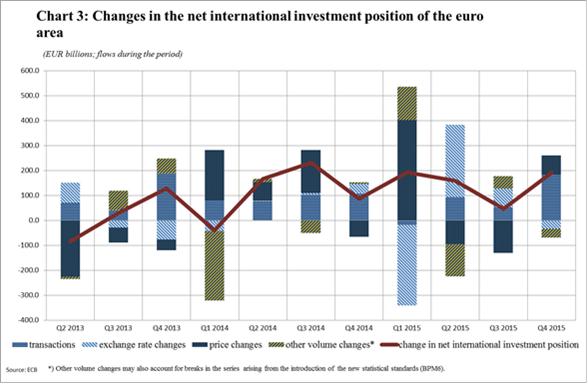
The change in the net international investment position of the euro area in the last quarter of 2015 can broadly be attributed to transactions, particularly due to disinvestments in the euro area (see Chart 3). Large positive revaluations – changes in exchange rates and asset prices – on both sides of the balance sheet partly offset each other. The increases in direct investment assets and liabilities and portfolio investment assets were equally explained by transactions and revaluations, while the increase in portfolio investment liabilities was solely attributable to revaluations, which were partly offset by disinvestments of non-euro area residents in (debt and equity) securities issued by euro area residents. The decreases in other investment assets and liabilities were mainly attributable to transactions.
At the end of 2015 the gross external debt of the euro area amounted to €12.5 trillion (approximately 120% of euro area GDP), which represents a decrease of €162 billion compared with the previous quarter. This resulted mainly from transactions and was partly offset by revaluations. The net external debt also decreased (by approximately €246 billion) from the third quarter of 2015 to the end of 2015.
The geographical breakdown
At the end of 2015 the stock of euro area direct investment abroad (assets) was €9.7 trillion, 28% of which was invested in the United States and 20% in the United Kingdom (see Table 4). The stock of foreign direct investment in the euro area (liabilities) was €7.5 trillion, with 31% coming from residents in the United States and 20% from offshore financial centres.
As regards portfolio investment, euro area holdings of foreign securities amounted to €7.2 trillion at the end of 2015, largely reflecting holdings of securities issued by residents in the United States (which accounted for 35% of the total), as well as by residents in the United Kingdom (16%).
As regards other investment, euro area residents’ holdings of foreign assets amounted to €4.6 trillion at the end of 2015, with 34% vis-à-vis residents in the United Kingdom and 18% vis-à-vis residents in the United States. Euro area other investment liabilities reached €4.8 trillion, with residents in the United Kingdom accounting for 34% of the total and residents in the United States for 14%.
Data revisions
- This press release incorporates revisions to the data for the reference periods from the first quarter of 2008 to the third quarter of 2015. These revisions reflect improvements in the national contributions to the euro area aggregates. They had a significant impact on the financial account and the international investment position, particularly for direct investment.
Additional information
- Time series data: ECB’s Statistical Data Warehouse (SDW).
- Methodological information: ECB’s website.
- Next press releases:
- Monthly balance of payments: 19 April 2016 (reference data up to February 2016).
- Quarterly balance of payments and international investment position: 8 July 2016 (reference data up to the first quarter of 2016)
Annexes
- Table 1: Current account of the euro area
- Table 2: Current and capital account of the euro area – geographical breakdown
- Table 3: International investment position of the euro area
- Table 4: International investment position of the euro area – geographical breakdown
For media queries, please contact Rocío González, Tel.: +49 69 1344 6451.
[1]All data are neither seasonally nor working day-adjusted. Ratios to GDP (including in the charts) refer to four-quarter sums of non-seasonally and non-working day-adjusted GDP figures.
[2]In broad terms, the new BPM6 concept of “primary income” corresponds to the old BPM5 concept of “income”, and the new concept of “secondary income” corresponds to the old concept of “current transfers”.
European Central Bank
Directorate General Communications
- Sonnemannstrasse 20
- 60314 Frankfurt am Main, Germany
- +49 69 1344 7455
- media@ecb.europa.eu
Reproduction is permitted provided that the source is acknowledged.
Media contacts