
Statistics on payments – Data for 2009
The European Central Bank (ECB) has today published the 2009 statistics on payments, which comprise indicators on access to and use of payment instruments and terminals by the public, as well as volumes and values of transactions processed through payment systems [1]. Statistics [2] have been published for each EU Member State, in addition to EU and euro area aggregates, and comparative statistics.
The main findings of the 2009 statistics on payments are the following:
- The total number of non-cash payments in the EU, using all types of instruments, increased by over 4% to 82 billion in 2009 compared with the previous year. Card payments accounted for nearly 40% of all transactions, while credit transfers and direct debits accounted in equal shares for most of the remainder (over 26% each).
- The corresponding total value of non-cash payments in the EU decreased by almost 16% to €227 trillion, resulting in a further decline – of almost 20% – in the average value per transaction, to €2,771. Credit transfers accounted for almost 90% of the total value, while the remainder was generated primarily by direct debits (7%) and cheques (slightly below 3%).
- The total number of payment cards [3] in the EU was stable compared with 2008, at just under 726 million. This represented around 1.45 payment cards per EU citizen.
- The number of automated teller machines (ATMs) available to the public increased by 2% to over 430,000 in 2009 compared with the previous year. This means that by the end of 2009 there were about 870 ATMs per million inhabitants in the EU.
Further analysis of payment statistics: instruments and retail payment systems
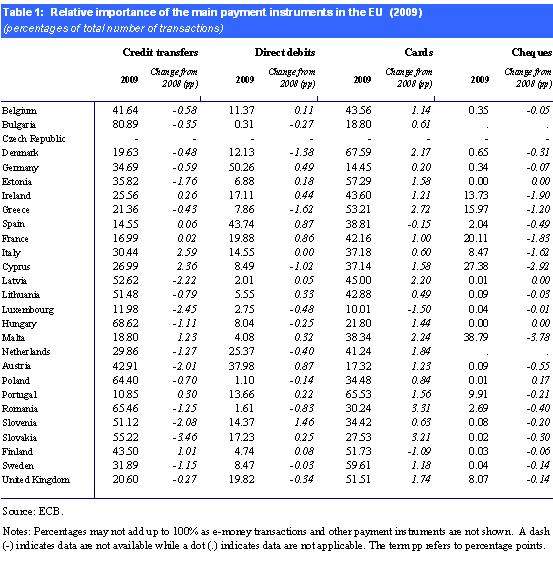
As shown in Table 1, the relative importance of each of the main payment instruments in 2009 varied across countries. The largest differences were observed in credit transfers, where usage ranged from 10.9% in Portugal to 80.9% in Bulgaria. In addition, a tendency towards a decrease in the use of cheques in almost all countries is even clearer in 2009.
Selected payment trends in the EU over the ten years from 2000 to 2009, the period for which harmonised statistics are available, are presented in Chart 1.
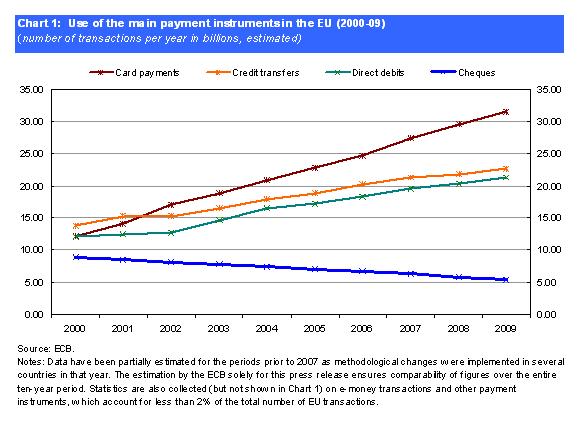
The number of transactions carried out with all payment instruments [4] grew by 4.3% from 2008 to 2009, thus continuing the upward trend but at a slower pace than the average increase of 6.5% per year between 2000 and 2008. This pattern was also observed for card payments, credit transfers and direct debits, the respective annual growth rates of which in 2009 were 6.8%, 3.6% and 5.0%. The average growth rates for these instruments between 2000 and 2008 were somewhat higher, at 11.6%, 5.9% and 6.8%. The number of cheque transactions fell by over 7.5% in 2009. Although continuing the long-term decline in the use of this instrument, the number shows a faster decrease than in previous years, for which the average rate was 5.2% per year.
Retail payment systems
Retail payment systems in the EU handle mainly payments that are made by the public, with a relatively low value and urgency, using credit transfers, direct debits and cheques.
In 2009 there were 44 retail payment systems [5] in the EU as a whole, serving a total population of about 500 million. During that year, these systems processed around 38 billion transactions, with a total value of €26.4 trillion. 22 of these systems were located in the euro area and served a total population of 329 million. The euro area systems processed 26.9 billion transactions in 2009 (i.e. 71% of the EU total) with a value amounting to €16.4 trillion (i.e. 62% of the EU total).
There was a notable degree of concentration of the transactions processed in the retail payment systems of the EU in 2009. Among retail payment systems processing in euro, SIT/CORE (France) accounted for almost half (47%) of all transactions (27.3 billion). Similarly, among retail payment systems in the EU processing in other currencies, Bacs (United Kingdom) processed more than half (52%) of all transactions (10.8 billion). However, in terms of the value of transactions processed, the degree of concentration was much smaller.
Additional information
The full set of payment statistics can be downloaded from the Statistical Data Warehouse (SDW) on the ECB’s website at http://sdw.ecb.europa.eu. The “Reports” section of the SDW also contains pre-formatted tables with payment statistics for the last five years. The data are presented in the same format as in the former “Blue Book Addendum”, which is available in the “Statistics” section of the ECB’s website (http://www.ecb.europa.eu).
For detailed methodological information, including a list of all data definitions, refer to the “Statistics” section of the ECB’s website.
-
[1]Retail and large-value payment systems.
-
[2] For associated statistics on securities trading, clearing and settlement, please refer to the press release dated 29 July 2010 on the ECB’s website.
-
[3]Payment cards include all cards with a payment function: credit cards, debit cards and delayed debit cards.
-
[4]Excluding cash transactions.
-
[5]Including the three pan-European STEP2 retail systems of the EBA Clearing Company. A list of all (retail and large-value) payment systems covered by these payment statistics is given in the Statistical Data Warehouse on the ECB’s website.
European Central Bank
Directorate General Communications
- Sonnemannstrasse 20
- 60314 Frankfurt am Main, Germany
- +49 69 1344 7455
- media@ecb.europa.eu
Reproduction is permitted provided that the source is acknowledged.
Media contacts