


Published as part of the ECB Economic Bulletin, Issue 2/2024.
Households have faced several shocks over the last few years and have adjusted their behaviour through different margins. The episode of high inflation over the past couple of years was triggered by a combination of factors, including supply bottlenecks caused by the pandemic and the surge in energy prices following Russia’s invasion of Ukraine. The inflationary shock affected consumers’ behaviour and weighed on their spending. In general, consumers employ different strategies to cope with higher prices – by adjusting their consumption, reducing their savings and/or increasing their income. This box uses evidence from the ECB’s Consumer Expectations Survey (CES) to investigate how households have reacted to the recent inflationary episode through these margins of adjustment.
Evidence from the CES indicates that the primary strategy used by consumers to cope with inflation is to adjust their consumption (Chart A).[1] CES participants were asked which actions they had taken in the past 12 months to cope with inflation. Apart from reducing their consumption, these included borrowing, tapping into their savings, working more hours, taking on an additional job or asking for a pay rise. In January 2024 most CES respondents (69%) had modified their consumption, but adjustments made through the saving/credit (43%) and income (31%) channels were also noteworthy.[2] The predominant response to elevated prices was to shop around (50%), followed by trading down to lower quality product varieties (33%) and reducing the quantities purchased (28%).[3] 35% of respondents reported having reduced their savings to support consumption while, in terms of income, around 15% reported having negotiated a pay rise and 17% reported working more hours or taking on an additional job. Households facing budget constraints – defined as those with a high share of spending on necessities relative to their income – were more likely to adjust their shopping and saving patterns compared with households with unconstrained budgets (Chart A).[4] The percentages were similar across the two groups for income adjustment measures.[5] The consumers’ responses showed increases across all margins compared with the last time the question was asked (August 2023). Consumption options showed the largest increase (9 percentage points) followed by saving (7 percentage points) and income strategies (7 percentage points).
Chart A
Consumers’ responses across all margins in the CES
Responses in January 2024 (for the previous 12 months)
(percentages)
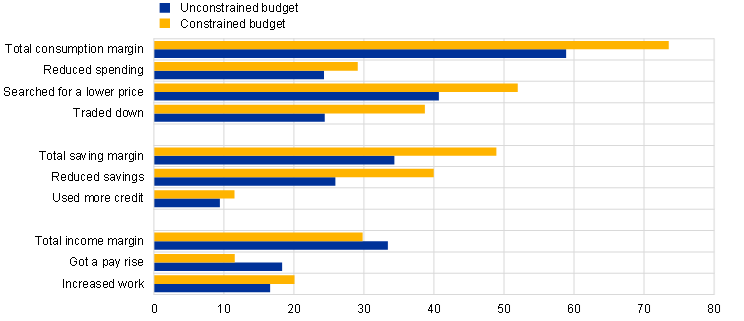
Sources: CES and ECB calculations.
Notes: The question in the CES reads as follows: “Please think about your expectations for changes in prices in general over the past 12 months. Which of the following actions, if any, have you taken, over the past 12 months because of these price changes? Please select all options that apply. 1. Brought forward major purchases of durable goods. 2. Reduced usual spending and put aside more money. 3. Shopped around more actively to find the best price for the same exact product or service. 4. Substituted goods and services with cheaper alternatives. 5. Saved less than usual or liquidated (some or all) savings to finance spending. 6 Used more credit than usual to finance spending (e.g. increased balance on credit cards or other consumer loans). 7. Got a pay rise from your current employer or found a higher paying job. 8. Increased your income in other ways (e.g. took on a second job, worked more hours with current employer). 9. None of the above.”
The composition of the household expenditure basket showed bigger adjustments for categories that had experienced a larger relative price change. Chart B, panel a) shows the composition of the consumption basket for 2023 compared with 2021. Categories with larger relative price increases have seen more significant adjustments in their share of total spending over the past two years. This is in line with the literature indicating that households substitute away from products that are becoming relatively more expensive.[6] Notably, the consumption of items such as food and equipment has experienced a substantial downward adjustment in response to the larger price increases. This quantitative evidence is in line with the qualitative responses in Chart A. Nevertheless, additional shocks have also affected the consumption behaviour of households. The sustained expansion of leisure services, such as restaurants, and recreation and travel (Chart B, panel b), was driven by a shift in preferences following the lifting of social restrictions in the aftermath of the pandemic. This led the share of these categories in total spending to increase from 7.4% in 2021 to 12.9% in 2023. Additionally, the share of transport (including vehicle purchases) started to decrease at the beginning of 2022, as a result of supply constraints on semiconductors, but rebounded to some extent in 2023.
Chart B
Consumption basket adjustment and decomposition of consumption by spending category
a) Relative changes in spending (2023 vs 2021)
(share of total spending, percentages)

b) Nominal consumption
(annual percentage changes and percentage point contributions)
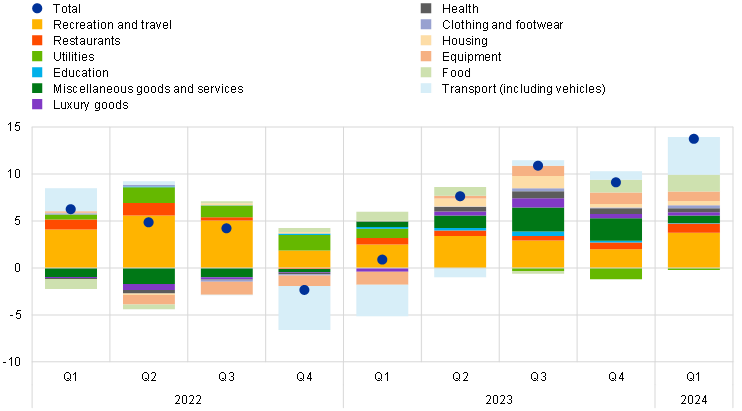
Sources: CES and ECB calculations.
Notes: Panel a) shows the relative changes in spending for each spending category (transport, food, equipment, housing, clothing and footwear, health, luxury goods, miscellaneous goods and services, education, utilities, restaurants, and recreation and travel) for 2023. The sample comprises the EA-11 countries: Belgium, Germany, Ireland, Spain, France, Italy, Luxembourg, Netherlands, Austria, Portugal and Finland. In panel b), the decomposition is based on nominal values with the annual growth rates rescaled based on the share of each item in total nominal consumption spending. The latest observations are for 2023 in panel a) and for the first quarter of 2024 in panel b).
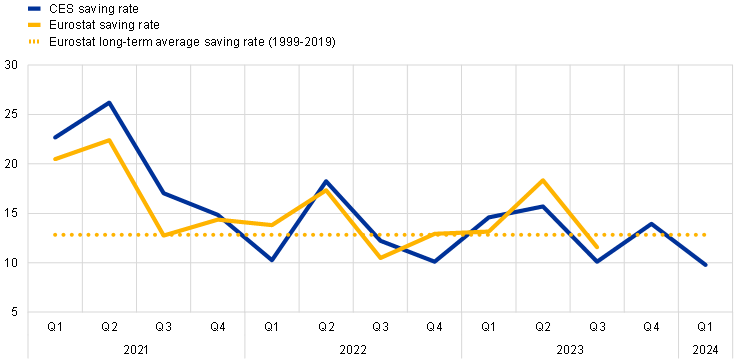
Turning to the saving margin, evidence indicates a drop in the saving rate in the past two years. By combining the information contained in the CES on consumption and income, household-level saving rates and quarterly aggregates can both be computed in a timely manner. The movements in the aggregate saving rate (as a share of net income) of the CES closely mirror those observed in the (non-seasonally adjusted) aggregate saving rate of the Eurostat quarterly sector accounts (QSA) (Chart C, panel a). In 2022 and 2023 there is a decline in the CES saving rate which is slightly more pronounced than the decline shown by the QSA indicator. Nevertheless, the Eurostat saving rate moved closer to its long-term average in the third quarter of 2023.
A decomposition of the saving rate shows that the drop was mainly driven by increased spending on recreation and travel, rather than on necessities. CES microdata allow a detailed breakdown to be made of the change in the saving rate over the last two years, considering income and consumption categories across different income groups. The recent drop in the saving rate can largely be attributed to an increased preference among households for spending on recreation and travel following the pandemic, driven predominantly by households in higher-income groups (Chart C, panel b). Increased spending on durable goods, driven largely by lower-income households, following the normalisation of production bottlenecks, also contributed to the drop in the saving rate in 2023, albeit to a lesser extent. By contrast, spending on essential items, including housing, food and energy, had a relatively modest downward impact on households’ savings in 2022 and 2023, despite the substantial price increases. This outcome reflects a reduction in both the quantity and quality of purchases of these necessities, in line with the changes in households’ spending behaviour.
Chart C
Euro area saving rate
a) Household saving rate
(percentage of income)
b) Decomposition of the saving rate by income quintile and type of consumption in the CES (2023 vs 2022)
(percentage point change)
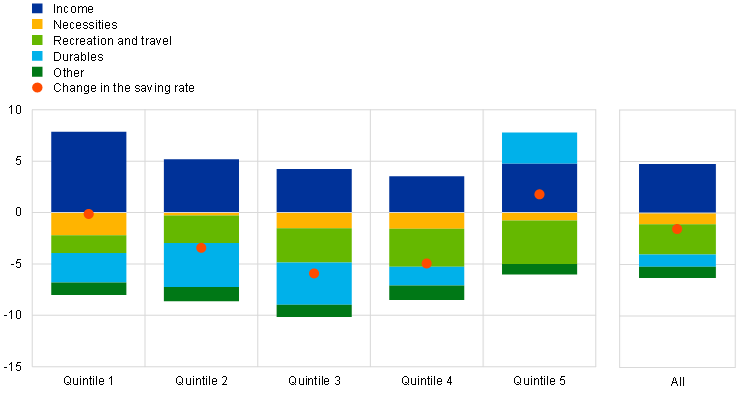
Sources: CES, Eurostat and ECB calculations.
Notes: In panel a), the CES saving rate is defined as the ratio of savings to household net income; savings are computed as household net income minus consumption. The Eurostat saving rate is computed as the ratio of gross savings to households’ gross disposable income. The dotted line refers to the long-term average over 1999-2019. All series are non-seasonally adjusted. In panel b), the chart shows the decomposition of the saving rate by income quintile in 2023 on the left and the decomposition of the aggregate saving rate for 2023 on the right. For CES data, the sample comprises the EA-11 countries: Belgium, Germany, Ireland, Spain, France, Italy, Luxembourg, Netherlands, Austria, Portugal and Finland. The latest observations are for the first quarter of 2024 for the CES and for the third quarter of 2023 for the Eurostat QSA in panel a), and for 2023 in panel b).
With regard to the income margin, more than half of the respondents reported nominal income increases lower than inflation in 2023. Qualitative evidence from the CES indicates that most consumers (54%) reported their income rising slower than inflation, while 21% said that their income had risen faster than inflation and 25% reported that their income had fallen.[7] Based on the quantitative evidence from the decomposition of the saving rate, the increased contribution of income in 2023 largely counterbalances the increase in spending (Chart C, panel b). Nevertheless, adjustments to income are usually last to occur, as they are under the direct control of households to a lesser extent. With regard to distributional aspects, the largest income gains were reported by consumers in the lower-income quintiles, in line with increases in the minimum wage in euro area countries over the past two years.[8]
It is well documented that consumers adjust their consumption behaviour in response to large shocks. See, for example, the boxes entitled “Consumption patterns and inflation measurement issues during the COVID-19 pandemic”, Economic Bulletin, Issue 7, ECB, 2020, “Inflation measurement in times of economic distress”, Economic Bulletin, Issue 3, ECB, 2020, and “2021 HICP weights and their implications for the measurement of inflation”, Economic Bulletin, Issue 2, ECB, 2021. Adjustments in consumption behaviour can involve changing overall consumption or changing its composition by (i) switching away from a given product and/or brand category, (ii) searching for better prices and promotions, and/or (iii) trading down to different product varieties.
The percentages refer to an average figure given that responses are split into households facing budget constraints – defined as those with a high share of spending on necessities relative to their income – and those not facing such constraints.
Google searches corroborate this evidence, suggesting that since mid-2022 consumers have been actively exploring more budget-friendly retailer options and displaying a greater interest in promotions, especially for food (for example, “food promotions”, “menus with prices”, “discounts on food”).
Different households also have different strategies for adjusting to inflationary shocks, depending on their consumption basket, income and balance sheet characteristics. For a recent analysis of the implications of the energy price shock in heterogenous agent models, see Auclert, A., Monnery, H., Rognlie, M. and Straub, L., “Managing an Energy Shock: Fiscal and Monetary Policy”, mimeo, 2023.
A possible explanation for the similar percentages in the two groups is that causality is reversed and therefore households that manage to increase their income become unconstrained – as in this case income is the conditioning factor in determining the groups and the margin of adjustment.
See Argente, D. and Lee, M., “Cost of living inequality during the Great Recession”, Journal of the European Economic Association, Vol. 19, No 2, 2021, pp. 913-952, and “Grocery prices in the euro area: findings from the analysis of a disaggregated price dataset”, Economic Bulletin, Issue 1, ECB, 2015.
See the box entitled “A primer on measuring household income”, Economic Bulletin, Issue 8, ECB, 2023.
See also the box entitled “Minimum wages and their role for euro area wage growth”, Economic Bulletin, Issue 3, ECB, 2022.