
Economic and monetary developments
Overview
While the overall economic situation is expected to improve over 2021, there remains uncertainty surrounding the near-term economic outlook, relating in particular to the dynamics of the coronavirus (COVID-19) pandemic and the speed of vaccination campaigns. The rebound in global demand and additional fiscal measures are supporting global and euro area activity. But persistently high infection rates, the spread of virus mutations, and the associated extension and tightening of containment measures are weighing on euro area economic activity in the short term. Looking ahead, the ongoing vaccination campaigns, together with the envisaged gradual relaxation of containment measures, underpin the expectation of a firm rebound in economic activity in the course of 2021. Inflation has picked up over recent months mainly on account of some transitory factors and an increase in energy price inflation. At the same time, underlying price pressures remain subdued in the context of weak demand and significant slack in labour and product markets. While the latest staff projection exercise foresees a gradual increase in underlying inflation pressures, it confirms that the medium-term inflation outlook remains broadly unchanged from the staff projections in December 2020 and below the Governing Council’s inflation aim.
In these conditions, preserving favourable financing conditions over the pandemic period remains essential. The Governing Council assesses financing conditions by looking at a holistic and multifaceted set of indicators, spanning the entire transmission chain of monetary policy from risk-free interest rates and sovereign yields to corporate bond yields and bank credit conditions. Market interest rates have increased since the start of the year, which poses a risk to wider financing conditions. Banks use risk-free interest rates and sovereign bond yields as key references for determining credit conditions. If sizeable and persistent, increases in these market interest rates, when left unchecked, could translate into a premature tightening of financing conditions for all sectors of the economy. This is undesirable at a time when preserving favourable financing conditions still remains necessary to reduce uncertainty and bolster confidence, thereby underpinning economic activity and safeguarding medium-term price stability. Against this background and based on a joint assessment of financing conditions and the inflation outlook, the Governing Council expects purchases under the pandemic emergency purchase programme (PEPP) over the next quarter to be conducted at a significantly higher pace than during the first months of this year.
Economic and monetary assessment at the time of the Governing Council meeting of 11 March 2021
The global economy rebounded from the recession induced by the coronavirus pandemic faster than expected in the December 2020 Eurosystem staff macroeconomic projections. Meanwhile, headwinds to growth intensified as the pandemic worsened at the turn of the year. A resurgence in new infections led governments to reimpose stringent lockdowns, particularly in advanced economies. The adverse impact of these measures on global growth is already visible in incoming data. The pandemic remains the key factor shaping economic developments looking ahead. Vaccination efforts have gradually gathered pace, although at varying speeds across countries. However, the level of immunisation is still too low to allow the containment measures to be lifted. The fiscal stimulus package in the United States approved last December and the EU-UK trade deal support the outlook for the euro area’s external environment this year. Global GDP growth (excluding the euro area) is projected to be 6.5% in 2021, before decelerating to 3.9% in 2022 and 3.7% in 2023. This follows the estimated 2.4% contraction in global GDP in 2020. The EU-UK trade deal and the stronger projected recovery in advanced economies explain the upward revisions to euro area foreign demand. It is projected to increase by 8.3% this year and by 4.4% and 3.2% in 2022 and 2023 respectively, implying upward revisions of 1.7 percentage points in 2021 and 0.3 percentage points in 2022. Risks to the baseline projections for global growth are tilted to the upside, as the additional fiscal stimulus planned by President Biden represents a key upside risk. Model simulations suggest that it will raise the level of real GDP in the United States by 2-3% and take the economy above its potential, although the impact on inflation is likely to be moderate.
Financial conditions in the euro area have tightened somewhat since the Governing Council’s meeting in December 2020, amid positive risk sentiment. Over the review period (10 December 2020 to 10 March 2021) the forward curve of the euro overnight index average (EONIA) shifted upwards and became steeper. Currently, the forward curve does not signal expectations of a rate cut in the very near term. Euro area long-term sovereign bond spreads remained stable, as the rise in yields was driven by the increase in risk-free rates, supported by robust risk sentiment underpinned by monetary and fiscal stimulus. The prices of risk assets increased accordingly. In foreign exchange markets, the nominal effective exchange rate of the euro weakened slightly.
Following the strong rebound in growth in the third quarter of 2020, euro area real GDP declined by 0.7% in the fourth quarter. Looking at the full year, real GDP is estimated to have contracted by 6.6% in 2020, with the level of economic activity for the fourth quarter of the year standing 4.9% below its pre-pandemic level at the end of 2019. Incoming economic data, surveys and high-frequency indicators point to continued economic weakness in the first quarter of 2021 driven by the persistence of the pandemic and the associated containment measures. As a result, real GDP is likely to contract again in the first quarter of the year. Economic developments continue to be uneven across countries and sectors, with the services sector being more adversely affected by the restrictions on social interaction and mobility than the industrial sector, which is recovering more quickly. Although fiscal policy measures are supporting households and firms, consumers remain cautious in the light of the pandemic and its impact on employment and earnings. Moreover, weaker corporate balance sheets and elevated uncertainty about the economic outlook are still weighing on business investment.
Looking ahead, the ongoing vaccination campaigns, together with the gradual relaxation of containment measures – barring any further adverse developments related to the pandemic – underpin the expectation of a firm rebound in economic activity in the course of 2021. Over the medium term, the recovery of the euro area economy should be supported by favourable financing conditions, an expansionary fiscal stance and a recovery in demand as containment measures are gradually lifted.
This assessment is broadly reflected in the baseline scenario of the March 2021 ECB staff macroeconomic projections for the euro area. These projections foresee annual real GDP growth at 4.0% in 2021, 4.1% in 2022 and 2.1% in 2023. Compared with the December 2020 Eurosystem staff macroeconomic projections, the outlook for economic activity is broadly unchanged.
Overall, the risks surrounding the euro area growth outlook over the medium term have become more balanced, although downside risks remain in the near term. On the one hand, better prospects for global demand, bolstered by the sizeable fiscal stimulus, and the progress in vaccination campaigns are encouraging. On the other hand, the ongoing pandemic, including the spread of virus mutations, and its implications for economic and financial conditions continue to be sources of downside risk.
Euro area annual inflation increased sharply to 0.9% in January and February 2021, up from -0.3% in December 2020. The upswing in headline inflation reflects a number of idiosyncratic factors, such as the end of the temporary VAT rate reduction in Germany, delayed sales periods in some euro area countries and the impact of the stronger than usual changes in HICP weights for 2021, as well as higher energy price inflation. On the basis of current oil futures prices, headline inflation is likely to increase in the coming months, but some volatility is expected throughout the year reflecting the changing dynamics of the factors currently pushing inflation up. These factors can be expected to fade out of annual inflation rates early next year. Underlying price pressures are expected to increase somewhat this year due to current supply constraints and the recovery in domestic demand, although pressures are expected to remain subdued overall, also reflecting low wage pressures and the past appreciation of the euro. Once the impact of the pandemic fades, the unwinding of the high level of slack, supported by accommodative fiscal and monetary policies, will contribute to a gradual increase in inflation over the medium term. Survey-based measures and market-based indicators of longer-term inflation expectations remain at subdued levels, although market-based indicators have continued their gradual increase.
This assessment is broadly reflected in the baseline scenario of the March 2021 ECB staff macroeconomic projections for the euro area, which foresees annual inflation at 1.5% in 2021, 1.2% in 2022 and 1.4% in 2023. Compared with the December 2020 Eurosystem staff macroeconomic projections, the outlook for inflation has been revised up for 2021 and 2022, largely due to temporary factors and higher energy price inflation, while it is unchanged for 2023. HICP inflation excluding energy and food is expected to be 1.0% in 2021 and 1.1% in 2022, before increasing to 1.3% in 2023.
Monetary dynamics in the euro area continued to reflect the impact of the coronavirus pandemic. Broad money (M3) growth stood at 12.5% in January 2021, after 12.4% in December and 11.0% in November 2020. Strong money growth continued to be supported by the ongoing asset purchases by the Eurosystem, which remain the largest source of money creation. In the context of a still heightened preference for liquidity and a low opportunity cost of holding the most liquid forms of money, the narrow monetary aggregate M1 continues to be the main contributor to broad money growth. Developments in loans to the private sector were characterised by somewhat weaker lending to non-financial corporations and resilient lending to households. The monthly lending flow to non-financial corporations continued the moderation observed since the end of the summer. At the same time, the annual growth rate of loans to non-financial corporations remained broadly unchanged, at 7.0%, after 7.1% in December, still reflecting the very strong increase in lending in the first half of the year. The annual growth rate of loans to households remained broadly stable at 3.0% in January, after 3.1% in December, amid a solid positive monthly flow. Overall, the Governing Council’s policy measures, together with the measures adopted by national governments and other European institutions, remain essential to support bank lending conditions and access to financing, in particular for those most affected by the pandemic.
As a result of the very sharp economic downturn during the coronavirus pandemic, coupled with an unprecedentedly strong fiscal reaction, the general government budget deficit in the euro area is estimated to have increased to 7.2% of GDP in 2020, from 0.6% in 2019. The March 2021 ECB staff macroeconomic projections see the deficit ratio declining to 6.1% of GDP in 2021 and to 2.4% at the end of the projection horizon in 2023. Even though this path will increase euro area general government debt to 95% of GDP in 2023, about 11 percentage points higher than before the crisis, it should be noted that the adverse impact on the fiscal position will likely be somewhat smaller than was generally expected in the initial phase of the pandemic. Still, an ambitious and coordinated fiscal stance will remain critical. To this end, support from national fiscal policies should continue given weak demand from firms and households relating to the ongoing pandemic and the associated containment measures. As a complement, the Next Generation EU package will play a key role by contributing to a faster, stronger and more uniform recovery. It will increase economic resilience and the growth potential of EU Member States’ economies, particularly if the funds are deployed for productive public spending and this is accompanied by productivity-enhancing structural policies.
The monetary policy decisions
On 11 March 2021 the Governing Council took the following decisions in order to preserve favourable financing conditions over the pandemic period for all sectors of the economy to underpin economic activity and safeguard medium-term price stability.
- The Governing Council decided to continue to conduct net asset purchases under the pandemic emergency purchase programme (PEPP) with a total envelope of €1,850 billion until at least the end of March 2022 and, in any case, until the Governing Council judges that the coronavirus crisis phase is over. Based on a joint assessment of financing conditions and the inflation outlook, the Governing Council expects purchases under the PEPP over the next quarter to be conducted at a significantly higher pace than during the first months of this year. The Governing Council will purchase flexibly according to market conditions and with a view to preventing a tightening of financing conditions that is inconsistent with countering the downward impact of the pandemic on the projected path of inflation. In addition, the flexibility of purchases over time, across asset classes and among jurisdictions will continue to support the smooth transmission of monetary policy. If favourable financing conditions can be maintained with asset purchase flows that do not exhaust the envelope over the net purchase horizon of the PEPP, the envelope need not be used in full. Equally, the envelope can be recalibrated if required to maintain favourable financing conditions to help counter the negative pandemic shock to the path of inflation. Furthermore, the Governing Council will continue to reinvest the principal payments from maturing securities purchased under the PEPP until at least the end of 2023. In any case, the future roll-off of the PEPP portfolio will be managed to avoid interference with the appropriate monetary policy stance.
- Net purchases under the asset purchase programme (APP) will continue at a monthly pace of €20 billion. The Governing Council continues to expect monthly net asset purchases under the APP to run for as long as necessary to reinforce the accommodative impact of the ECB’s policy rates, and to end shortly before the Governing Council starts raising the key ECB interest rates. In addition, the Governing Council also intends to continue reinvesting, in full, the principal payments from maturing securities purchased under the APP for an extended period of time past the date when it starts raising the key ECB interest rates, and in any case for as long as necessary to maintain favourable liquidity conditions and an ample degree of monetary accommodation.
- The Governing Council decided to keep the key ECB interest rates unchanged. They are expected to remain at their present or lower levels until the inflation outlook robustly converges to a level sufficiently close to, but below, 2% within the projection horizon, and such convergence has been consistently reflected in underlying inflation dynamics.
- Finally, the Governing Council will continue to provide ample liquidity through its refinancing operations. In particular, the third series of targeted longer-term refinancing operations (TLTRO III) remains an attractive source of funding for banks, supporting bank lending to firms and households.
The Governing Council will also continue to monitor developments in the exchange rate with regard to their possible implications for the medium-term inflation outlook. It stands ready to adjust all of its instruments, as appropriate, to ensure that inflation moves towards its aim in a sustained manner, in line with its commitment to symmetry.
1 External environment
The March 2021 ECB staff macroeconomic projections indicated that the global economy had rebounded faster than expected from the recession following the outbreak of the coronavirus (COVID-19) pandemic. However, at the turn of the year headwinds to growth then intensified as a resurgence in new infections led governments to reimpose more stringent lockdowns, particularly in advanced economies. The adverse impact of these measures on global growth is already visible in incoming data. The pandemic remains the key factor shaping economic developments looking ahead. Vaccination efforts have gradually gathered pace, although at varying speeds across countries. Yet, the level of immunisation is still too low to allow the containment measures to be lifted. The fiscal stimulus package in the United States approved last December and the EU-UK trade deal support the outlook for the euro area’s external environment this year. Global GDP (excluding the euro area) is projected to increase by 6.5% in 2021, before slowing to 3.9% in 2022 and 3.7% in 2023. This follows the estimated contraction of global GDP to 2.4% in 2020. The EU-UK trade deal and the stronger projected recovery in advanced economies explain the upward revisions to the euro area foreign demand. It is projected to increase by 8.3% this year and by 4.4% and 3.2% in 2022 and 2023 respectively, implying upward revisions of 1.7 percentage points in 2021 and 0.3 percentage points in 2022. Risks to the baseline projections for global growth are tilted to the upside, as the additional fiscal stimulus planned by President Biden represents a key upside risk. Model simulations suggest that it will raise the level of real GDP in the United States by 2-3% and bring the economy above its potential, although the impact on inflation is likely to be moderate.
Global economic activity and trade
The global economy rebounded from the recession induced by the pandemic faster than expected. Global investment – benefiting from favourable financing conditions amid strong monetary policy support – is already close to pre-pandemic levels. However, the recovery in global consumption, supported by fiscal measures to bolster income and preserve jobs, continues to lag, as prevailing containment measures weigh on contact-intensive services. Global (excluding the euro area) real GDP growth rebounded strongly, by 7.4%, in the third quarter of 2020, which was 0.7 percentage points more than expected in the December 2020 Eurosystem staff macroeconomic projections. A more dynamic pace of recovery was observed in both advanced and emerging market economies. Following this V-shaped rebound, the recovery in global economic activity is expected to continue into the fourth quarter of 2020 at a robust but more moderate pace of 2.1%, which is still stronger than in the previous projections.
Headwinds to the recovery intensified as the global pandemic worsened at the turn of the year. A rise in new infections led governments to reimpose more stringent lockdowns, particularly in advanced economies. By contrast, containment measures in emerging market economies were tightened less. However, overall, the renewed lockdowns imply a setback to global growth in the first quarter of 2021, as evidenced by high-frequency trackers of economic activity in key advanced economies.
Survey data signal strong growth momentum, but also reveal heterogeneity across sectors and countries. The global (excluding the euro area) composite Purchasing Managers’ Index (PMI) output signals continued recovery of the world economy in early 2021. Following somewhat less dynamic increases at the turn of the year, it stood close to its long-term average in February, largely on account of faster growth in the services sector. By contrast, the pace of global (excluding the euro area) manufacturing PMI output continues to moderate, although it remains firmly in expansionary territory (Chart 1). The composite PMI output data suggest strengthening economic activity in the United States, China, India and Russia, while pointing to declining activity in the United Kingdom, Japan and Brazil.
Chart 1
Global (excluding the euro area) output PMI
(diffusion indices)

Sources: Markit and ECB calculations.
Note: The latest observations are for February 2021.
Global financial conditions remain accommodative, notwithstanding recent tightening triggered by the sell-off in sovereign bond markets. Since the December 2020 Eurosystem staff macroeconomic projections, the progress made on vaccine approvals and distribution, as well as the start of vaccination campaigns has lifted investor confidence. Combined with a last-minute Brexit trade deal and supportive economic policies, this benefited cyclical and risky assets. Overall, global financial conditions remain highly accommodative both in advanced and emerging market economies. More recently, the improved outlook for the global economy, underpinned by positive developments related to the pandemic and news regarding the additional fiscal stimulus in the United States, prompted a sell-off in global sovereign bond markets. Global equity markets initially benefited from optimism about the outlook. However, this upward trend came to a halt in late February, when concerns about the sharp increase in yields triggered a widespread sell-off in equity markets. Meanwhile, a market-based measure of inflation expectations in the United States derived from the prices of inflation-protected bonds increased to its highest level since 2014.
The outlook for the global economy continues to be shaped by how the pandemic evolves and the associated containment measures. Tighter containment measures helped to stabilise the recent waves of new infections, which together with the increase in vaccination rollout, holds the promise that the pandemic can be better contained and thus lockdown measures gradually lifted. At the same time, the impact of social distancing measures on contact-intensive services remains significant, although their overall economic impact is likely to be more limited than that of the March-April 2020 lockdowns. This reflects the fact that lockdowns became more targeted, and economic agents adjusted their behaviour to limit the negative impact of the lockdowns on activity. Against this backdrop, the pace of the global recovery is projected to slow significantly in the first quarter of 2021, before rebounding thereafter.
Among positive news, the fiscal stimulus package approved in the United States in December 2020 and the EU-UK trade deal imply a stronger outlook for 2021. These policy news items, both signalled as upside risks to the global outlook in the December 2020 Eurosystem staff macroeconomic projections and now included in the baseline, are projected to provide further support to growth. In the United States, the fiscal stimulus agreed in December last year amounts to USD 900 billion (4.4% of GDP). It is earmarked for direct income support for households and businesses and is projected to raise US activity this year. Moreover, the EU-UK trade deal replaces the “no deal” Brexit assumption underpinning the previous projections. It ensures tariff-free goods trade and zero quotas between the EU and the United Kingdom (similar to the EU-Canada Comprehensive Economic and Trade Agreement), thereby boosting activity and trade in the UK economy over the projection horizon.
Overall, global GDP (excluding the euro area) is projected to increase by 6.5% in 2021, before slowing to 3.9% and 3.7% in 2022 and 2023 respectively. This follows the estimated 2.4% contraction in global real GDP growth in 2020. Growth has been revised upwards by 0.7 percentage points in 2021, as the positive impact of a carry-over from the growth surprises towards the end of last year and more supportive economic policies are only partly offset by the negative impact on growth of stricter containment measures in the near term. Global real GDP (excluding the euro area) growth remains broadly unchanged for 2022-23 compared to the previous projections.
In the United States, the outlook for activity is supported by the fiscal stimulus enacted in late December. Following a stronger-than-expected rebound in the second half of 2020, economic activity slowed at the turn of the year, as containment measures were tightened in view of a deteriorating pandemic situation.[1] Since it is assumed that the pandemic situation will improve in the course of this year, the economy is projected to recoup these losses. In response to the slowdown, however, additional fiscal stimulus of 4.4% of GDP was passed in December, which is expected to boost growth this year. Following a slowdown in consumer spending in late 2020, the government stimulus cheques provided a boost to households’ income and the savings ratio. High-frequency credit card data and retail sales showed a strong rebound in January. While inflation remained stable in January, inflation expectations are on the rise. Headline consumer price inflation remained unchanged at 1.4%, and core inflation decreased to 1.4% in January. However, the short-term inflation outlook points towards strong base effects, mainly from oil prices, which may push inflation to above 2%. Additionally, the stronger growth outlook raised market-based inflation expectations to 2.2%.
The large additional fiscal stimulus planned by the new administration represents a key upside risk to current projections. The additional fiscal package totalling USD 1.9 trillion (8.9% of GDP) includes a renewal of unemployment benefits, additional one-off payments to households and an increase in both local and state spending to finance public health efforts and education. It represents a significant upside risk to the current projection baseline. Model simulations suggest that it would raise the level of real GDP in the United States by between 2-3% and bring the economy above its potential, while the impact on inflation appears to be moderate. It would also imply positive spillovers to growth in other economies, including in the euro area.[2]
In the United Kingdom, the strict lockdown and destocking are likely to push growth back into negative territory in the first quarter of 2021. The better-than-expected GDP outcome in the fourth quarter of 2020 mostly reflected specific factors, such as higher government spending and Brexit-related stockpiling. It also suggests that the COVID-19-related mobility restrictions towards the end of the year constrained activity much less than during the strict lockdown in spring 2020. For this year, however, survey data and high-frequency activity trackers indicate a sharp economic downturn owing to the renewed hard lockdown at the start of the year, suggesting a significant decline in real GDP growth in the first quarter of 2021. A negative contribution from inventories may aggravate the downturn, as initial disruptions at the EU-UK border together with lower levels of uncertainty on completion of the trade deal have contributed to some destocking. According to an industry survey, UK exports to the EU fell by an estimated 68% in January 2021 compared with a year earlier. Looking ahead, if fast progress on vaccination alleviates the health situation, further gradual loosening of the containment measures is likely in the course of the second quarter. This could kick off a rebound in growth, supported by a rise in consumption and a pick-up in private investment. The EU-UK trade deal, which ensures tariff-free and zero quotas goods trade, helped avoid trade disruptions at the turn of the year. Therefore, compared with the December 2020 Eurosystem staff macroeconomic projections baseline assumption of a “no deal” Brexit, the economy is projected to follow a more positive output and trade trajectory over the projection horizon. Annual consumer price inflation increased slightly in January to 0.7% from 0.6% in December, but is expected to pick up sharply in the near term. The rebound in energy and gas prices, following last year’s fall, and the end of the temporary cut in VAT in the hospitality sector in April will push up consumer prices.
In China, economic activity surprised positively in the fourth quarter, suggesting that the recovery from the pandemic continues unabated. Activity recovered swiftly on the back of a rebound in production, supported by government investment and strong external demand. Overall, the Chinese economy has returned to its pre-pandemic growth trajectory. China’s GDP grew by 2.3% in 2020 and the latest higher-frequency data still suggest continued robust growth, albeit pointing to a more moderate momentum. However, with policy support focused on investment and credit, financial stability risks could increase further. Consumption recovered more gradually, but consumer confidence has grown substantially over the past year, and consumption expenditure has almost fully recovered to 2019 levels as fears about a resurgence of the virus have subsided. A swift recovery from the pandemic shock in China also suggests that the scarring effects are likely to be limited.
In Japan, economic activity proved to be more resilient than initially expected in the final quarter of 2020. After a marked rebound in the third quarter, real GDP grew by a stronger-than-expected 3% in quarterly terms, supported by a marked recovery in private business investment, as well as robust private consumption and export growth. This notwithstanding, an upsurge in COVID-19 cases triggered tighter containment measures in early January. Activity in the first quarter is expected to decline as a result, although more moderately compared with spring 2020. Annual consumer price inflation rose significantly to -0.6% in January from -1.2% in December, as a larger drag from energy price declines was more than offset by a marked pick-up in core inflation (excluding food and energy).
In central and eastern European EU Member States, economic growth continued to recover in the fourth quarter of 2020. Looking ahead, the worsening pandemic and strict lockdowns are likely to weigh temporarily on the recovery in early 2021. Assuming that COVID-19 restrictions will be eased in the coming months, activity is projected to gradually regain momentum, supported by an accommodative fiscal and monetary stance.
In large commodity-exporting countries, the pace of recovery is subdued, while room for further policy support is limited. In Russia, the recovery in the third quarter benefited from broad policy support and improved infection control. However, tighter lockdowns enacted to control rising new infections are estimated to weigh on activity in the near term. In the course of 2021, however, an improvement in the pandemic situation is likely to support growth. Moreover, the economy is likely to benefit from the rise in oil prices recorded in recent months. In Brazil, authorities launched a sizeable fiscal policy stimulus package, including direct cash pay-outs to low-income households, which supported economic recovery last year. However, as the impact of fiscal support declined and the pandemic then worsened, growth is estimated to moderate in the near term.
In Turkey, real GDP growth rebounded sharply in the third quarter, and the recovery continued in the fourth quarter. A swift recovery was supported largely by strong credit growth, while the negative impact of containment measures was mostly limited to the hospitality and tourism sectors. However, as the policy stimulus is gradually reduced, growth is expected to moderate going forward, particularly in credit-driven personal consumption. Over the medium term the recent shift in policy direction, particularly by the central bank, is expected to push growth below the historical average.
The recovery in global trade was dynamic, as trade in goods recovered swiftly along with global industrial production. Global (excluding the euro area) goods’ imports had already returned to their pre-pandemic levels in late 2020, while international trade in services remains depressed. Nominal trade data suggest that global trade in services in November remained about 27% below its level at the end of 2019, with travel and tourism-related services accounting for a large share of this loss. Emerging pressures on global supply chains are adding headwinds to the recovery of global trade in the near term. The sharp recovery in manufacturing activity in the second half of 2020 and the related surge in new export orders put pressure on supply in certain markets and shipping capacity globally. This has lengthened suppliers’ delivery times, as evidenced by the historically high levels of global PMI indicators for delivery times. Shipping costs have also increased sharply, partly owing to an unbalanced trade recovery. The strong recovery in trade in China and east Asia led to a shortage of shipping containers, which lie idle in ports in Europe and North America. New export orders are another signal of softening dynamics in the global manufacturing sector, which in January declined below the expansionary threshold for the first time since last September and remained there in February (Chart 2).
Chart 2
Global (excluding the euro area) imports of goods and new export orders
(left-hand scale: index, December 2019 = 100; right-hand scale: diffusion index)

Sources: Markit, CPB Netherlands Bureau for Economic Policy Analysis and ECB calculations.
Note: The latest observations are for February 2021 for the PMI data and December 2020 for global merchandise imports.
Global (excluding the euro area) imports have been revised strongly upwards and are projected to increase by 9.0% in 2021, before slowing to 4.1% and 3.4% in 2022 and 2023 respectively. This follows the estimated contraction of global trade at 9.1% in 2020. Compared with the December 2020 Eurosystem staff macroeconomic projections, global imports and, in particular, euro area foreign demand were revised significantly upwards owing to the EU-UK trade deal and to a lesser extent owing to projected stronger recovery in advanced economies. This implies that euro area foreign demand is projected to increase by 8.3% this year and by 4.4% and 3.2% in 2022 and 2023 respectively, resulting in upward revisions of 1.7 percentage points in 2021 and 0.3 percentage points in 2022. For 2023 euro area foreign demand remains unchanged compared with the December projections. More positive data towards the end of last year, together with the stronger imports projected for the euro area’s key trading partners, suggest that the gap relative to the pre-pandemic path has narrowed markedly, as it has for global real GDP growth.
Risks to the baseline projections for global growth are tilted to the upside. Further to the abovementioned additional fiscal stimulus planned by President Biden’s administration and in line with the previous projection rounds, two alternative scenarios for the global outlook are used to illustrate the uncertainty surrounding the future course of the pandemic. These scenarios reflect the interplay between the evolution of the pandemic and the associated path of containment measures.[3] Other risks to the global outlook relate to a faster-than-expected reduction in savings accumulated during the pandemic in advanced economies, which could in turn support private consumption and imports. By contrast, a sudden repricing of risk in financial markets could result in capital outflows and currency depreciation in vulnerable emerging market economies, thus derailing their recovery. Moreover, tight production capacities in IT-related industries and container shortages in the shipping sector could increase risks to global value chains and global trade. In addition, high and increasing indebtedness across advanced and emerging market economies represent additional downside risks to growth over the medium term.
Global price developments
Commodity prices have increased significantly, and oil prices are close to pre-pandemic levels. Brent crude oil prices increased by close to 35% compared with the December 2020 Eurosystem staff macroeconomic projections amid unilateral supply cuts by Saudi Arabia, improving global demand prospects underpinned by the robust recovery in global manufacturing and growth expectations for the United States. In addition, oil prices benefited from a global rally in risky assets. This increase in oil prices pushed the futures curve into backwardation, meaning that current oil prices are above those assumed at the end of the projection horizon. Metal prices also benefited from buoyant global demand amid supply restrictions in some key world exporting countries, increasing by 10% since the December projections. Both metal and food commodity prices have risen well above their pre-pandemic levels.
Global headline inflation increased in January owing to a less negative contribution from energy prices. Annual consumer price inflation in member countries of the Organisation for Economic Co-operation and Development (OECD) increased to 1.5% in January from 1.2% in December 2020 (Chart 3). Food price inflation was broadly stable, while the drag from energy price inflation eased somewhat. Core consumer price index inflation excluding food and energy increased slightly to 1.7% in January from 1.6% in the previous month. Headline annual consumer price inflation increased across all advanced economies but remained in negative territory in Japan. Among major non-OECD emerging market economies, in China, annual headline inflation fell back into negative territory after picking up temporarily in December.
Chart 3
OECD consumer price inflation
(year-on-year percentage changes; percentage point contributions)

Sources: OECD and ECB calculations.
Note: The latest observations are for January 2021.
Sharply increasing commodity prices are expected to push up global consumer prices. In the near term the rise in headline inflation will be further accentuated by the positive base effect owing to the initial reaction of global commodity prices to the pandemic shock in spring 2020. This pattern is also evident from euro area competitors’ export prices in national currency, which are expected to rise dynamically in the course of 2021. However, this increase in inflation is likely to be transitory, given a substantial a degree of slack in the global economy, particularly in the labour market.
2 Financial developments
Over the review period (10 December 2020 to 10 March 2021) the forward curve of the euro overnight index average (EONIA) shifted upwards and became steeper. Currently, the forward curve does not signal expectations of a rate cut in the very near term. Euro area long-term risk-free rates rose, partly driven by spillovers from the United States, while sovereign bond spreads remained broadly stable. Equity prices increased. In foreign exchange markets, the nominal effective exchange rate of the euro weakened slightly.
The euro overnight index average (EONIA) and the new benchmark euro short-term rate (€STR) averaged -48 and -56 basis points respectively over the review period.[4] Excess liquidity increased by €241 billion to around €3,692 billion. This rise mainly reflects asset purchases under the pandemic emergency purchase programme and the asset purchase programme, which were partly offset by voluntary repayments of targeted longer-term refinancing operations and liquidity-absorbing autonomous factors.
The EONIA forward curve shifted upwards over the review period, especially at long horizons, and also became steeper (Chart 4). The mild inversion of the curve at short-term maturities that was visible in the path prevailing in December has disappeared in an environment of more favourable sentiment towards the recovery. The trough of the curve, which is 2 basis points below the current EONIA level of -50 basis points, corresponds to April 2022. The curve thus indicates that financial markets are not pricing in an imminent rate cut. Overall, EONIA forward rates remain below zero for horizons up to mid-2026, reflecting continued market expectations of a prolonged period of negative interest rates.
Chart 4
EONIA forward rates
(percentages per annum)

Sources: Refinitiv and ECB calculations.
Euro area long-term sovereign bond yields increased together with their global counterparts, albeit by significantly less, to stand notably higher than they were at the time of the December meeting of the Governing Council (Chart 5). Led by an increasingly positive economic outlook for the United States, sustained by expectations for sizeable fiscal stimulus by the new US administration under President Joe Biden, long-term sovereign bond yields tightened sharply on a global scale. Specifically, the GDP-weighted euro area ten-year sovereign bond yield increased by 28 basis points to reach 0.03%. The ten-year sovereign bond yields in the United States and in the United Kingdom increased even more strongly, rising by 62 and 51 basis points and reaching 1.52% and 0.72%, respectively.
Chart 5
Ten-year sovereign bond yields
(percentages per annum)

Sources: Refinitiv and ECB calculations.
Notes: The vertical grey line denotes the start of the review period on 10 December 2020. The latest observations are for 10 March 2021.
The long-term spreads of euro area sovereign bonds relative to overnight index swap rates remained fairly stable, as yields increased largely in tandem with risk-free rates in most jurisdictions (Chart 6). Italian sovereign spreads declined noticeably in the run-up to the formation of a new government by former ECB President Mario Draghi, and Italian sovereign spreads briefly reached a new multi-year low before increasing again. In particular, over the review period, the Italian and Portuguese ten-year spreads narrowed by 12 and 1 basis points, to stand at 0.73% and 0.30%, respectively. Over the same period, the German, French and Spanish ten-year spreads marginally increased by 1, 1 and 6 basis points and reached -0.26%, -0.01% and 0.41%, respectively.
Chart 6
Ten-year euro area sovereign bond spreads vis-à-vis the overnight index swap rate
(percentage points)

Sources: Refinitiv and ECB calculations.
Notes: The spread is calculated by subtracting the ten-year overnight index swap rate from the ten-year sovereign bond yield. The vertical grey line denotes the start of the review period on 10 December 2020. The latest observations are for 10 March 2021.
Equity prices increased on both sides of the Atlantic, reaching record highs over the review period in the United States, as risk sentiment remained supportive (Chart 7). Except for some volatility, equity prices in the euro area and the United States generally trended up, before only partially receding in the United States towards the end of January. Financial stocks recorded particularly notable gains both in the United States and in the euro area. Overall, the stock prices of euro area and US non-financial corporations (NFCs) increased by 7.4% and 4.4% respectively. The equity prices of euro area and US banks increased by 16.5% and 26.9% respectively, with the US index having fully recovered the losses recorded since the beginning of the pandemic.
Chart 7
Euro area and US equity price indices
(index: 1 January 2019 = 100)

Sources: Refinitiv and ECB calculations.
Notes: The vertical grey line denotes the start of the review period on 10 December 2020. The latest observations are for 10 March 2021.
Euro area corporate bond spreads remained broadly unchanged (Chart 8). Over the review period, the investment-grade NFC bond spread and financial sector bond spread (relative to the risk-free rate) narrowed by 2 and 4 basis points, respectively, to stand in line with their pre-pandemic levels. Overall, there have been only minor movements in corporate bond spreads since the December meeting of the Governing Council.
Chart 8
Euro area corporate bond spreads
(basis points)

Sources: Markit iBoxx indices and ECB calculations.
Notes: Spreads are calculated as asset swap spreads to the risk-free rate. The indices comprise bonds of different maturities (with at least one year remaining) with an investment-grade rating. The vertical grey line denotes the start of the review period on 10 December 2020. The latest observations are for 10 March 2021.
In foreign exchange markets, the euro depreciated slightly in trade-weighted terms (Chart 9). While the nominal effective exchange rate of the euro, as measured against the currencies of 42 of the euro area’s most important trading partners, depreciated by 1.1% over the review period, it remained only 2.7% below the historic high reached in December 2008. This reflected diverging bilateral exchange rate developments in a market environment characterised by increasing risk appetite. The euro depreciated against the US dollar (by 1.8%), the Chinese renminbi (by 2.3%) and the pound sterling (by 6.0%) while strengthening against the Swiss franc (by 2.9%) and the Japanese yen (by 2.0%). The euro also mostly strengthened against the currencies of non-euro area EU Member States in central and eastern Europe.
Chart 9
Changes in the exchange rate of the euro vis-à-vis selected currencies
(percentage changes)

Source: ECB.
Notes: EER-42 is the nominal effective exchange rate of the euro against the currencies of 42 of the euro area’s most important trading partners. A positive (negative) change corresponds to an appreciation (depreciation) of the euro. All changes have been calculated using the foreign exchange rates prevailing on 10 March 2021.
3 Economic activity
Following the strong rebound seen in the third quarter of 2020, euro area real GDP contracted again in the fourth quarter, falling by 0.7% quarter on quarter, leaving output almost 5% below pre-pandemic levels. Economic developments continue to be uneven across sectors and countries, with the service sector being the most affected by the restrictions on social interaction and mobility. Although fiscal policy measures are continuing to support households and firms, consumers remain cautious in the light of the pandemic and its impact on employment and earnings. However, corporate investment remains relatively resilient, despite weaker corporate balance sheets and elevated uncertainty. Overall, incoming data, surveys and high‑frequency indicators point to continued economic weakness in the first quarter of 2021, driven by the evolution of the pandemic and the associated containment measures. As a result, real GDP is likely to contract again in the first quarter of the year. Looking further ahead, however, the roll-out of vaccines allows for greater confidence in the resolution of the health crisis, which should reduce uncertainty, barring any further adverse developments relating to the pandemic. Over the medium term, the economic recovery in the euro area should also be supported by favourable financing conditions, a supportive fiscal stance and a recovery in demand as containment measures are gradually lifted.
This assessment is broadly reflected in the baseline scenario of the March 2021 ECB staff macroeconomic projections for the euro area. Those projections foresee annual real GDP growth of 4.0% in 2021, 4.1% in 2022 and 2.1% in 2023. The outlook for economic activity is broadly unchanged compared with the December 2020 Eurosystem staff macroeconomic projections. Overall, while the risks surrounding the short-term growth outlook for the euro area remain on the downside, medium-term risks have become more balanced. On the one hand, the improved prospects for global demand, the significant fiscal stimulus across the euro area and the roll-out of vaccines are all cause for optimism. On the other hand, however, the ongoing pandemic (including the spread of new variants of the virus) and its implications for economic and financial conditions continue to be sources of downside risk.
Following a modest contraction in output in the fourth quarter of 2020, economic activity in the euro area is expected to remain weak in the first quarter of 2021. Real GDP declined by 0.7% quarter on quarter in the fourth quarter of 2020, following growth of 12.5% in the third quarter (Chart 10). That was, however, better than the 2.2% contraction that had been foreseen in the December 2020 Eurosystem staff macroeconomic projections. The fall in output in the fourth quarter was mainly due to domestic demand, particularly private consumption. Although output in the fourth quarter was still almost 5% below the pre-pandemic level seen a year earlier, the better than expected outcome for that quarter resulted in a positive carry-over effect on growth in 2021 totalling 2.2%. On the production side, developments in the fourth quarter varied significantly across sectors. While value added in the service sector declined markedly, output in the industrial sector (excluding construction) increased further. Indeed, with strong growth having already been seen in the third quarter, the rebound in industrial output in the second half of 2020 broadly offset the sharp decline seen in the first half of the year. Box 4 takes stock of the impact of pandemic-related containment measures across economic sectors in the largest euro area countries, as well as looking at how that impact has changed over time. Overall, euro area output is estimated to have fallen by 6.6% in 2020 – somewhat more than in the United States. As Box 1 explains, this may be related to the stricter lockdowns seen in the euro area and the more expansionary fiscal policy in the United States.
Chart 10
Euro area real GDP and its components
(quarter-on-quarter percentage changes; quarter-on-quarter percentage point contributions)

Source: Eurostat.
The euro area labour market continues to benefit from significant policy support, while employment has seen increases in recent months and the unemployment rate has been broadly stable. The extensive use of job retention schemes continues to support employment, thereby mitigating the impact on the unemployment rate, supporting household income and limiting economic uncertainty. Employment rose by 0.3% quarter on quarter in the fourth quarter of 2020, following an increase of 1.0% in the third quarter (Chart 11). However, despite that improvement, employment was still 1.9% lower in the fourth quarter than it had been one year earlier prior to the pandemic. Hours worked continue to play an important role in the adjustment of the euro area labour market. Total hours worked declined by 1.6% quarter on quarter in the fourth quarter (following an increase of 14.8% in the third quarter), standing almost 6.5% below the level seen at end-2019. Meanwhile, the unemployment rate stood at 8.1% in January 2021, broadly unchanged from November 2020 and down from just under 8.7% in August 2020, but still some 0.8 percentage points higher than the pre-pandemic level recorded in February 2020. Workers covered by job retention schemes were estimated to account for around 5.9% of the labour force in January 2021, down from almost 20% in April 2020. However, the number of workers covered by such schemes has been rising since October 2020 as a result of renewed containment measures in some countries.
Chart 11
Euro area employment, the PMI assessment of employment and the unemployment rate
(left-hand scale: quarter-on-quarter percentage changes, diffusion index; right-hand scale: percentages of the labour force)

Sources: Eurostat, Markit and ECB calculations.
Notes: The two lines indicate monthly developments; the bars show quarterly data. The PMI is expressed as a deviation from 50 divided by 10. The latest observations are for the fourth quarter of 2020 for employment, February 2021 for the PMI and January 2021 for the unemployment rate.
Short-term labour market indicators have partially recovered, but still point to some vulnerabilities in the euro area labour market. In February 2021, the composite PMI employment indicator moved into expansionary territory for the first time since the onset of the coronavirus (COVID-19) pandemic, albeit remaining in contractionary territory in some countries and the low-tech service sector. Households’ unemployment expectations remained elevated in that month amid subdued demand for labour. Looking ahead, the substantial numbers of workers who are still covered by job retention schemes may pose upward risks to the unemployment rate going forward.
Consumer spending lost momentum around the turn of the year, declining by 3.0% quarter on quarter in the fourth quarter of 2020. In January 2021, retail trade fell by 5.9% month on month, while new car registrations declined by 22% over the same period (falling to their lowest level since June 2020). With the second wave of the pandemic leading to a renewed increase in household savings, bank deposit inflows for households remained high in January (following a temporary dip in December). Large numbers of households remain unaffected by the immediate impact of the pandemic in terms of their income, and those households have continued to accumulate substantial amounts of involuntary savings. At the same time, households’ expectations for the next 12 months as regards the general economic situation, their personal financial situation and their plans to make major purchases have not improved significantly since May of last year.
Corporate investment (proxied by non-construction investment) remains relatively resilient, having increased further in the fourth quarter of 2020. Non‑construction investment has been supported by strong investment in intellectual property products, probably partly as a result of the need for further digitalisation of the economy in response to the pandemic. Meanwhile, investment in machinery and equipment increased only modestly at the end of 2020, following exceptionally strong growth in the third quarter. In recent months, corporate investment has been supported by strong foreign demand, as reflected in the growth of industrial orders for capital goods from outside the euro area, as well as the improvements seen in manufacturing firms’ export order books in the period to February. Recent survey data are also consistent with investment remaining resilient in the first quarter of 2021. Indeed, increases in business confidence and production expectations in the capital goods sector (particularly in February) suggest that investment is likely to grow further in the coming months. The outlook for investment will probably continue to be driven mainly by the manufacturing sector, whereas service sector firms (which have generally been more affected by the pandemic and the associated containment measures) are, according to recent surveys, more likely to have delayed or cancelled investment plans. Looking further ahead, increases in firms’ debt burdens and a potential increase in bankruptcies may pose a threat to the ongoing recovery in investment.
Housing investment remained resilient in the fourth quarter of 2020, despite the renewed increase in pandemic-related restrictions, although the short-term outlook remains uncertain. Housing investment increased slightly in the fourth quarter, rising by 0.5% quarter on quarter, but remained some 3% below the level seen at end-2019. However, recent indicators point to some moderation in the pace of recovery in the short term, partly as a result of the renewed mobility restrictions seen in recent months. This may even derail the progress made in the second half of 2020 in terms of returning to pre-pandemic levels of housing investment. On the demand side, European Commission survey data on consumers’ intentions to renovate their houses over the next 12 months point to a weakening of housing expenditure in the short term, albeit with differences across countries. On the supply side, despite some signs of recovery in building permits and order books, the latest confidence indicators suggest that weakness in short-term prospects for business activity could weigh on firms in the real estate sector and (to a lesser extent) the construction sector. Within the construction sector, PMI output indicators for the first two months of 2021 suggest that firms in the residential segment have brighter prospects than their counterparts in the commercial segment.
Euro area trade continued to expand at a robust rate in the fourth quarter of 2020, largely as a result of further increases in manufacturing trade. Trade growth in the fourth quarter was driven by (i) consolidation of the recovery seen in the third quarter, (ii) growth in consumer goods exports to the United Kingdom, Brazil and Asia, and (iii) increased energy imports from Norway and Russia, with those three factors making contributions of roughly equal size. However, exports to non‑euro area countries were the sole driver of growth in December, supported by extraordinary stockpiling of EU goods in the United Kingdom ahead of the end of the Brexit transition period. At the start of 2021, the cost of exporting from the euro area to the United Kingdom rose, delivery times lengthened, and containerised exports experienced an abrupt contraction (according to maritime trade data). The resulting effect on trade is likely to be temporary, as leading indicators for January and February point to further growth in manufacturing exports in the first quarter of 2021. Whereas consumer goods were the main driver of new export orders in the fourth quarter, developments in the first two months of 2021 reflected improvements in the capital and intermediate goods sectors. Further evidence of an ongoing normalisation of manufacturing trade is provided by incoming data on shipping rates, which returned to pre-pandemic levels in February. At the same time, however, trade in services remains heavily impaired, with protracted lockdowns continuing to prevent any substantial improvement.
Conjunctural indicators point to continued moderation in economic activity in the first quarter of 2021. Survey data remain at low levels broadly consistent with a modest further contraction in the first quarter of this year, despite moderate improvements relative to the fourth quarter of 2020. The flash composite output PMI, which declined from 52.4 in the third quarter to 48.1 in the fourth quarter, has recently increased somewhat, averaging 48.3 over January and February. This improvement reflects developments in the service sector (albeit it suggests that services are still in contractionary territory). In contrast, the manufacturing output PMI declined marginally in the first two months of 2021 (compared with the fourth quarter of 2020) but remained in expansionary territory. Looking specifically at pandemic-related measures, although the composite Stringency Index has remained close to the levels seen at its peak in April 2020, high-frequency mobility indicators for euro area countries have started to improve in recent months. Overall, the short‑term outlook continues to be surrounded by considerable uncertainty.
The recent intensification of the COVID‑19 pandemic has weakened the short‑term outlook for the euro area economy but has not derailed its recovery. Efforts to ramp up the production and distribution of vaccines (which should allow for the relaxation of containment measures), combined with substantial support from monetary and fiscal policies (including Next Generation EU funds) and better prospects for global demand, should result in a robust recovery as of the second half of 2021. This is reflected in the March 2021 ECB staff macroeconomic projections for the euro area, which foresee annual real GDP growth of 4.0% in 2021, 4.1% in 2022 and 2.1% in 2023 (Chart 12). That assessment is broadly unchanged compared with the December 2020 projections. Real GDP is expected to exceed its pre-pandemic level in the second quarter of 2022. Nevertheless, short‑term risks to the growth outlook remain tilted to the downside owing to the resurgence of the virus, the emergence of new mutations and the associated containment measures. At the same time, the risks surrounding the growth outlook for the euro area over the medium term have become more balanced. In addition, the Biden administration’s American Rescue Plan, which came too late to be included in the baseline projections, is likely to result in some positive spillovers for the euro area.[5]
Chart 12
Euro area real GDP (including projections)
(quarter-on-quarter percentage changes)

Sources: Eurostat and the article entitled “ECB staff macroeconomic projections for the euro area, March 2021”.
Notes: In view of the unprecedented volatility of real GDP in 2020, this chart uses a different scale from 2020 onwards. The vertical line indicates the start of the projection horizon. The chart does not show ranges around the projections, reflecting the fact that, in the present circumstances, the standard computation method for those ranges (which is based on historical projection errors) would not provide a reliable indication of the unprecedented uncertainty surrounding current projections.
4 Prices and costs
According to Eurostat’s flash estimate, euro area annual inflation was 0.9% in February 2021, which was unchanged compared to January 2021 but a substantial increase from -0.3% in December 2020. On the basis of current oil futures prices, headline inflation is likely to increase in the coming months, but some volatility is expected throughout the year, reflecting the changing dynamics of the factors currently pushing inflation up. These factors can be expected to fade out of annual inflation rates early next year. Underlying price pressures are expected to increase somewhat this year owing to current supply constraints and the recovery in domestic demand, although pressures are expected to remain subdued overall, reflecting, among other things, low wage pressures and the past appreciation of the euro. Once the impact of the coronavirus (COVID-19) pandemic fades, the unwinding of the high level of slack, supported by accommodative fiscal and monetary policies, will contribute to a gradual increase in inflation over the medium term. Survey-based measures and market-based indicators of longer-term inflation expectations remain at subdued levels, although market-based indicators have continued their gradual increase. This assessment is broadly reflected in the baseline scenario of the March 2021 ECB staff macroeconomic projections for the euro area, which foresees annual inflation at 1.5% in 2021, 1.2% in 2022 and 1.4% in 2023. Compared with the December 2020 Eurosystem staff macroeconomic projections, the outlook for inflation has been revised up for 2021 and 2022, largely owing to temporary factors and higher energy price inflation, while it is unchanged for 2023
HICP inflation increased sharply at the beginning of this year compared to the end of last year. After four consecutive months at -0.3%, HICP inflation increased to 0.9% in January 2021 and remained at this rate in February. According to Eurostat’s flash estimate, the unchanged rate in February 2021 was the result of less negative energy inflation being offset by a decline in HICP excluding energy and food (HICPX) inflation. HICPX inflation decreased to 1.1% in February from 1.4% in January, but was substantially higher than the 0.2% recorded in the last four months of 2020.
The upswing in headline inflation in January reflected several factors that were mostly temporary and of a statistical nature (Chart 13). First, the impact of stronger than usual changes in HICP weights for 2021 associated with changes in household consumption patterns during the COVID-19 pandemic played a significant role. This was especially the case for travel and recreation-related services. The change in expenditure weights contributed 0.3 percentage points to HICP inflation in January.[6] Second, the reversal of the German VAT rate cut appears to have been broadly symmetric in magnitude to the impact of the rate decrease in July 2020 and contributed about 0.3 percentage points to the uptick in HICP inflation. Third, changes in the timing and magnitudes of seasonal sales in a number of euro area countries implied a substantial rise in non-energy industrial goods (NEIG) inflation. However, even when accounting for these factors, there remains some upward impact on both headline HICP inflation and HICPX inflation from the sum of other factors (yellow bars in Chart 13).
Chart 13
Change in headline inflation between December 2020 and January 2021
(percentage point contributions)
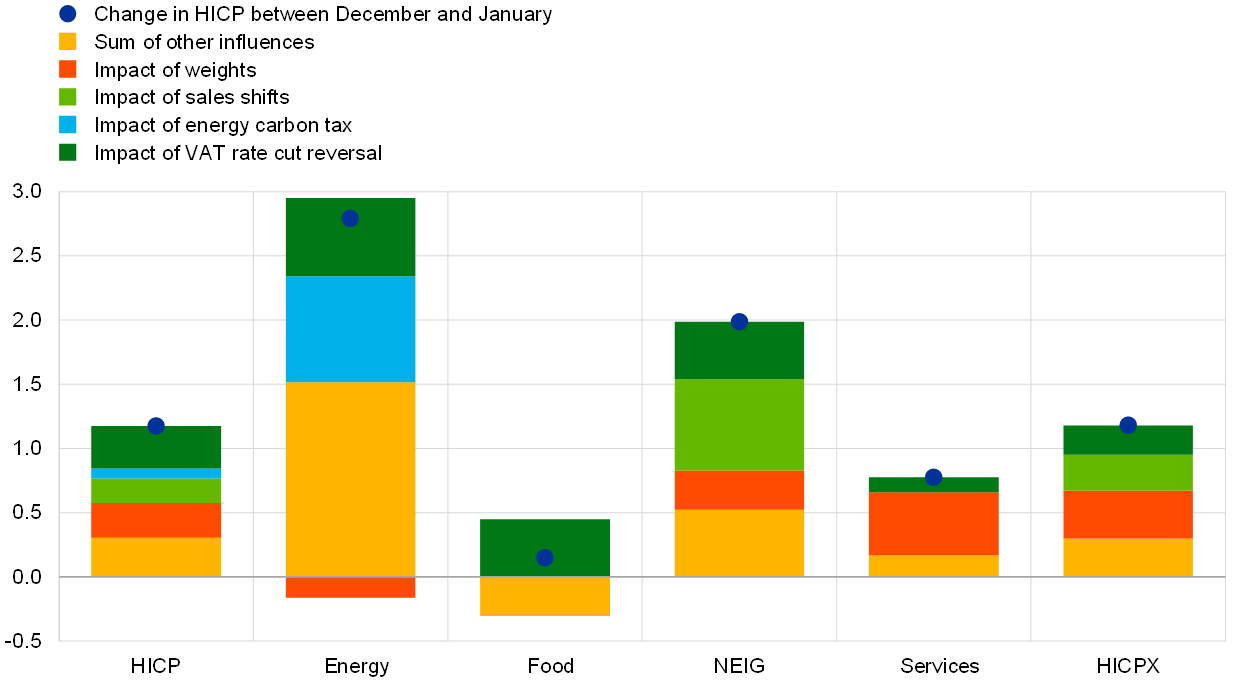
Sources: Eurostat and ECB staff calculations.
Notes: The sales shifts apply to Italy and France. Both the energy carbon tax and the VAT rate cut reversal relate to Germany.
The recent increase in HICP inflation was also due to successively less negative energy inflation. After standing at ‐6.9% in December 2020, energy inflation increased to -4.1% in January 2021 and further to -1.7% in February. The less negative rate in January reflected recent higher oil prices in euro, while in February the rate also reflected a base effect from the drop in oil prices at the onset of the pandemic last year. Other factors that contributed to the less negative energy inflation rate included the reversal of the VAT rate cut and the introduction of the carbon surcharge in Germany and higher electricity prices, particularly in Spain, owing to cold weather.
Price imputations became more prevalent in January and February, implying somewhat more uncertainty surrounding the signal for underlying price pressures. After the share of price imputations had returned to very low rates during the summer of 2020, towards the end of the year it began to rise as COVID-19 containment measures were tightened again. In February 2021, 14% and 19%, respectively, of the items in the HICP and the HICPX were imputed.
While exclusion-based measures of underlying inflation edged up, model-based measures remained broadly unchanged in January (latest available data).[7] HICP inflation excluding energy, food, travel-related items, clothing and footwear (HICPXX) increased to 1.2% in January 2021, from 0.8% in the previous month, while the persistent and common component of inflation (PCCI) remained unchanged at 1.2%. The Supercore indicator rose slightly from 0.5% in December 2020 to 0.7% in January 2021 (Chart 14). The measures were also affected by some of the temporary factors mentioned above, such as the reversal of the VAT rate cut in Germany.
Chart 14
Measures of underlying inflation
(annual percentage changes)
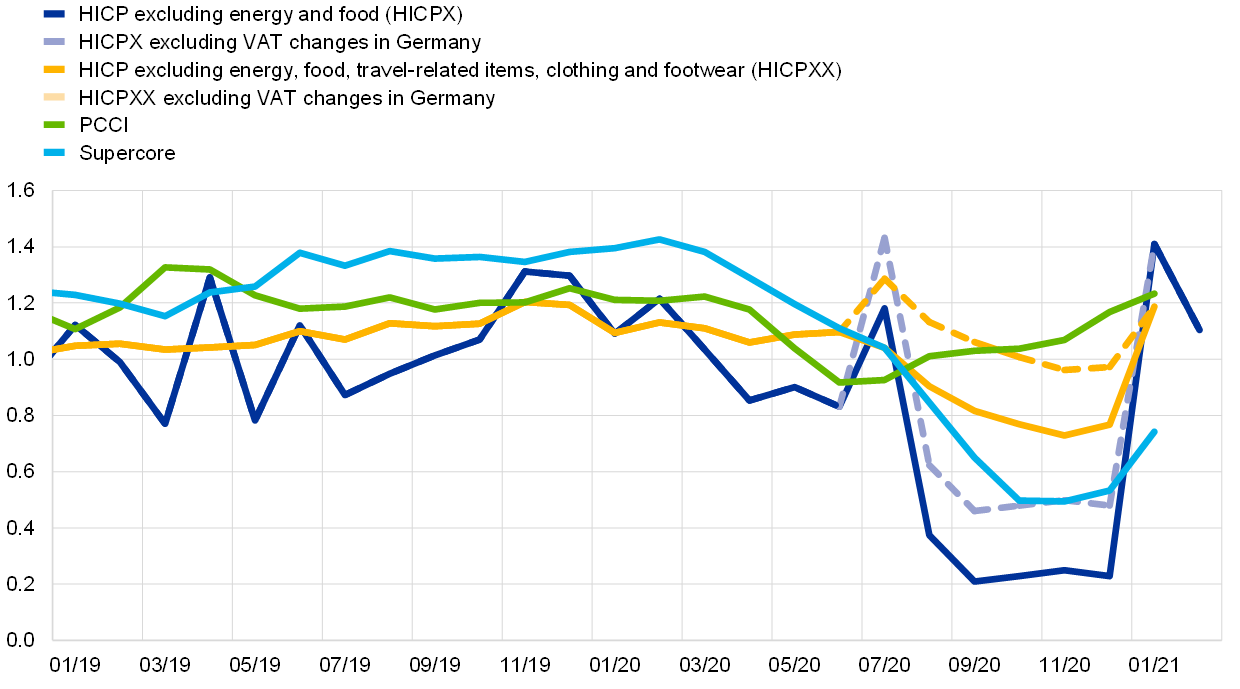
Sources: Eurostat and ECB calculations.
Notes: For HICPX and HICPX excluding VAT changes in Germany, the latest observations are the February 2021 flash estimate. For the rest, the latest observations are January 2021.
Pipeline price pressures for non-energy industrial goods inflation remained broadly stable at the later stages, while pressures at the earlier stages intensified. For non-food consumer goods, domestic producer price inflation was 0.6% in January, continuing to hover close to its long-term average. Import price inflation for non-food consumer goods remained at low levels, with the monthly profile largely mirroring movements in the euro nominal effective exchange rate. At the earlier input stages, both producer and import price inflation for intermediate goods continued to increase in January, probably reflecting a further easing of downward pressures from oil and other commodity prices.[8]
Wage setting continues to be affected by the government support schemes. This is reflected, for instance, in the divergence between growth in compensation per employee and growth in compensation per hour. The gap between the two widened again in the fourth quarter of 2020 as the take-up of short-time work and temporary lay-off schemes increased as a result of the renewed lockdown measures at the end of last year. Annual growth in compensation per employee increased slightly to 0.7% in the fourth quarter from 0.6% in the third quarter, after a very negative rate of -4.5% in the second quarter. Annual growth in compensation per hour, on the other hand, rebounded again to 5.1% in the fourth quarter from 3.4% in the third quarter of 2020 (see Chart 15). These divergent developments reflect the impact of short-time work and temporary lay-off schemes, under which workers maintained their employment status but only received part of their usual compensation, while actual hours worked per person declined sharply.[9] Growth in negotiated wages, which is not directly affected by developments in hours worked and the recording of benefits from job retention schemes, increased to 1.9% in the fourth quarter of 2020, after 1.7% and 1.6% in the second and third quarters respectively. This upward movement reflected the impact of one-off payments at the end of the year, but even discounting for this impact, negotiated wage growth remained relatively robust at 1.6% in the fourth quarter, as the data still include agreements concluded before the onset of the pandemic.
Chart 15
Decomposition of compensation per employee into compensation per hour and hours worked
(annual percentage changes; percentage point contributions)

Sources: Eurostat and ECB calculations.
Note: The latest observations are for the fourth quarter of 2020.
Market-based indicators of inflation expectations continued to rise in tandem with the global reflation trend (Chart 16). The increase in euro area market-based indicators of inflation expectations over the review period mainly reflected three global factors: an improvement in risk sentiment owing to the start of COVID-19 vaccinations and decreasing rates of infection; renewed fiscal stimulus in the United States under the Biden administration; and a buoyant recovery in commodity prices. During the first part of the review period, short and medium-term indicators of market based-inflation expectations edged higher, but then partially fell back in line with their international peers around mid-February. However, towards the end of the month euro area inflation-linked swap (ILS) rates moved upwards again. By the beginning of March, both short and long-term market-based indicators of inflation expectations stood above their pre-pandemic levels. Nevertheless, levels of short and longer-term forward ILS rates have continued to be very subdued recently and do not suggest a return of inflation to the ECB’s aim over the foreseeable future. Survey-based indicators of inflation expectations show some signs of having levelled off close to their historically low levels. According to the ECB Survey of Professional Forecasters (SPF) for the first quarter of 2021 (conducted in early January 2021), longer-term inflation expectations were unchanged at 1.7%.
Chart 16
Market-based indicators of inflation expectations
(annual percentage changes)
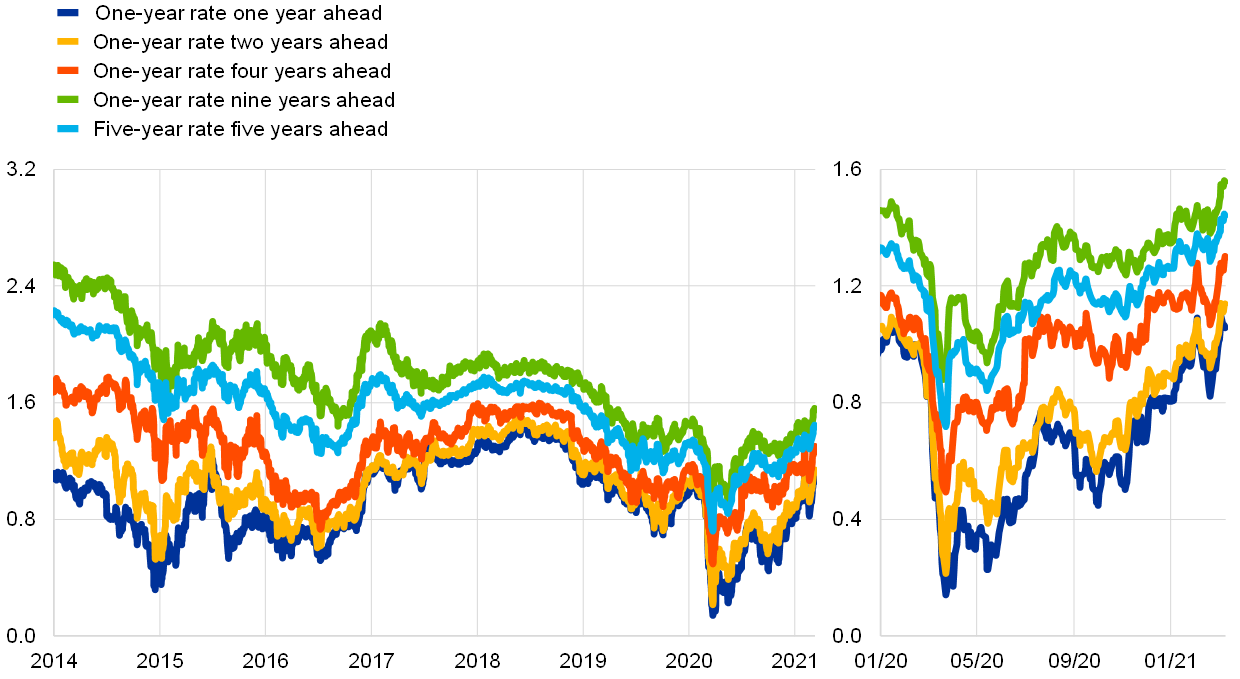
Sources: Thomson Reuters and ECB calculations.
Note: The latest observations are for 10 March 2021.
The March 2021 ECB staff macroeconomic projections foresee headline inflation being subject to some volatility in the coming months, but gradually increasing over the projection horizon. The baseline projections point to headline HICP inflation averaging 1.5% in 2021, 1.2% in 2022 and 1.4% in 2023 (Chart 17). Compared with the December 2020 Eurosystem staff macroeconomic projections, the projection for HICP inflation was revised up for 2021 and 2022, but remained unchanged for 2023. The upward revision in 2021 reflects an upward revision of HICP energy inflation as well as the impact of the temporary factors explaining the recent upswing in inflation. Over the medium term, as the impact of temporary factors drops out of the annual rates, inflation is expected to fall back to 1.0% at the beginning of 2022, before increasing gradually to 1.4% in 2023. HICP inflation excluding energy and food is expected to be 1.0% in 2021 and 1.1% in 2022, before increasing to 1.3% in 2023. The effects of the US fiscal package on euro area HICP inflation are expected to be moderate, with a cumulative impact of about 0.15 percentage points over the projection horizon.[10]
Chart 17
Euro area HICP inflation (including projections)
(annual percentage changes)

Sources: Eurostat and the article entitled “ECB staff macroeconomic projections for the euro area, March 2021”, published on the ECB’s website on 11 March 2021.
Notes: The vertical line indicates the start of the projection horizon. The latest observations are for the fourth quarter of 2020 (data) and the fourth quarter of 2023 (projections). The cut-off date for data included in the projections was 16 February 2021.
5 Money and credit
Monetary dynamics in the euro area continued to reflect the implications of the coronavirus (COVID-19) pandemic. In January money growth stabilised at robust levels, reflecting the continued demand for liquidity by firms and households. Domestic credit remained the dominant source of money creation, with Eurosystem purchases being the most prominent contributor. The timely and sizeable measures taken by monetary, fiscal and supervisory authorities continued to support the flow of credit to the euro area economy at favourable terms. The total external financing volumes of firms continued to level off in the fourth quarter of 2020. The overall cost of external financing of firms has levelled off since October 2020, as the cost of market-based debt and equity has moderated, while bank lending rates have remained stable.
Broad money growth stabilised at robust levels in January. Monetary dynamics continued to reflect the COVID-19 pandemic, which has triggered an exceptional preference for liquidity. The annual growth rate of the broad monetary aggregate M3 stood at 12.5% in January, after 12.4% in December 2020 (Chart 18). The annual growth rate of the most liquid monetary aggregate, M1, which comprises overnight deposits and currency in circulation, accelerated further to 16.4% in January, after 15.6% in December, thus strongly contributing to M3 growth. These developments reflect not only the liquidity positions being built up by firms and households amid continuing heightened uncertainty, but also – in the case of households – some forced savings owing to reduced opportunities to consume. The strong growth in money was also the result of sizeable support measures taken by the ECB and supervisory authorities, as well as by national governments, to ensure that sufficient liquidity is provided to the economy to address the economic consequences of the pandemic.
Chart 18
M3, M1 and loans to the private sector
(annual percentage changes; adjusted for seasonal and calendar effects)

Source: ECB.
Notes: Loans are adjusted for loan sales, securitisation and notional cash pooling. The latest observations are for January 2021.
Overnight deposits continued to be the main contributor to M3 growth. The annual growth rate of overnight deposits increased to 17.1% in January, after 16.3% in December. Money holders’ preference for overnight deposits reflected precautionary motives and the very low level of interest rates, which reduces the opportunity cost of holding such instruments. The growth in deposits was mainly driven by holdings of firms and households. In the case of firms, growth in deposit holdings varied across countries, reflecting differences in the liquidity needs of firms and support measures provided by national governments. The annual growth rate of currency in circulation increased from 11.3% in December to 12.3% in January. By comparison, other short-term deposits and marketable instruments continued to make a modest contribution to annual M3 growth, mirroring the low level of interest rates and the search-for-yield behaviour of investors.
Domestic credit remained the main source of money creation, with Eurosystem purchases being the most prominent contributor. Since October 2020, the Eurosystem’s net purchases of government securities under the ECB’s asset purchase programme (APP) and pandemic emergency purchase programme (PEPP) have been the largest contributor to M3 growth (the red portion of the bars in Chart 19). Credit growth to the private sector, which made a sizeable but decreasing contribution to M3 growth, was the second largest contributor (the blue portion of the bars in Chart 19). The flow of credit from the banking sector (excluding the Eurosystem) to the public sector has moderated over recent months (the light green portion of the bars in Chart 19). Net external monetary flows were broadly balanced in 2020 (the yellow portion of the bars in Chart 19), while longer-term financial liabilities and other counterparts had a negative impact on money growth (the dark green portion of the bars in Chart 19). This was mainly due to developments in other counterparts, in particular repurchase agreements, while favourable conditions for targeted longer-term refinancing operations (TLTROs) continued to support banks’ funding substitution, resulting in net redemptions in long-term bank bonds.
Chart 19
M3 and its counterparts
(annual percentage changes; contributions in percentage points; adjusted for seasonal and calendar effects)
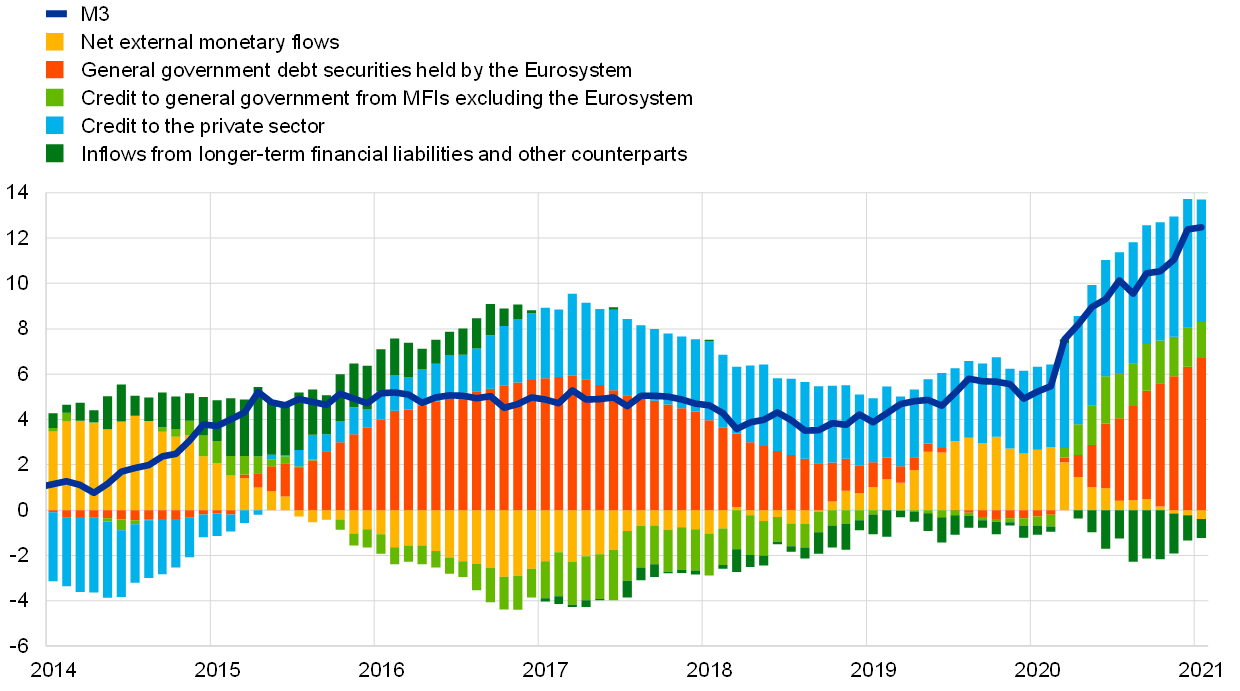
Source: ECB.
Notes: Credit to the private sector includes monetary financial institution (MFI) loans to the private sector and MFI holdings of debt securities issued by the euro area private non-MFI sector. As such, it also covers purchases by the Eurosystem of non-MFI debt securities under the corporate sector purchase programme and the PEPP. The latest observations are for January 2021.
Loan growth to the private sector moderated. The annual growth rate of monetary financial institution (MFI) loans to the private sector decreased to 4.5% in January, after 4.7% in December, but remained well above its pre-pandemic level (Chart 18). The annual growth rate of loans to firms stood at 7.0% in January, after 7.1% in December, while growth in loans to households decreased from 3.1% to 3.0% during this period (Chart 20). Shorter-term dynamics in loans to firms continued their moderation, with the monthly lending flow turning slightly negative in January, reflecting the previous build-up of liquidity buffers, low loan demand for investment purposes, and early signs of tightening pressure on the supply of credit. Firms’ reliance on longer-term loans has continued to increase at the expense of shorter-term loans.
Chart 20
MFI loans in selected euro area countries
(annual percentage changes)
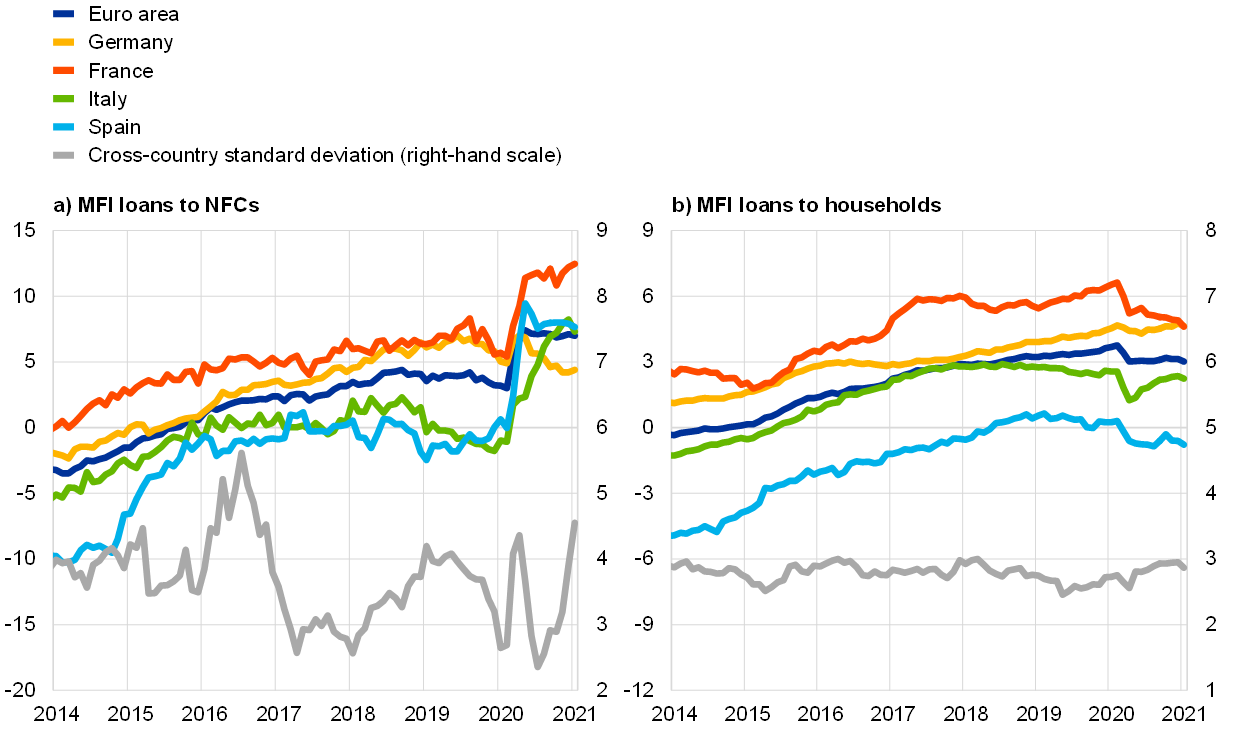
Source: ECB.
Notes: Loans are adjusted for loan sales and securitisation; in the case of non-financial corporations (NFCs), loans are also adjusted for notional cash pooling. The cross-country standard deviation is calculated using a fixed sample of 12 euro area countries. The latest observations are for January 2021.
Total lending to households also moderated. While loans to households for house purchase have remained broadly stable since September 2020, with annual growth at 4.5% in January, consumer credit continued its sharp decline, the beginning of which coincided with the start of the pandemic (Chart 21). The annual growth rate of consumer credit declined to -2.5% in January, after -1.7% in December. The strong decrease in this loan type is related to the intensification of lockdown measures since November 2020. In contrast, the annual growth of other lending to households stood at 1.3% in January, after 1.5% in December. Despite some improvement since May 2020, development in this loan category, which was largely explained by lending to small firms (sole proprietors and unincorporated partnerships), has remained subdued. While small firms were particularly affected by the slowdown in economic activity, they also benefited from government support to meet their financing needs.
Chart 21
MFI loans to households by purpose
(annual percentage changes; adjusted for seasonal and calendar effects)

Source: ECB.
Notes: The series for total loans to households is adjusted for loan sales and securitisation. The latest observation is for January 2021.
In the euro area, household gross indebtedness, calculated as total debt over disposable income, has increased further in recent quarters and has significantly exceeded its pre-pandemic level. While this development mirrors the economic consequences of the pandemic, which has tended to compress disposable income, there was heterogeneity across countries. At the same time, the household saving rate increased steeply, reflecting a combination of forced savings owing to lower consumption caused by the shutdowns and precautionary savings following the slump in consumer confidence and heightened uncertainty.
Banks have continued to benefit from favourable funding conditions, while increased credit risk is weighing on their balance sheets and profitability. The composite cost of debt financing for euro area banks remained below its pre-pandemic level, also owing to monetary policy support (Chart 22). The ECB’s APP and PEPP have put downward pressure on yields and banks partly replaced market-based funding with TLTROs at very favourable conditions. Both factors also supported market conditions for bank bonds. Moreover, prices for covered bank bonds are being directly supported by the ECB’s third covered bond purchase programme (CBPP3). In addition, deposit rates of euro area banks, which account for the majority of bank funding, remained unchanged at historical lows in January 2021, thereby contributing to favourable bank debt funding conditions amid the effective pass-through of negative rates. Indeed, euro area banks have increasingly charged negative interest rates on non-financial corporation (NFC) deposits held with them since the onset of the COVID-19 crisis. At the same time, a large part of banks’ deposit funding, in particular retail deposits, tends to remain at or above zero, which compresses their net interest margins. The prospect of credit losses owing to the deterioration in borrowers’ creditworthiness and low bank profitability is likely to weigh on banks’ intermediation and loss-absorption capacity. As shown by the January 2021 euro area bank lending survey, banks tightened their credit standards again in the fourth quarter of 2020, reflecting their heightened risk perception as a result of the pandemic.
Chart 22
Composite cost of debt financing of banks
(composite cost of deposit and unsecured market-based debt financing; percentages per annum)

Sources: ECB, Markit iBoxx and ECB calculations.
Notes: The composite cost of deposits is calculated as an average of new business rates on overnight deposits, deposits with an agreed maturity and deposits redeemable at notice, weighted by their corresponding outstanding amounts. Bank bond yields refer to monthly averages of senior-tranche bonds. The latest observations are for January 2021.
Bank lending rates remained stable at levels close to their historical lows. In December, composite bank lending rates for loans to firms stood at 1.51%, while those for loans to households for house purchase fell to a new historical low of 1.33% (Chart 23). This development was widespread across euro area countries. However, the spread between bank lending rates on very small loans and those on large loans widened, while remaining below pre-pandemic levels. There are concerns that the severe and protracted economic impact of the pandemic on firms’ revenues, households’ employment prospects and overall borrower creditworthiness will put upward pressure on bank lending rates. Two factors explain the benign reaction of bank lending rates to the pandemic thus far. First, the measures taken by the ECB, bank supervisors and governments have offset the procyclical impact of the pandemic shock on credit supply. In this respect, the TLTROs will continue to contribute to downward pressure on lending rates. Second, bank lending rates tend to be less responsive in the short term as banks temporarily absorb fluctuations in their cost components in an effort to maintain client relationships.
Chart 23
Composite bank lending rates in selected euro area countries
(percentages per annum; three-month moving averages)

Source: ECB.
Notes: The indicator for the total cost of bank borrowing is calculated by aggregating short and long-term rates using a 24-month moving average of new business volumes. The cross-country standard deviation is calculated using a fixed sample of 12 euro area countries. The latest observations are for January 2021.
The total external financing volumes of firms continued to level off in the fourth quarter of 2020. The annual growth of external financing has increased slightly further in recent months, up to 4.5% in December 2020, while shorter-term financing dynamics continued to decline from the peak observed in the summer of 2020 (panel (a) of Chart 24). This development is explained by lower growth in bank lending to NFCs and firms’ reduced net issuance of debt securities. Meanwhile, net issuance of listed and unlisted shares was broadly stable. The slowdown mostly reflected two factors: first, firms built up sizeable liquidity buffers in the first wave of the pandemic, thus reducing the need for additional emergency borrowing; second, firms’ immediate financing needs declined, owing to the postponement of planned fixed investment amid the worsening outlook for short-term growth. At the same time, external financing flows continued to benefit from favourable financing conditions. The overall nominal cost of external financing for NFCs, comprising bank lending, debt issuance in the market and equity finance, stood at 4.4% at the end of January (panel (b) of Chart 24). This level was around 60 basis points lower than the March 2020 local peak and 20 basis points higher than the historical low in June 2020. Since end-October 2020, the overall cost of financing has declined by around 20 basis points, mostly on account of the lower cost of market-based debt and equity. The long-term cost of bank lending has also declined by several basis points. Between the end of January and the end of the reference period (10 March 2021), the overall cost of financing is estimated to have remained stable as a slight increase in the cost of market-based debt, resulting from a higher risk-free rate and only marginally declining corporate bond spreads, was offset by a decline in the cost of equity.
Chart 24
External financing of euro area NFCs
(percentage changes – panel (a); percentages per annum – panel (b))
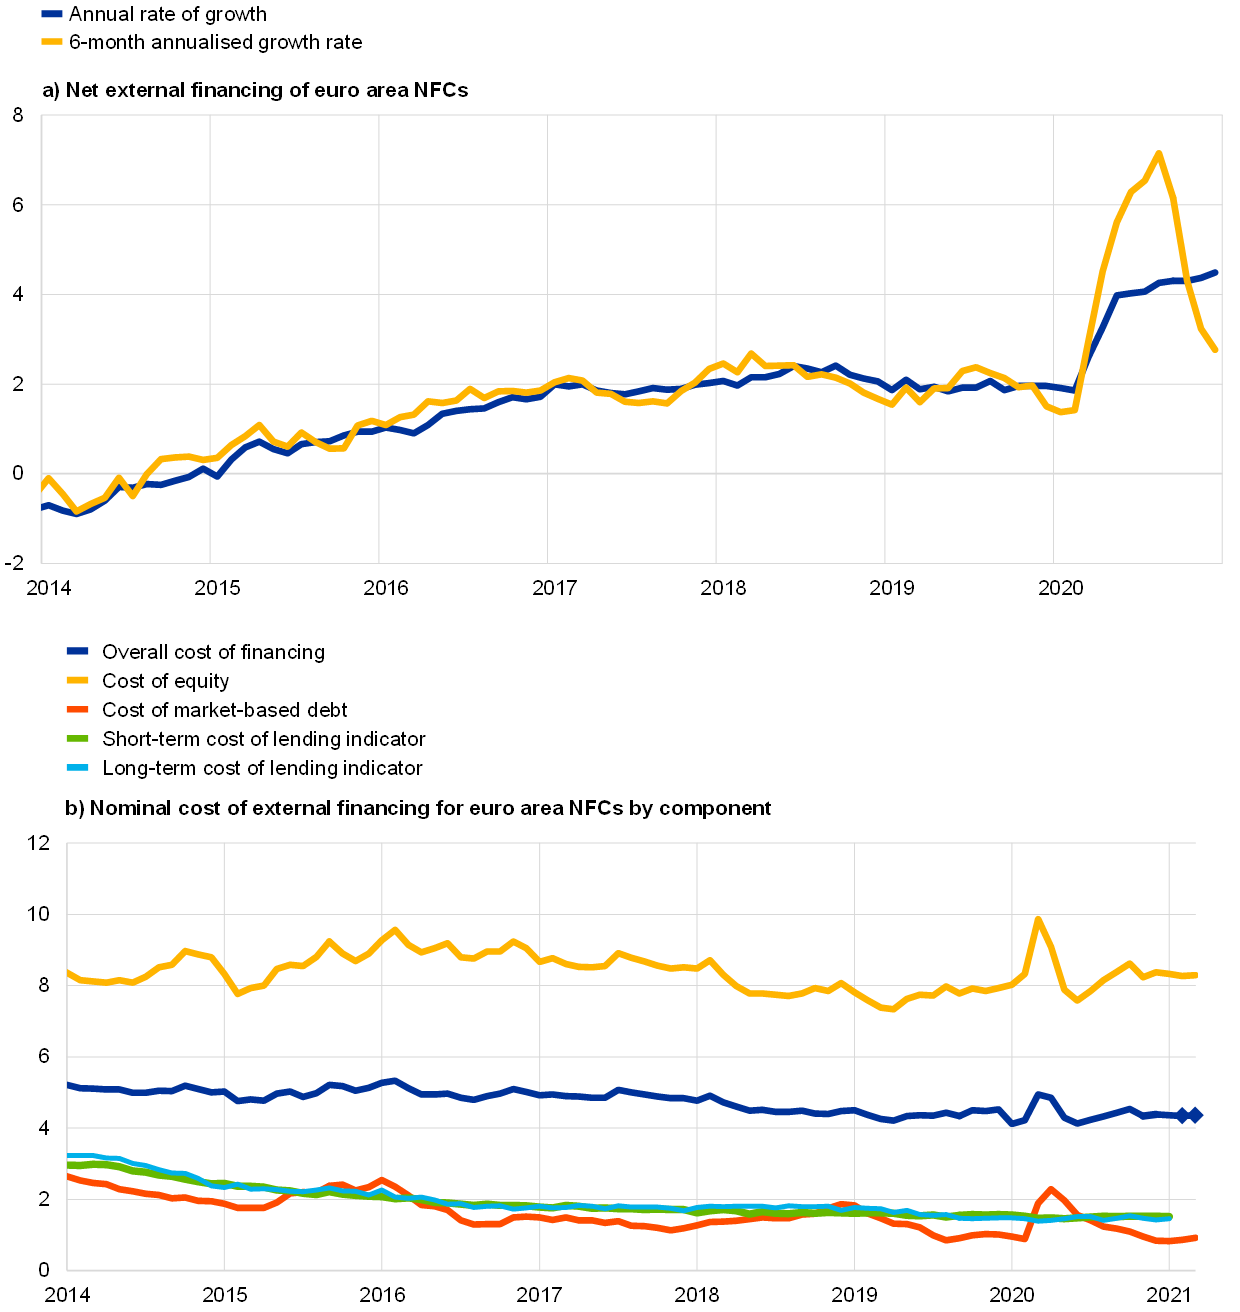
Sources: Eurostat, Dealogic, ECB, Merrill Lynch, Bloomberg, Thomson Reuters and ECB estimates.
Notes: Panel (a) – Net external financing is the sum of MFI loans, net issuance of debt securities and net issuance of listed shares. MFI loans are adjusted for sales, securitisation and cash pooling activities. Panel (b) – The overall cost of financing for NFCs is calculated as a weighted average of the costs of bank borrowing, market-based debt and equity, based on their respective amounts outstanding. The dark blue diamonds indicate the nowcasts of the overall cost of financing for February 2021 and March 2021, assuming that bank lending rates remain unchanged at their January 2021 levels. The latest observations for panel (a) are for December 2020. The latest observations for panel (b) are for 10 March 2021 for the cost of market-based debt (monthly average of daily data), 5 March 2021 for the cost of equity (weekly data) and January 2021 for the cost of lending (monthly data).
6 Fiscal developments
As a result of the very sharp economic downturn during the coronavirus (COVID-19) pandemic and the strong fiscal reaction, the general government budget deficit in the euro area is estimated to have increased to 7.2% of GDP in 2020, from 0.6% in 2019. Thereafter, the March 2021 ECB staff macroeconomic projections see the deficit ratio declining to 6.1% of GDP in 2021 and to 2.4% at the end of the projection horizon in 2023. Even though this path would increase the euro area general government debt ratio to around 95% of GDP in 2023, i.e. about 11 percentage points higher than before the crisis, the fiscal position is likely to be somewhat less affected than was generally expected in the initial phase of the pandemic. Still, an ambitious and coordinated fiscal stance will remain critical. To this end, support from national fiscal policies should continue, given weak demand from firms and households amid the ongoing pandemic and the associated containment measures. As a complement, the Next Generation EU (NGEU) package will play a key role by contributing to a faster, stronger and more uniform recovery. It will increase economic resilience and the growth potential of EU economies, particularly if the funds are deployed for productive public spending and accompanied by productivity-enhancing structural policies.
According to the March 2021 ECB staff macroeconomic projections, the euro area general government budget balance deteriorated strongly in 2020 but is projected to improve gradually thereafter.[11] The general government deficit ratio for the euro area is estimated to have increased from 0.6% of GDP in 2019 to 7.2% of GDP in 2020, and projected to decline to 6.1% in 2021 and further to 3.1% and 2.4% in 2022 and 2023 respectively (see Chart 25). The rise in the budget deficit in 2020 is to a large extent attributable to a deterioration in the cyclically adjusted primary balance on the back of economic support measures amounting to around 4¼% of GDP. The largest part of this was additional spending, particularly in the form of transfers and subsidies to firms and households, including through short-time work or furlough schemes. The deficit increase is also the result of a large negative cyclical component, in line with a sharp drop in output in the euro area.[12] The subsequent improvement in the budget balance is projected to be driven initially by a recovery in the cyclically adjusted primary balance, as part of the emergency measures is projected to have a lower cost than in 2020 and additional recovery measures will be funded by NGEU grants.[13] In 2021, governments have prolonged emergency measures in the light of the new round of lockdown restrictions, expanded their size and/or adopted new support measures, estimated to total 3¼% of GDP. Lower interest payments and an improvement in the cyclical component also contribute to the improved budget balance projected for 2021. However, the contribution from the economic cycle is expected to improve significantly from 2022 only, and should remain negative throughout the projection horizon. As most of the additional pandemic-related emergency measures approved for 2021 are temporary and expected to be reversed, they contribute to the improvement in the cyclically adjusted primary balance in 2022.
Chart 25
Budget balance and its components
(percentages of GDP)
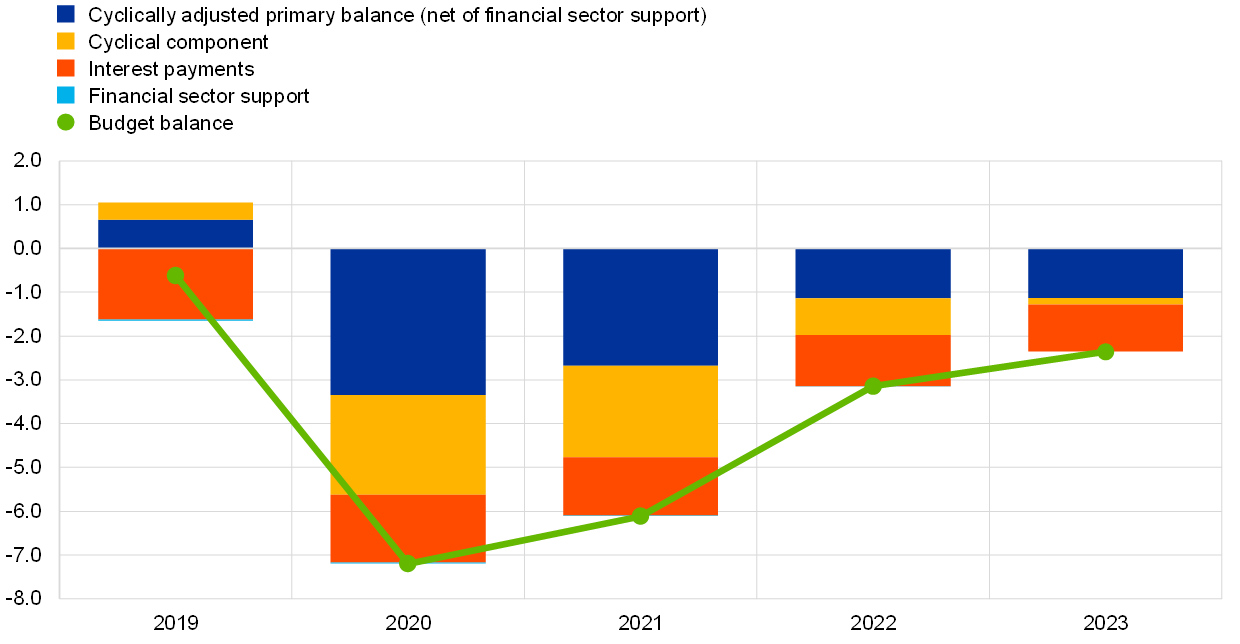
Sources: ECB and March 2021 ECB staff macroeconomic projections.
Note: The data refer to the aggregate general government sector of the euro area.
These fiscal projections are, however, surrounded by exceptional uncertainty, not least as regards the size, timing and composition of NGEU spending but also more generally, as economic policies react as the pandemic evolves.
The aggregate fiscal stance was highly expansionary in 2020 and should be broadly neutral in 2021 after adjusting for the expected revenue-increasing impact of countries’ receipt of NGEU grants. The fiscal stance is estimated to have been highly accommodative, at 4.2% of GDP, in 2020. In 2021 it is still projected to be broadly neutral, after adjusting for NGEU grants on the revenue side.[14] The expected tightening of the fiscal stance from very high levels of support will thus be postponed to 2022 (amounting to 1.5 percentage points of GDP), followed by neutral developments in 2023 in a no-policy change scenario building upon the measures taken into account in the projections. This notwithstanding, the level of fiscal support to the economic recovery remains large over the projection horizon, as reflected by the overall primary fiscal balance remaining substantially negative, improving only gradually to -1.3% of GDP in 2023.
In addition to the fiscal support for their economies, euro area countries have provided sizeable loan guarantee envelopes to bolster the liquidity position of firms. In total, these guarantees amounted to around 17% of GDP for the euro area as a whole in 2020 and are expected to continue providing liquidity support into the current year, with the size of the envelopes and take-up rates differing substantially across countries. The loan guarantees are contingent liabilities for governments and any amount of guarantees called on will therefore constitute additional public spending that raises government debt.
The budget balance in 2020 is estimated to have been better than previously projected but the outlook for 2021 has not been revised. Compared with the December 2020 Eurosystem staff macroeconomic projections, the euro area general government budget balance as a share of GDP has been revised up by 0.8 percentage points for 2020. This is mainly due to discretionary fiscal measures in response to the pandemic being slightly smaller than initially foreseen and revisions in other spending and non-discretionary factors (as captured by a less negative cyclically adjusted balance), as well as to a slightly less negative impact of the economic cycle. The balance in 2021 is unrevised, with a somewhat more favourable impact of the business cycle offsetting the additional budgetary costs of higher emergency spending (as captured by the downward revision of the cyclically adjusted primary balance). For 2022 and 2023, the balance has been revised up significantly owing to more favourable projected contributions from both the economic cycle and the cyclically-adjusted primary balance.The euro area aggregate public debt-to-GDP ratio increased strongly in 2020 and is projected to peak at around 98% in 2021, before declining gradually to about 95% in 2023. Debt ratio increases of 12.9 and 1.3 percentage points in 2020 and 2021, respectively, largely reflect high primary deficits and, in 2020, very adverse interest-growth differentials. In 2020, the increase is also attributable to a significant deficit-debt adjustment due to policy measures related to the pandemic such as liquidity support to firms and households. In 2022 and 2023, declining but still significant primary deficits are more than offset by favourable contributions from improving interest-growth differentials, as economic activity is projected to recover (see Chart 26). As a result, at the end of the projection horizon in 2023, the debt-to-GDP ratio is seen standing around 11 percentage points above its pre-crisis level of 84% in 2019. It should, however, be noted that the crisis has had a somewhat smaller adverse impact on the fiscal position than was generally expected in the initial phase of the crisis. For instance, in the June 2020 Eurosystem staff macroeconomic projections, the debt-to-GDP ratio was seen peaking at a level over 3 percentage points higher than in the latest ECB staff projections.
Chart 26
Drivers of change in public debt
(percentage points of GDP)

Sources: ECB and March 2021 ECB staff macroeconomic projections.
Note: The data refer to the aggregate general government sector of the euro area.
A continued coordination of fiscal policy remains critical to ensure that the euro area moves into a sustained recovery phase. To contain the impact on countries’ underlying fiscal positions, fiscal measures should remain, as far as possible, temporary in nature and should be made still more targeted to contain permanent scarring effects on the euro area economy. Fiscal sustainability will be helped by the recovery expected in 2021, especially once COVID-19 vaccines are progressively rolled out to a larger share of the population, but importantly also by financing conditions which should continue to be supportive. It remains essential, though, that Member States gradually reduce budgetary imbalances once economic activity has sufficiently recovered. This process can be amplified by a decisive shift towards a growth-friendlier composition of public finances and structural reforms that raise the growth potential of euro area economies. The NGEU’s Recovery and Resilience Facility can provide important support in this respect, not least by accelerating the green and digital transitions.
Boxes
1 Economic developments in the euro area and the United States in 2020
The coronavirus (COVID-19) pandemic has profoundly affected both Europe and the United States. Despite the pandemic reaching the United States later than the euro area and US population density being lower, the number of new COVID-19 cases has generally been higher in the United States than in the euro area, particularly so from mid-November 2020 to the end of February 2021. This higher incidence of infection in the United States may reflect the effectiveness of lockdown policies as measured by Goldman Sachs’ Effective Lockdown Index (ELI) (Chart A).[15] To the extent that the United States was subject to fewer restrictions than the euro area, the short-term responsiveness of the economy to policy stimulus was also likely greater. Against this background, the box compares economic developments in the euro area and the United States, focusing on 2020.
More2 The euro area capital stock since the beginning of the COVID-19 pandemic
This box examines the latest developments in the euro area stock of capital and its main drivers. More specifically, it discusses the role played by investment and the depreciation and retirement of fixed assets in explaining capital stock developments. It also shows the extent to which recent developments are similar to those experienced during the great financial crisis and the subsequent euro area sovereign debt crisis.[16] The analysis relies primarily on European Central Bank (ECB) quarterly estimates of capital stock, which are based on a constrained optimisation model using annual data from Eurostat (with a lag of two years) and temporal disaggregation techniques.[17] Therefore, especially the recent data and analysis should be considered with caution and may be subject to significant revisions in the future.
More3 Liquidity conditions and monetary policy operations from 4 November 2020 to 26 January 2021
This box describes the ECB’s monetary policy operations and liquidity developments during the seventh and eighth reserve maintenance periods of 2020. Together these two maintenance periods ran from 4 November 2020 to 26 January 2021 (the “review period”). On 10 December, the Governing Council of the ECB introduced a number of policy adjustments. It decided to increase the envelope of the pandemic emergency purchase programme (PEPP) by €500 billion, to a total of €1,850 billion, and to extend its time horizon by nine months, to at least the end of March 2022. In addition, three additional targeted long-term refinancing operations (TLTRO III) were offered and the period over which considerably more favourable terms apply was extended by twelve months, to June 2022. For a comprehensive overview of the measures refer to the eighth issue of the Economic Bulletin 2020.
More4 The impact of containment measures across sectors and countries during the COVID-19 pandemic
The measures enacted to contain the coronavirus (COVID-19) pandemic had a varied impact on economic activity across sectors and countries in the euro area in 2020. The bans on public events, strict lockdowns and restrictions on numerous activities in the spring of 2020 had a dramatic effect on the economy, with euro area GDP declining by 15% in the first half of the year. Since then, both public authorities and households and firms have learned how best to respond to more targeted containment measures to alleviate their economic impact. However, there is still significant uncertainty about the evolution of the pandemic, the containment measures and the associated economic effects. Against this background, this box explores the heterogenous economic impact of COVID-19 containment measures across sectors and across the five largest euro area countries, and also studies how this impact has changed over time.[18]
More5 The role of profit margins in the adjustment to the COVID-19 shock
Profit margins are an integral part of domestic price setting and have had an impact on the response of euro area inflation to the coronavirus (COVID-19) shock. Growth in the GDP deflator remained robust in the first half of 2020, despite the sharp fall in economic activity. This box illustrates that developments in profit margins in terms of unit profits (i.e. gross operating surplus per unit of GDP) have been exceptional during the crisis, including in comparison to past recessions, and have shaped GDP deflator-based inflation developments. The box also elaborates on likely sources of the unusual profit margin response and examines developments in more granular profit indicators in main institutional sectors since the start of the crisis.
More6 2021 HICP weights and their implications for the measurement of inflation
The coronavirus (COVID-19) pandemic and the resulting lockdown measures have triggered extraordinary changes in consumption patterns since early 2020. Households increased their relative expenditure share of certain categories in the HICP basket at the expense of others. This box discusses these changes in consumption and their implications for inflation measurement.
More7 Towards an effective implementation of the EU’s recovery package
While the coronavirus (COVID-19) pandemic is a common shock affecting all euro area countries, its economic impact has not been uniform. The decline in real GDP between the fourth quarter of 2019 and the second quarter of 2020, which corresponds to the peak-to-trough change in most countries, varied between 5% and 22% across euro area countries (Chart A).[19] The heterogeneous fallout from the COVID-19 shock reflects differences across countries in public health dynamics and containment measures, as well as economic factors such as the sectoral specialisation of the economy, the resilience of labour and product markets, and varying degrees of fiscal space.[20] According to projections by European and international institutions, there is a risk that growth differentials will persist during the recovery phase and impair income convergence in the euro area in the medium term.
MoreArticles
1 Monetary policy and inequality
The issue of economic inequality began to receive increased attention after the global financial crisis. During that period, the increase in unemployment, the heterogeneous evolution of house and stock prices, and the fall in interest rates all affected households in very different ways. Income and wealth inequality has risen in most advanced economies since the early 1980s, with some countries now seeing levels comparable to those recorded at the start of the 20th century, raising increasing concerns regarding the political and economic consequences of that trend.[21]
More2 Making sense of consumers’ inflation perceptions and expectations – the role of (un)certainty
Understanding households’ inflation expectations is important for monetary policymakers
Inflation expectations play a key role in the monetary transmission mechanism. Other things being equal, when economic agents anticipate that inflation will increase, they perceive the real interest rate to fall. As a result, they spend more and save less to optimise their consumption and investment over a long horizon. Inflation expectations also play an important role in the wage and price-setting process and are thus an important determinant of future inflation. Therefore, understanding the nature of economic agents’ inflation expectations and how they are formed is crucial for monetary policymakers.[22]
More3 The paradox of banknotes: understanding the demand for cash beyond transactional use
A phenomenon referred to as the “paradox of banknotes”[23] has been observed in the euro area; in recent years, the demand for euro banknotes has constantly increased while the use of banknotes for retail transactions seems to have decreased. Recent payment surveys indicate that the share of cash transactions in the euro area has decreased. This, together with ongoing digitalisation in retail payments, might have been expected to lead to a decrease in the demand for cash.[24] However, this reduction in demand has not occurred. In fact, the number of euro banknotes in circulation has increased since 2007 (see Chart 1). This seemingly counterintuitive paradox can be explained by demand for banknotes as a store of value in the euro area (e.g. euro area citizens holding cash savings) coupled with demand for euro banknotes outside the euro area. This article will use the available evidence to explain this phenomenon in more detail.
MoreStatistics
Statistical annex© European Central Bank, 2021
Postal address 60640 Frankfurt am Main, Germany
Telephone +49 69 1344 0
Website www.ecb.europa.eu
All rights reserved. Reproduction for educational and non-commercial purposes is permitted provided that the source is acknowledged.
This Bulletin was produced under the responsibility of the Executive Board of the ECB. Translations are prepared and published by the national central banks.
The cut-off date for the statistics included in this issue was 10 March 2021.
For specific terminology please refer to the ECB glossary (available in English only).
ISSN 2363-3417 (html)
ISSN 2363-3417 (pdf)
QB-BP-21-002-EN-Q (html)
QB-BP-21-002-EN-N (pdf)
- For a comparison of the economic performance of the United States and the euro area during the pandemic, see Box 1 entitled "Economic developments in the euro area and the United States in 2020" in this issue of the Economic Bulletin.
- For further details, see the box entitled “Risks to the global and euro area outlook related to the American Rescue Plan” in the ECB staff macroeconomic projections for the euro area, March 2021.
- For further details, see the box entitled “Alternative scenarios for the euro area economic outlook” in the ECB staff macroeconomic projections for the euro area, March 2021.
- The methodology for calculating the EONIA changed on 2 October 2019; it is now calculated as the €STR plus a fixed spread of 8.5 basis points. See the box entitled “Goodbye EONIA, welcome €STR!”, Economic Bulletin, Issue 7, ECB, 2019.
- See Box 4 of the article entitled “ECB staff macroeconomic projections for the euro area, March 2021”, which was published on the ECB’s website on 11 March 2021.
- However, this impact will change across the year and was estimated at 0.1 percentage points in February. For more information, see the box entitled “HICP weights in 2021 and their implications for inflation” in this issue of the Economic Bulletin. The impact of the weight change can only be reliably estimated with the full release.
- For a description of exclusion-based and model-based measures of underlying inflation, see the article entitled “Measures of underlying inflation for the euro area”, Economic Bulletin, Issue 4, ECB, 2018.
- Producer price inflation for intermediate goods increased to 0.9% in January, from -0.1% in the previous month, while import price inflation for intermediate goods increased to 0.1% from -0.8% over the same period.
- Job retention schemes are also likely to have contributed to the resilience of profit margins. Even though profit margins deteriorated somewhat in the fourth quarter, they remained resilient relative to the depth of the recession. See the box entitled “The role of profit margins in the adjustment to the COVID-19 shock” in this issue of the Economic Bulletin.
- For more details, see Box 4 in the article entitled “ECB staff macroeconomic projections for the euro area, March 2021” on the ECB’s website.
- See the “ECB staff macroeconomic projections for the euro area, March 2021”, published on the ECB’s website on 11 March 2021.
- It should be noted that there is at present an unusually high degree of uncertainty surrounding the breakdown of budget developments into cyclical and trend components.
- Additional fiscal recovery measures amounting to about 0.5% of GDP for 2021 (broadly maintained over the projection horizon) will be funded by NGEU grants, which improve the revenue side of the government budget of the EU country beneficiaries. The overall impact on the budget balance will be neutral in the years when grants are disbursed, as there will be a counterbalancing effect of higher expenditure. These grants provide a further fiscal stimulus compared with 2020.
- The fiscal stance reflects the direction and size of the stimulus from fiscal policies to the economy, beyond the automatic reaction of public finances to the business cycle. It is measured here as the change in the cyclically adjusted primary balance ratio net of government support to the financial sector. The fiscal stance needs to be adjusted to account for the impact of NGEU grants on the revenue side (see also the previous footnote). For more details on the concept of the euro area fiscal stance, see the article entitled “The euro area fiscal stance”, Economic Bulletin, Issue 4, ECB, 2016.
- See Aron, J. and Muellbauer, J. “The US excess mortality rate from COVID-19 is substantially worse than Europe’s”, VoxEU, 29 September 2020.
- In this box, the focus is on both public and private capital stock. However, most of the euro area capital stock and investment are made up of private assets (about 85% for both investment and capital stock).
- See Hofmeister, Z. and van der Helm, R., “Estimating non-financial assets by institutional sector for the euro area”, Statistics Paper Series, No 23, ECB, May 2017. The methodology is mainly based on a temporal disaggregation of the annual capital stock using quarterly Gross Fixed Capital Formation (GFCF) as a quarterly profile indicator. The temporal disaggregation is applied at the first difference of the annual capital stock; the resulting quarterly capital stock (including the forecasted most recent quarters) is subsequently balanced as required to ensure balanced asset by sector matrix. Regarding the cases where annual data for capital stock is not available given its two-year publication lag, these annual figures are derived using a Permanent Inventory Method (PIM) or the so called “capital accumulation equation”. The coefficients for the most recent years, where not available, are extrapolated based on past developments, “inverse” PIM, or expert information.
- The analysed sectors cover the whole economy, namely: agriculture (NACE Rev. 2 classification: A); other industry (B, D and E); manufacturing (C); construction (F); trade, transport, accommodation and food (G, H and I); information and communication (J); finance and insurance (K); real estate (L); professional and technical (M and N); public administration (O, P and Q); and arts and entertainment (R, S, T and U).
- Similar heterogeneity can be observed in the employment response to the COVID-19 shock. See the article entitled “The impact of the COVID-19 pandemic on the euro area labour market”, Economic Bulletin, Issue 8, 2020.
- The COVID-19 crisis has also aggravated macroeconomic vulnerabilities in euro area countries, as documented by the European Commission in its most recent Alert Mechanism Report. In particular, the report points to increased public and private indebtedness, subdued growth prospects and corporate sector weaknesses. See European Commission, “Alert Mechanism Report 2021”, November 2020.
- See Piketty, T., Capital in the Twenty-First Century, Harvard University Press, 2013. Differences in income and wealth are typically correlated with various economic characteristics (such as people’s level of education, professional experience and skills). However, those economic characteristics are not the only drivers of economic inequality. People’s income and wealth are also correlated with various sociological characteristics (such as their age, gender, race, marital status and religion). In addition, public policies (e.g. as regards tax, education, housing and urbanisation) and social norms (e.g. discrimination) interact with those economic and sociological characteristics. Thus, the drivers of inequality are manifold and lie at the intersection of economics, sociology and public policy.
- See, for example, Draghi, M., Introductory Statement, European Central Bank, 22 October 2015 and Yellen, J., "Comments on Monetary Policy at the Effective Lower Bound", Brookings Papers on Economic Activity, Economic Studies Program, The Brookings Institution, Vol. 49, No 2, Fall, 2018, pp. 573-579.
- This phenomenon has also been observed with other currencies, particularly those with a strong foreign demand; the term was coined in Bailey, A., “Banknotes in Circulation: Still Rising: What does this Mean for the Future of Cash?”, Speech at the Banknote 2009 Conference, Washington DC, 2009.
- For simplicity, specific references to coins (2% of euro cash value) are not made throughout this article.