
Labour supply developments in the euro area during the COVID-19 pandemic
Published as part of the ECB Economic Bulletin, Issue 7/2021.
In this box we look at what has contributed to the evolution of labour force participation during the pandemic, as well as its outlook. This is relevant from a policy perspective as a depressed participation rate over a prolonged period could point to scarring effects in the labour market, whereas a continued recovery may help to address existing labour shortages, contain emerging wage pressures and support the economic recovery overall.
Labour supply in the euro area remains adversely affected by the pandemic. The labour force participation rate, one of the main indicators of labour supply, in the euro area was 64.3% in the second quarter of 2021, up from its low of 62.9% in the second quarter of 2020 (Chart A).[1] But it was still about 0.6 percentage points below its pre-pandemic level in the fourth quarter of 2019, corresponding to roughly 1.4 million fewer workers in the labour force.[2] More recent but still preliminary monthly unemployment data for July and August suggest that the labour force recovered slightly in the third quarter of 2021.
Chart A
Labour supply in the euro area
(thousands; percentage of working age population)

Sources: Eurostat Integrated European Social Statistics and ECB staff calculations.
Recent labour force developments have tended to partly mirror the stringency of pandemic containment measures. Across the euro area, the numbers in the labour force fell sharply in the second quarter of 2020 (Chart B), predominantly due to declines in employment as the number of workers in unemployment decreased only marginally. However, the widespread support from job retention schemes is likely to have stemmed flows from employment into inactivity, preventing a much larger decline in the labour force. Some easing in the stringency of the containment measures in the third quarter of 2020 saw a quick but partial rebound in the labour force, although this was partly driven by an increase in unemployed workers. The stringency of containment measures subsequently continued to be mirrored somewhat in movements in the labour force, explaining a temporary further dip in the labour force numbers in the first quarter of 2021. These labour force developments were closely aligned with opposite movements in the numbers of discouraged workers, i.e. those who are available to work but are not seeking a job (e.g. because they think they would not find one) and are thus considered to be inactive. Such a close alignment of labour force and discouraged workers runs contrary to the pre-pandemic pattern and may be partly explained by the fact that the working age population remained broadly unchanged during the pandemic, whereas it had been increasing before then. Already before the pandemic, the growth of the working age population was projected to slow down because of population ageing, as the cohorts entering working age are smaller than the cohorts leaving it. [3] Net immigration to the euro area was expected to counterbalance this and keep the working age population increasing. However, based on the statistics on population by citizenship, the foreign population in the euro area has stopped increasing since the start of the pandemic crisis, while it was rising before. While limitations to statistics make it challenging to assess how migration was affected, there is some evidence that some foreign workers returned to their home countries.[4] As a result of a moderation in net immigration, the working age population flattened out in the last quarters.
Chart B
Labour force and discouraged workers in the euro area
(thousands, cumulative change since the fourth quarter of 2019)

Sources: Eurostat Integrated European Social Statistics and ECB staff calculations. Note: Series are seasonally adjusted.
Developments in labour supply have been quite heterogeneous across larger euro area countries during the pandemic. The number of workers in the labour force remains well below pre-pandemic levels in Germany and Italy; it is close to pre-pandemic levels in France and Spain and is noticeably higher in the Netherlands (Chart C). Such cross-country heterogeneity, which has also been reflected in the corresponding labour force participation rates, may reflect several factors. First, countries are at different stages of population ageing and the working age population is already decreasing in some countries (for example, Germany), while it is still increasing in others (for example, Spain). Second, the labour force participation rate differs considerably across demographic groups, meaning that a shift in the structure of the working age population can affect the aggregate labour force. The share of older cohorts has been rising in all euro area countries, but because of differences in levels across the shares of older (and other) cohorts in their populations, the impact of the rising trend on the labour force has been quite heterogeneous.[5] Finally, the impact of the pandemic on migrant workers and, in turn, on labour supply, was also heterogenous across countries.
Chart C
Labour force in the euro area and the largest euro area countries
(thousands, cumulative changes since the fourth quarter of 2019)
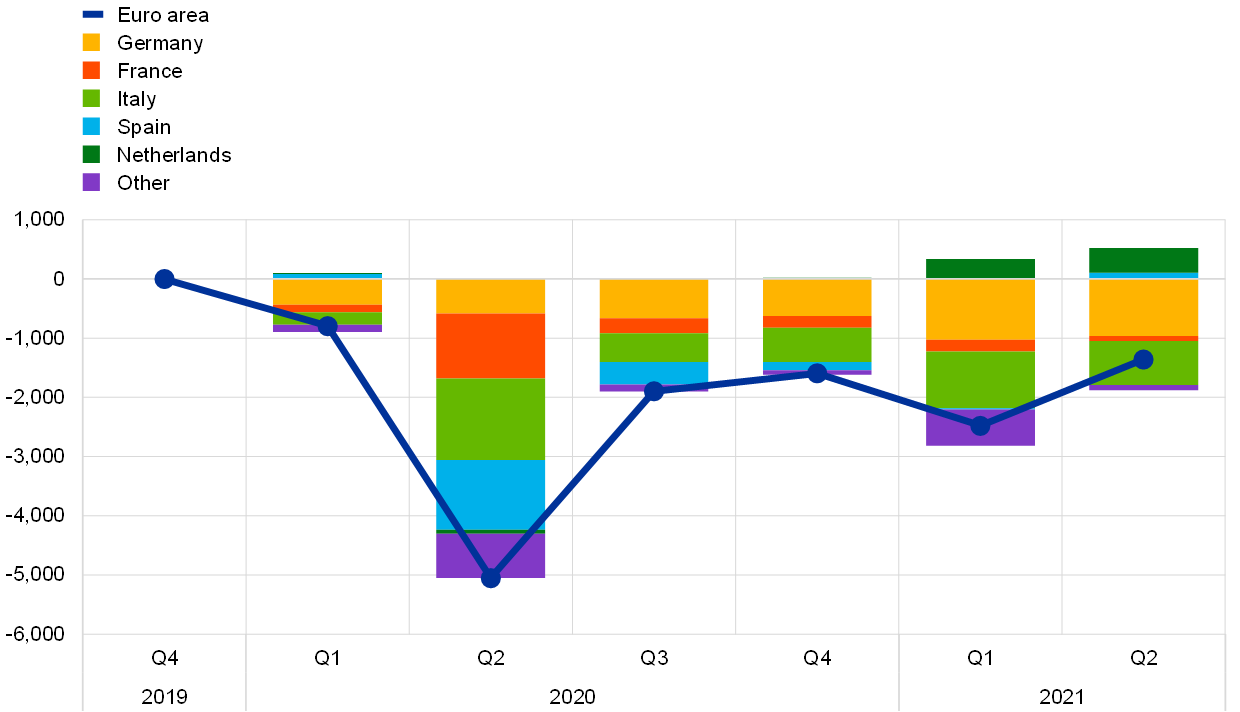
Sources: Eurostat Integrated European Social Statistics and ECB staff calculations.
Understanding how structural and cyclical drivers affect the labour force participation rate of the different demographic groups helps us to better assess the impact of the pandemic and prepare forecasts. The labour force participation rate of young workers and prime-age men showed the greatest correlation with the business cycle before the pandemic (Chart D, panel a). At the same time, the labour force participation rate of older workers and prime-age women was more independent from the business cycle. The labour force participation rate of those with a medium level of education strongly co-moved with GDP growth, whereas movements in the rates for those with higher and lower levels of education were less cyclical or a-cyclical. Structural drivers also differed. The labour force participation rate of older workers was trending upwards before the pandemic, reflecting their rising educational level and the effect of past pension reforms, among other factors.[6] At the same time, the labour force participation rate of prime-age women was also trending upwards, although less strongly.[7]
The coronavirus (COVID-19) shock affected some demographic groups’ labour force participation rate differently from what past cyclicality would suggest. The assessment, however, depends on the counterfactual scenario used, i.e. the assumption of what would have happened in the absence of the pandemic shock. Using counterfactual scenarios that take the pre-pandemic trends into consideration, the labour force participation rate gap – i.e. the difference between the observed labour force participation and the no-pandemic-shock counterfactual – is the widest for older workers and for workers with lower and medium levels of education, respectively (Chart D, panel b). The apparently strong effect of the shock on the labour force participation rate of older workers is not in line with past cyclical patterns. This reflects the special nature of the shock. Fear of infection may be one of the factors behind the findings for older workers.[8] By contrast, younger workers’ labour force participation rate may have benefited from labour shortages and less fear of infection at workplaces.[9]
Chart D
Cyclicality of the participation rate of different population groups, and the labour force participation gap in the second quarter of 2021
a) correlation of the cyclical part of the labour force participation rate with the output gap between the first quarter of 2000 and the last quarter of 2019[10]
(correlation coefficient)

b) gap between the labour force participation rate and different counterfactual scenarios
(percentage points)

Source: Eurostat and ECB staff calculations
Notes: On panel a, the correlation is calculated between the output gap and the one-quarter lagged value of the Hodrick-Prescott filtered value of the labour force participation rate for the period 2005-19. The output gap is calculated using the potential output estimates of the European Commission. The Hodrick-Prescott filter is applied to the labour force participation rate by age groups, disregarding the pandemic observations and using instead a counterfactual scenario for the years 2020-21, in order to mitigate end-point uncertainty and the impact of the pandemic shock on pre-pandemic trend due to smoothing. On panel b, the first counterfactual scenario is derived from regressions linking the change of the labour force participation rate to GDP growth and past levels of the labour force participation rate and forecasting the path using the pre-pandemic GDP projections (2019 December Broad Macroeconomic Projection Exercise).
Recovery to pre-pandemic levels of the labour force participation rate will take time, even if discouraged workers return quickly. Past crises have tended to weigh on the labour force participation rate over a prolonged period. After accounting for the upward trending behaviour in the labour force participation rate (Chart E), the current gap to pre-crisis dynamics is more evident and is estimated to be around ‑0.75 percentage points. This estimate is surrounded by some uncertainty.[11] It is not yet clear whether the pandemic affects the trend of the labour force participation rate and how big the scarring effects will be. The above estimations suggest that the groups that had made the largest contribution to the upward trend of the aggregate labour force participation rate before the pandemic are the main cause of that rate being below its counterfactual path. Should these changes persist, future increases in the labour force participation rate may be more limited than expected before the pandemic.
A gradual return of the aggregate labour force participation rate could also be seen as broadly consistent with past regularities. The high persistence tends to be mainly driven by the stickiness of non-market work activities. [12] This may be stronger if the pandemic, to a greater extent than past crises, has prompted workers to reassess their career goals and to learn new skills by returning to education. Discouraged workers can rejoin the labour force relatively quickly, but even if the number of discouraged workers returned to pre-pandemic norms, there would still be a shortfall. A recovery in the participation rate will also depend on the strength of the recovery in labour demand.
Chart E
Trend and cyclical component of the labour force participation rate
(percentage of working age population and percentage point deviation from trend)

Sources: Eurostat and ECB staff calculations.
Notes: The data refer to the 15-74 age group. The trend is derived using a Hodrick-Prescott filter (λ=1600), with forecast data for the post-2019 period included in the estimation sample to alleviate the end-of-sample issues and to exclude an effect of the pandemic on trend. The cyclical component is the deviation of the actual labour force participation rate and the Hodrick-Prescott filtered trend. The counterfactual is derived as an aggregation of the counterfactual paths of different population groups. The latter is derived from regressions linking the change in the labour force participation rate to GDP growth and past levels of the labour force participation rate, and forecasting the path using the pre-pandemic GDP projections (2019 December Broad Macroeconomic Projection Exercise). Eurostat population projections are used for the aggregation. The latest observations are for the second quarter of 2021.
- In this box the terms “labour supply” and “labour force” are used interchangeably. The labour force is the sum of workers who are either employed or unemployed (and aged between 15 and 74). The labour force participation rate is calculated as the ratio between the labour force and the working age population (those aged between 15 and 74).
- These data should be interpreted with some caution as they may be subject to larger than usual revisions related to the ongoing implementation of the Integrated European Social Statistics (IESS) Directive.
- See “"The macroeconomic and fiscal impact of population ageing”, Box 1 in “Evolution of the ECB’s analytical framework”, Occasional Paper Series, No 277, European Central Bank, September 2021.
- See the box entitled “Main findings from the ECB’s recent contacts with non-financial companies” in this issue of the Economic Bulletin and “International Migration Outlook 2021”, OECD, 2021
- For more details, see the article entitled “Labour supply and employment growth”, Economic Bulletin, Issue 1, ECB, 2018.
- For more details, see the article entitled “Drivers of rising labour force participation – the role of pension reforms”, Economic Bulletin, Issue 5, ECB, 2020.
- For more details, see the article entitled “Hours worked in the euro area”, Economic Bulletin, Issue 6, ECB, 2021.
- There is some evidence that in the United States, early retirement increased. See, for example, Faria-e-Castro, M. “The COVID Retirement Boom”, Federal Reserve Bank of St. Louis, Economic Synopses, Number 25, 2021.
- Other aspects of heterogeneity may also be important, but an analysis of their role is subject to data constraints. One such aspect is the effect of the pandemic on immigration. Pre-pandemic increases in the labour force were strongly supported by immigration in some euro area countries. Net immigration flow may have slowed down, while some emigration may have occurred in the wake of the pandemic shock. However, data come with a time lag and are surrounded by a larger than usual uncertainty. Moreover, the effect on the labour force participation rate may be ambiguous.
- The correlation with the aggregate unemployment rate as an alternative business cycle indicator provides a very similar picture.
- First, the data may be subject to larger than usual revisions due to the ongoing implementation of the IESS. Second, both the trend-cycle decomposition and the extrapolation embed some degree of uncertainty. Several alternative methods were tested to assess the robustness of the estimate for this gap. Given the persistence of the labour force participation developments, the estimate for the counterfactual is not very sensitive to the methodology used, and the estimated gap remains in the range of -0.7 to -0.9 percentage points.
- For evidence on the role of non-market-work activities in driving the delayed cyclical recovery, see for example, for the United States, Cajner, T., Coglianese, J. and Montes, J., “The Long-Lived Cyclicality of the Labor Force Participation Rate”, Finance and Economics Discussion Series, Board of Governors of the Federal Reserve System, No 2021-047, 2021; see also for 30 OECD countries, Duval, R., Eris, M. and Furceri, D., “The effects of downturns on labour force participation”, OECD Economics Department Working Papers, No 875.l, 2011.