


The recovery in business investment – drivers, opportunities, challenges and risks
Published as part of the ECB Economic Bulletin, Issue 5/2022.
1 Introduction
The coronavirus (COVID-19) pandemic led to a sharp decline in business investment in the euro area, which was followed by a significant rebound. Euro area non-construction (or “business”) investment – also referred to as “investment” in this article – plummeted at the outbreak of the pandemic. Firms struggled to cover working capital in their day-to-day operational activities and delayed strategic investment objectives when the economies suddenly collapsed in the first half of 2020. Helped by substantial support from monetary and fiscal policy, which also prevented a larger collapse, it has now largely bounced back and is close to its pre-pandemic level.[1] However, investment has faced a number of headwinds, related to supply bottlenecks, rising energy costs and high uncertainty. The risks to the investment outlook have increased with Russia’s war in Ukraine. Meanwhile, the pandemic has accelerated the structural transformation process taking place in the euro area economy, highlighting the benefits of digital and green investment.
Looking at investment from a medium-term perspective, opportunities, challenges and risks stem from the digitalisation and greening of the economy. Understanding the implications of this twin transformation process is crucial given the important role of investment as a driver of the business cycle and determinant of the productive capacity of the economy.[2] This article takes stock of the current investment dynamics in the euro area and examines the drivers of the ongoing transformation process as well as its likely consequences for the economic recovery.
The article focuses on these cyclical and structural issues. Section 2 looks at developments in business investment two years after the onset of the pandemic in the euro area. Section 3 focuses on the opportunities, challenges and risks to investment from the ongoing digitalisation and greening of the euro area economy. Section 4 concludes.
2 Business investment: taking stock after the pandemic shock
Two years after the onset of the pandemic, business investment has largely recovered. The pandemic shock caused the largest and fastest fall in investment in modern history. Thanks to extraordinary policy support and the fact that lasting repercussions on the financial markets were limited, however, euro area investment has broadly bounced back (Chart 1), though by less than in the United States (see Box 1). Monetary policy has played a crucial role in supporting investment during the pandemic by providing favourable financing conditions and facilitating credit access for firms.[3] Evidence indicates that national fiscal policy support has been given predominantly to the firms and sectors with the largest liquidity needs or losses in sales during the crisis.[4] Fiscal policies have also supported investment over the past two years (in part through guarantees and liquidity support), particularly in digital technologies and the green transition.[5]
Nevertheless, the recovery in investment appears to have been weaker for countries and types of investment more heavily affected by supply bottlenecks and mobility restrictions. This is especially the case in Germany, which is facing a shortage of microchips, and for transport equipment, which has been hit by a drop in demand for flights (Chart 1, panels a and b). Since early 2022 investment has also faced rising commodity prices and uncertainty related to the war in Ukraine, along with re-intensified supply concerns as a result of the war and the resurgence of the pandemic in Asia.
Chart 1
Real non-construction investment in the four largest euro area countries
a) Total non-construction investment
(index: Q4 2019=100)
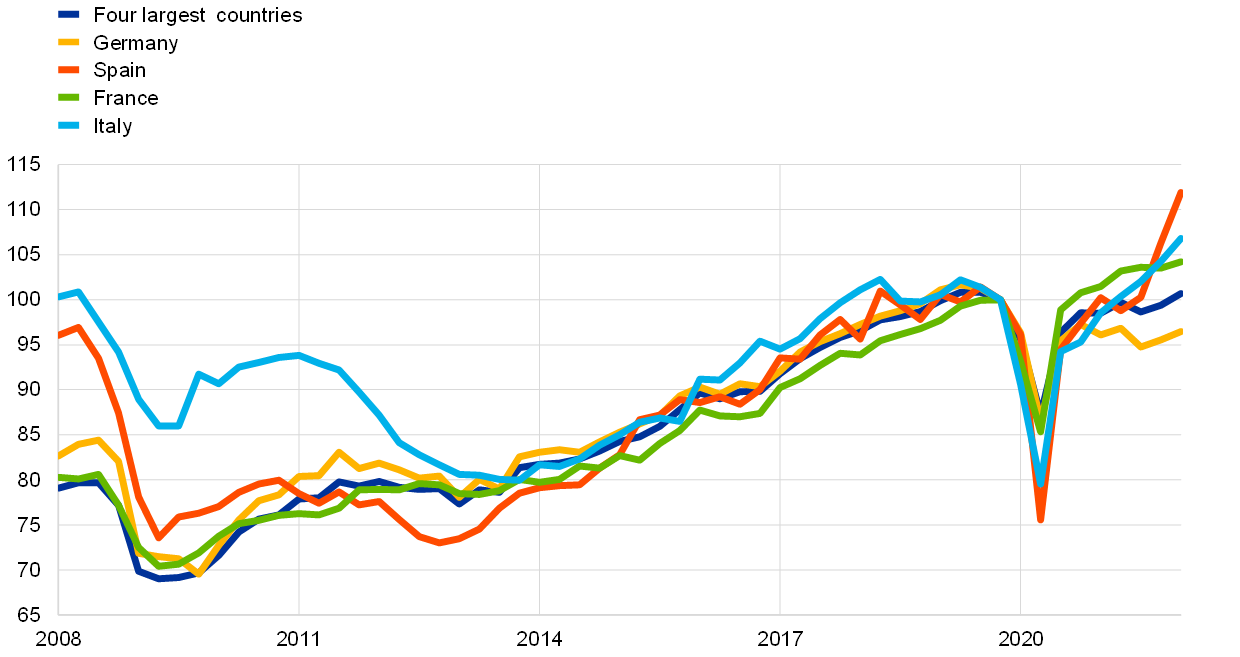
b) Breakdown by asset type
(index: Q4 2019=100)

Sources: Eurostat and ECB estimates.
Notes: The first series in panel a) and all data in panel b) refer to the four largest euro area countries to avoid the high volatility in some other euro area country data related to intangible investment (see Box 1). In panel b), owing to missing data, German investment in transport equipment from the second quarter of 2021 onwards has been proxied using the quarter-on-quarter growth rates for German production of transport equipment. The latest observation is for the first quarter of 2022.
Box 1
Non-construction investment in the euro area and the United States
This box compares the non-construction investment recoveries in the euro area and the United States. The rebound in non-construction investment in the United States from the COVID-19 lockdowns in 2020 was swift, with investment already surpassing pre-COVID levels and broadly back to its pre-pandemic rate of growth by the end of that year.[6] By contrast, data for the euro area aggregate suggest a significant gap compared with the pre-pandemic level (Chart A, panel a).
Chart A
Real non-construction investment
a) Total non-construction investment
(index: Q4 2019=100)
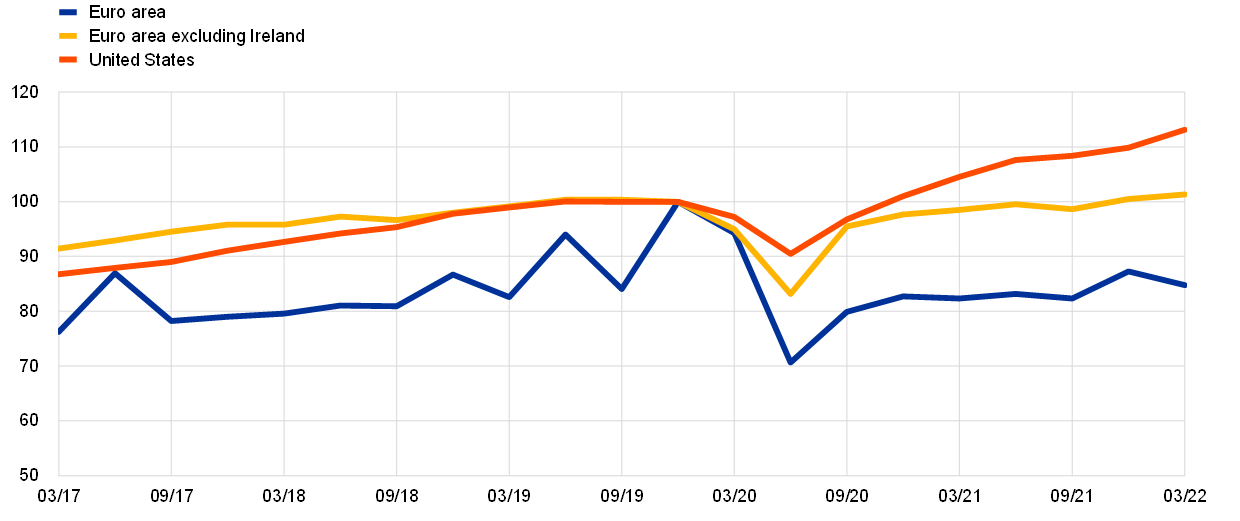
b) Breakdown
(index: Q4 2019=100)

Sources: Bureau of Economic Analysis (Haver Analytics), Eurostat and ECB staff calculations.
Notes: Panel a): US data are for private non-construction investment. Panel b): “Intellectual property products” (or intangibles) includes software and databases, and research and development expenditure (R&D). The latest observations are for the first quarter of 2022.
There are several factors behind the euro area’s slower recovery in investment. First, the pandemic began somewhat earlier in Europe than in the United States, and lockdown measures in the spring of 2020 were stricter and more protracted, resulting in less bad outcomes in terms of health but a larger contraction of economic activity and investment, as well as stronger headwinds for the recovery.[7] Second, and more importantly, euro area investment patterns have been more volatile than in the United States, reflecting irregular inflows of intangible investment by US multinationals, particularly for Ireland. By far the largest inflow to date occurred in the final quarter of 2019, artificially boosting the yardstick by which the subsequent recovery would be measured.[8] Adjusting for this starting level (Chart A, panel a), the euro area recovery is closer to the profile in the United States, albeit merely edging back to pre-crisis levels by mid-2021. This evolution is common across asset types, with a gap having built up between the euro area and the United States both for machinery and equipment and for intellectual property products (Chart A, panel b).
There are additional explanations for the faster rebound in investment in the United States than in the euro area. The swifter economic rebound in the United States may have increased confidence in the strength of the recovery, thus reducing the downward drag of uncertainty on investment relative to the situation in the euro area. More lay-offs in the United States during the most restrictive period of the pandemic may also have been compensated for by higher investment than in the euro area. At the same time, a potentially larger share of jobs open to teleworking in the United States may have helped to boost investment in IT-related equipment more than in the euro area.[9] Some euro area investment may also have been postponed during the second half of 2020 and early 2021 as the private sector waited for details related to the workings of the Next Generation EU instrument (see Box 2).
Over the past two years investment has continued to fall short of corporate savings. The euro area non-financial corporate sector has been a net lender for most of the period since the global financial crisis, meaning that firms generated savings in excess of their investment in most years (Chart 2). These dynamics reflect a range of factors which have curbed investment and spurred savings.[10] For example, investment has been dampened by: structural rigidities in product and labour markets; episodes of balance sheet adjustment to reduce a high corporate debt burden; the expansion of the services sector, causing shifts from tangible capital to labour-intensive production; as well as a secular fall in returns on investment, which has incentivised firms to shift towards financial assets and away from fixed capital assets.[11] Savings have been boosted by firms increasing the cash buffers needed to finance intangible investment and leaner inventories.[12] The corporate net lending position increased further during the pandemic and reached record levels in 2021, with non-financial corporations increasing liquidity and capital buffers to better withstand future shocks.[13]
While internal funds have increased, the timing of their future use is uncertain. Both internal and external financing as a share of value added have increased over recent years (Chart 2). Ample availability of funding should support business investment and the financing of both digitalisation, which relies more on internal funds, and green investment, which is both equity and debt-financed. However, firms may choose to retain precautionary savings when faced with continued high uncertainty, particularly as a result of the war in Ukraine (given its potential impact on the future energy mix or globalisation forces), the uncertainty about the need for investment as a result of climate-related policies, the fading of fiscal support measures or, more recently, high inflation. Other challenges and risks to the investment outlook stem from the expected normalisation of the cost of financing, high corporate indebtedness, and an expected increase in insolvencies.[14]
Chart 2
Nominal investment, savings and financing
(four-quarter moving averages as a percentage of value added)
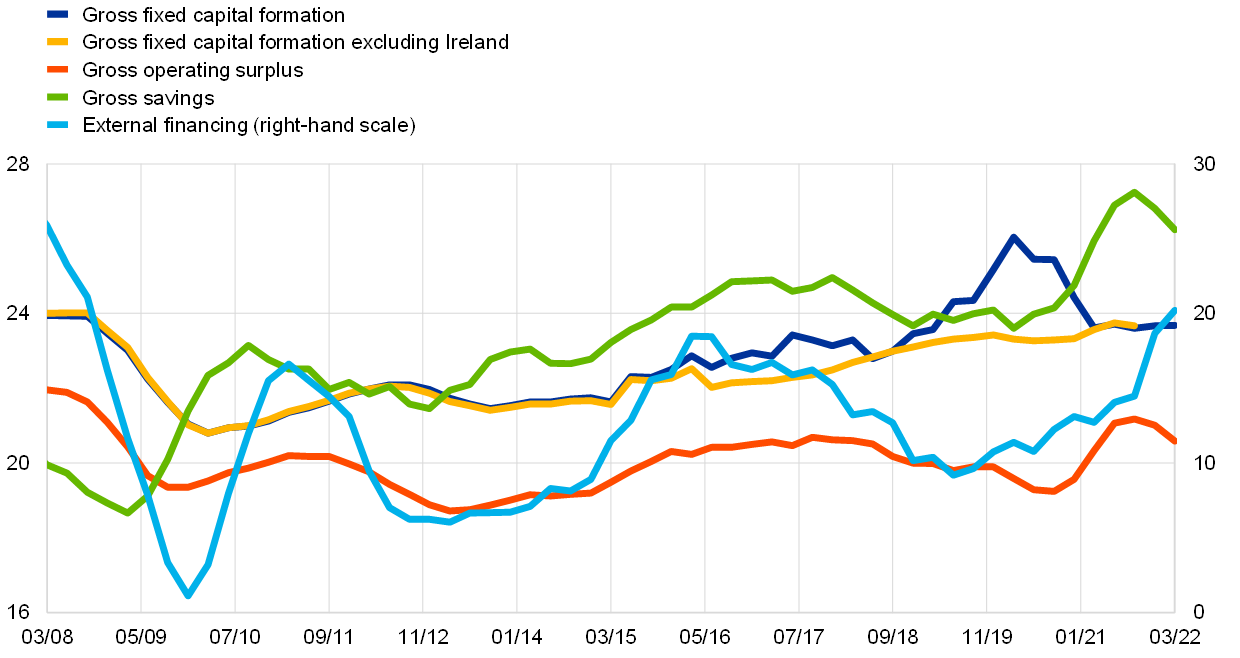
Source: ECB.
Note: External financing refers to the net incurrence of total financial liabilities, including monetary financial institution (MFI) loans, debt securities, shares, loans from non-MFIs and the rest of the world, and trade credit. Gross operating surplus is expressed as a share of value added minus 20. The latest observations are for the third quarter of 2021 for gross fixed capital formation excluding Ireland, and for the first quarter of 2022 for the other series.
Domestic demand and profits are key drivers of business investment dynamics. A structural vector autoregressive (VAR) model shows that the main determinants of investment growth since 2008 have been shocks from domestic demand and gross operating surplus (Chart 3). Together with weak demand, news-based uncertainty has curbed investment in past crises as well as during the pandemic. Estimations based on micro data point to the relevance of demand (sales) and profits (cash flow), but with different sensitivities depending on the firm’s financial soundness, sector and size, see Box 2.
Chart 3
Decomposition of business investment
(annual percentage changes, percentage points)
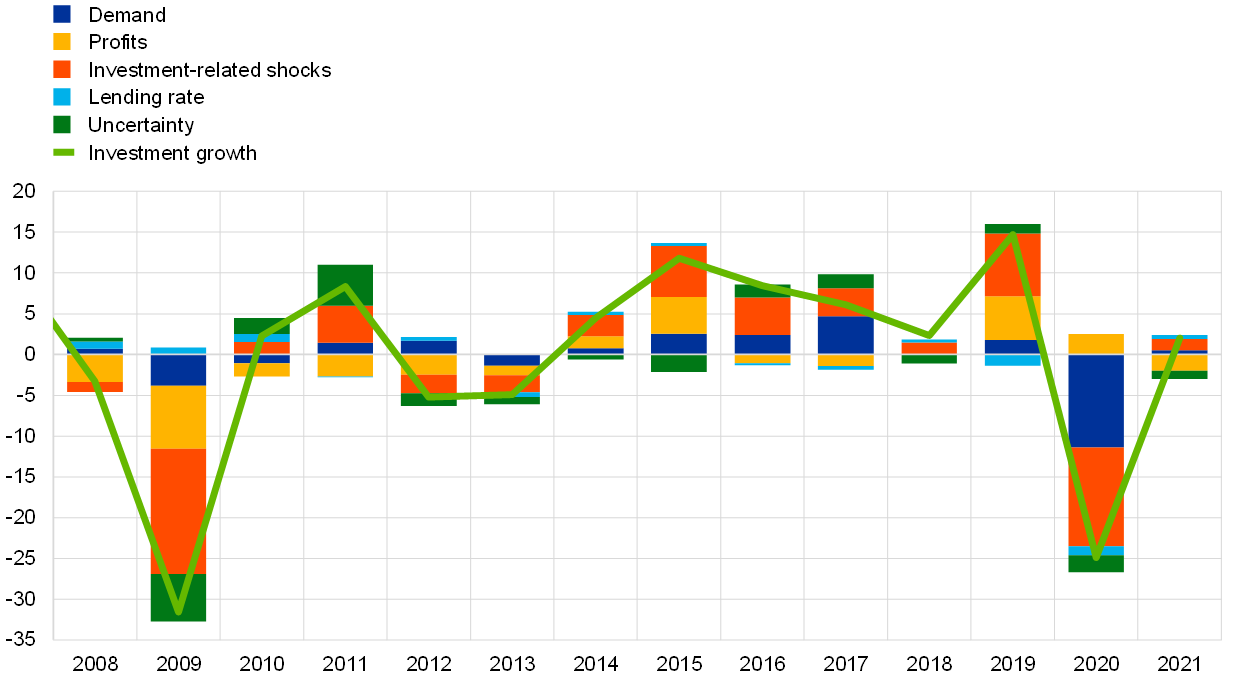
Sources: Baker S.R., Bloom, N. and Davis, S.J., “Measuring Economic Policy Uncertainty”, 10 March 2016, European Commission, Eurostat, ECB and ECB estimates.
Notes: The structural VAR model uses a Cholesky decomposition of shocks. It is estimated on quarterly data for the period from the first quarter of 2005 to the fourth quarter of 2021, and the results aggregated to produce annual data. “Demand” is GDP minus total investment from the national accounts, “profits” is total gross operating surplus from the national accounts. “Investment” is total investment excluding housing investment (both from the national accounts) and excluding government investment (from the AMECO database, interpolated quarterly and deflated). “Uncertainty” is a news-based measure of uncertainty (using two newspapers per country). The “lending rate” is the annualised interest rate on corporate loans other than revolving loans and overdrafts, convenience credit card debt and extended credit card debt. See WGEM Team on Investment, “Business investment in EU countries”, Occasional Paper Series, No 215, ECB, October 2018, pp. 92-93. The latest observations are for 2021.
Box 2
The role of cash flow in business investment on the basis of firm-level data
This box uses firm-level data to assess drivers of business investment, particularly among financially constrained firms. The literature has found that financial factors such as financial debt or cash flow are key determinants of investment in tangible fixed assets. Other characteristics such as the sector or country where the firms operate, sales growth, expected future profitability and the level of economic uncertainty are also relevant. The present analysis is based on investment equations including most of these determinants, estimated using panel data for firms in the four largest euro area countries for the post-financial crisis period (2013-19). The empirical results confirm the relevance of cash flow, particularly for micro and small firms, and for countries with a larger proportion of small firms, such as Spain and Italy.[15]
One key driver of investment is related to the extent to which firms have access to external financing, specifically bank credit, or are financially constrained. Proxies for financial constraints are firm leverage, size or age. In the literature, “excess sensitivity” of investment to cash flow is often interpreted as suggesting the importance of financial constraints. Having cash at hand when credit conditions tighten is important, since firms with high debt and low cash holdings could be forced to cut investment when facing adverse shocks. Identifying vulnerable firms as those with simultaneously high levels of debt and low levels of cash or liquid assets suggests that around 15% of firms were in a vulnerable financial position before the COVID-19 crisis on average for the four countries.[16] In all countries most of the vulnerable firms are micro firms. Since smaller firms tend to be more dependent on bank-based external financing, high leverage ratios represent both high levels of indebtedness (potentially affecting their access to finance) and greater exposure to interest rate risk. Utility companies and firms in the accommodation and food as well as transport sectors are much more frequently represented among vulnerable firms. While utility companies benefit from a stable cash-flow stream, they are highly leveraged to finance potentially large and periodic capital expenditure needs for the purpose of maintaining infrastructures. Accommodation and food services firms, which were among the hardest hit sectors in the COVID-19 crisis, were already relatively highly represented among vulnerable firms in 2019.
When the sensitivity of investment to cash flow before the pandemic is considered separately for vulnerable and for non-vulnerable firms, it is much higher for vulnerable firms (Chart A). This means that unexpected changes in operating cash flow are likely to lead to larger adjustments in investment decisions for those firms. Since some of the sectors most affected by the pandemic (such as transportation and storage, accommodation and food, or real estate services) already had a larger than average share of vulnerable firms, the investment contraction is likely to have been particularly sizeable in those sectors. The predicted decline in the investment ratio given the observed changes in both cash flow and sales in 2020 is largest in those sectors that were most affected by the pandemic (Chart B). Gross fixed capital formation data for 2020 by sector, where available, confirm that investment declined the most in these sectors. Preliminary (but incomplete) micro data for 2020 indicate that the decline in the investment ratio was on average smaller than predicted in all sectors. This suggests that other factors such as monetary and fiscal policy support also had an effect.
Chart A
Investment in tangible assets and cash flow for vulnerable and non-vulnerable firms in each sector
(y-axis: investment in tangible assets over total fixed assets; x-axis: cash flow over total fixed assets)
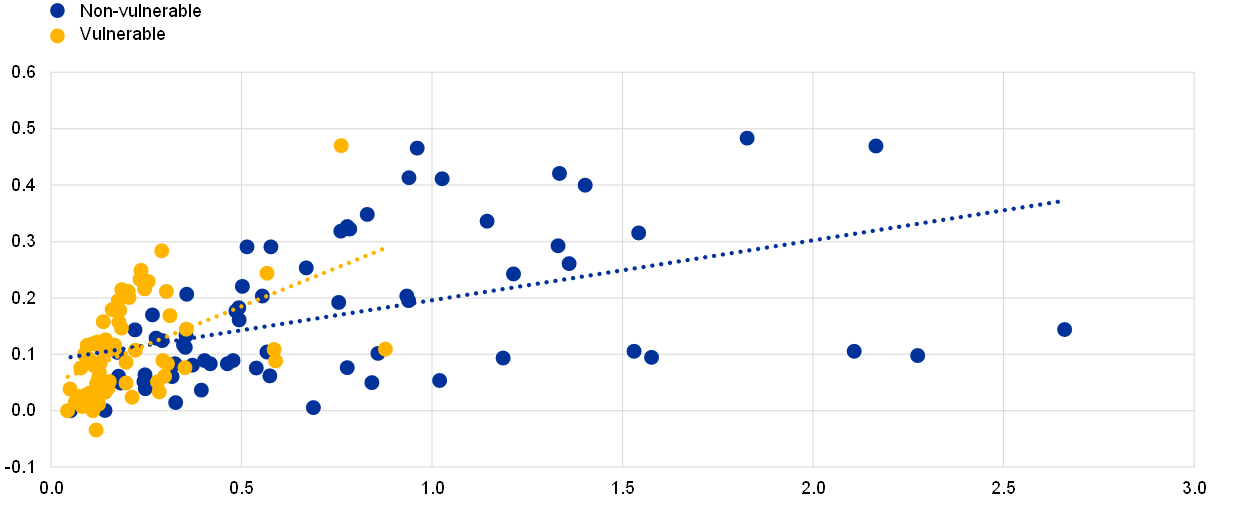
Sources: Orbis and ECB calculations.
Notes: The chart shows the average investment in tangible assets and cash flow (i.e. profits plus depreciation), both scaled by fixed assets at book value, for vulnerable and non-vulnerable firms in each economic sector (all sectors except the financial sector based on the NACE classification system) in Germany, Spain, France and Italy over the period 2012 to 2019. See footnote 16 for a definition of vulnerable firms. All variables in the underlying micro data are winsorised at the 5th and 95th percentiles to mitigate the impact of outliers.
Chart B
Predicted changes in the investment ratio in 2020
(y-axis: predicted change in investment ratio (percentage points); x-axis: change in cash flow (percentages))
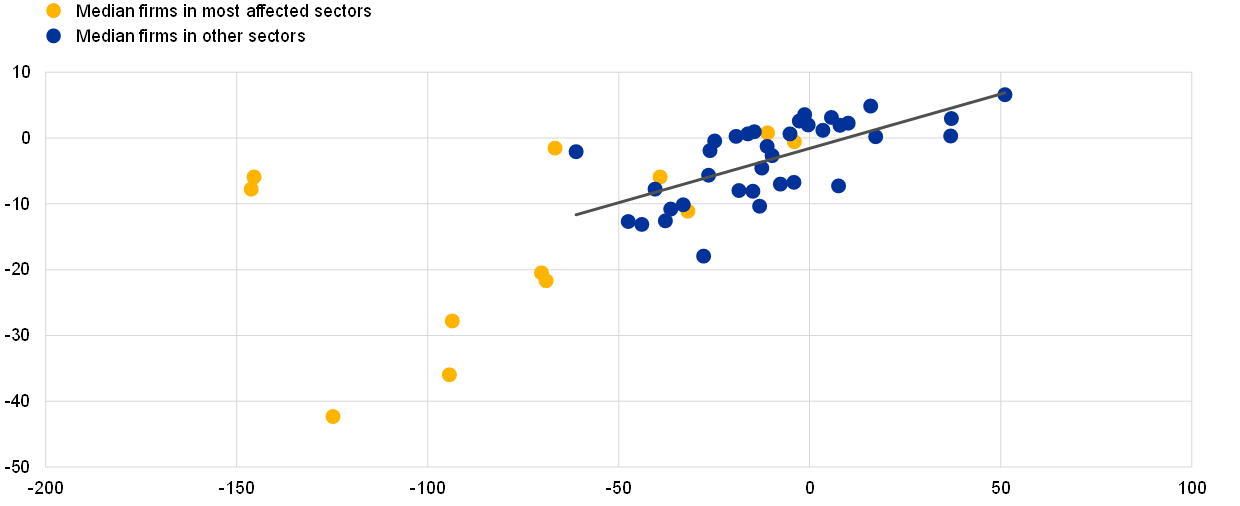
Sources: Orbis, BACH and ECB calculations.
Notes: The chart depicts the predicted changes in the investment ratio for the median firm in Spain, France and Italy and in each economic sector in 2020 (all sectors except the financial sector based on the NACE classification system) given the observed changes in cash flow from 2019 to 2020. Since firm level data for 2020 is incomplete, sectoral information from the BACH database, which does not cover Germany, has been used for changes in both cash flow and sales growth (which is also included in the investment equation). The investment ratio is defined as the change in tangible fixed assets over previous period tangible and intangible fixed assets. The most affected sectors are wholesale and retail trade, transportation and storage, accommodation and food services, and arts, entertainment and recreation. The regression line is based on the observations for firms in other sectors (blue dots). It suggests a clear positive relationship between predicted changes in the investment ratio and changes in cash flow. For firms in the most affected sectors (yellow dots), the drop in both cash flow and the predicted investment ratio was much larger than for the other sectors.
Policy support was fundamental to providing liquidity and cushioning the impact of the pandemic, albeit to a different extent across firms. Among the policy measures, monetary policy played a key role in ensuring the preservation of favourable financing conditions and a continuous credit flow. Nonetheless, financial constraints may mean that individual firms’ investment spending responds differently to changes in monetary policy, and the empirical evidence for this is inconclusive.[17] Monetary policy shocks proxied either by bank lending rates or changes in three-month EONIA swaps appear, nevertheless, to have more explanatory power for investment decisions of vulnerable firms in Spain or Italy than in other countries.
Box 3
Business investment and the Next Generation EU instrument – crowding in or crowding out?
This box assesses the impact of the expected significant increase in EU-funded public investment on business investment. The Next Generation EU (NGEU) fiscal instrument was set up in response to the pandemic, and was designed not only as a temporary measure to support the recovery process but also to make the EU economies more resilient through structural reforms and investment, in line with long-term EU objectives such as the green and digital transitions.[18] Its core component, the Recovery and Resilience Facility (RRF), will provide the EU Member States with grants and loans of up to €724 billion in current prices over the period 2021-26. RRF funding is conditional on, among other criteria, its use for investment projects complying with pre-defined targets and milestones.
Focusing on the euro area, NGEU is expected to increase public investment by around 2.5 percentage points of GDP in the six-year period to 2026. The largest share of NGEU funding is intended to be allocated to new investment projects (“additional investment”), with a smaller part financing already budgeted projects (“substitutive investment”), as shown in Chart A, first column. Previous studies suggest that NGEU investments and structural reforms are likely to have positive economic effects (e.g. on growth, potential output, cross-country convergence and public finances), but they do not explicitly focus on the effects on private investment.[19]
Chart A
NGEU funding and its expected cumulative impact on private and total investment in the euro area (2021-26)
(percentage points of euro area GDP)
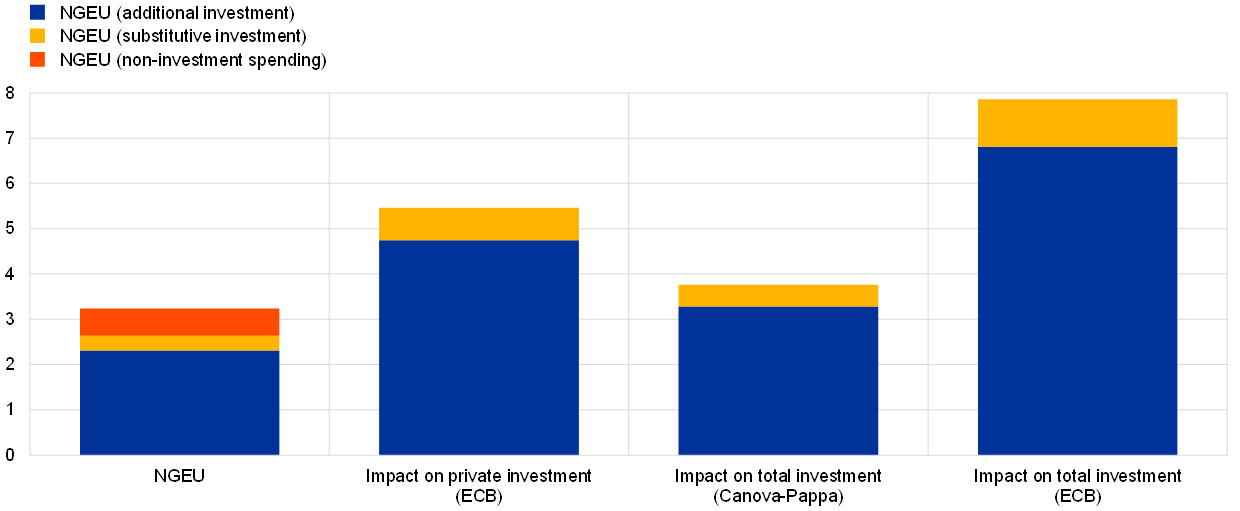
Sources: Canova and Pappa (see footnote 22), and ECB staff calculations with input from Eurosystem staff calculations.
Notes: Calculations based on the instrumental variable elasticities reported in Table 1, applied to the expected flow of funds stemming from NGEU. Canova and Pappa’s calculations are based on their estimated multiplier, on impact, of the European Regional Development Fund on investment. Most NGEU grants and loans are expected to finance new fiscal measures in the euro area (“additional”) with a smaller amount expected to finance already budgeted fiscal measures (“substitutive”).
Whether changes in public investment have a positive or negative impact on business investment remains a contested issue in the literature. Under certain circumstances, public investment may crowd out business investment, either directly, because private economic activity is substituted by public economic activity, or indirectly, because higher public debt pushes up interest rates and thus the real cost of capital.[20] On the other hand, public investment may have a positive multiplier effect on business investment, for instance if public infrastructure investment leads to a more favourable business investment environment.[21]
The potential impact of NGEU on private investment can be gauged by estimating the historical multipliers of the European Structural and Investment Funds (ESIF) for private investment. While there are differences between the ESIF and NGEU regarding their governance (for example RRF-funded measures do not require co-financing by the EU Member States), the ESIF and NGEU share two important features in terms of their policy objectives and instruments.[22] First, funding is directed towards broadly similar goals, including investment in research and development (R&D), the green transition and social cohesion. Second, both the ESIF and NGEU allocate most of their funding to investment (around 80% of NGEU expenditure in the euro area; Chart A, first column). Therefore ESIF flows, which are available from the early 1990s, can be used to estimate the effects of such EU funds on private investment – of which approximately 70% is business investment – relative to GDP on an annual basis, both at impact (h=0) and in the following years (h>0).
According to the historical regularities estimated for the ESIF, NGEU-funded public investment could crowd in sizeable private investment, with a multiplier greater than one. The estimated multipliers of the ESIF – based on a panel of 28 EU countries from 1994 to 2018 – are larger than one, at impact as well as after one year (Table A). This implies that one euro spent through the ESIF is associated with two euro in private investment cumulated over time. The cumulative magnitude of the effect is therefore positive and large. Similar conclusions can be drawn from a study by Canova and Pappa (see footnote 22), which uses alternative econometric techniques and focuses on total (private and public) investment, although the positive impact is smaller. Despite high uncertainty and potential variation across countries, these estimates suggest that the NGEU flows have the potential to increase euro area private investment cumulatively by about 5% of euro area GDP between 2021 and 2026 (Chart A).[23] However, this conclusion is subject to a number of assumptions, including that the NGEU plans will be implemented in a timely, efficient and effective way.
Table A
European Structural and Investment Funds’ multipliers for private investment
(Cumulative impact of one euro of ESIF funding on private investment expenditure relative to GDP in the current year (h=0) and one year ahead (h=1))

Sources: European Commission, Eurostat and ECB staff calculations.
Notes: The estimation entails a linear regression of the change in ESIF funding on the change in investment (both scaled by GDP) with an instrumental variable, where the change in predicted ESIF funding is employed as an instrument. The latter is constructed, for a given region, as the average ESIF disbursements in regions with similar characteristics but in other countries, then aggregated at the national level. The estimation controls for previous year GDP growth, year and country fixed effects and global financial crisis country-time fixed effects. The top and bottom 5% of observations are winsorised. Sample: 1994-2018 for the then 28 Member States of the EU. Methods draw from: Durand, L. and Espinoza, R.A., "The Fiscal Multiplier of European Structural Investment Funds: Aggregate and Sectoral effects with an Application to Slovenia", IMF Working Paper, No 2021/118, International Monetary Fund, 30 April 2021. ***denotes statistical significance at 1%.
There are several possible channels by which EU-financed public investment stimulates private investment. First, much of EU financing goes into network infrastructure (transport and communication). This has opened up previously isolated rural areas to business investment. Second, EU funding often goes to underdeveloped sectors of the economy, particularly in advanced technologies. Returns in these sectors may be relatively high and attract investor interest. A third explanation for the high ESIF multiplier may be the fact that these projects require national co-financing, by either public or private entities. Nevertheless, identifying the factors behind the positive effects of EU-financed investment on private investment remains an open research avenue.
3 Opportunities and challenges for investment
The pandemic has provided major investment opportunities for digitalisation and greening. These are two of EU’s key policy priorities, and NGEU funds are intended to spur such investment (see Box 3). Considerable further investment is necessary to meet targets, and there are several challenges and risks to be overcome.
Digitalising investment
Investment in digital technologies accelerated after the outbreak of the pandemic, with especially larger firms as well as firms in the services sector taking up such technologies.[24] Survey evidence shows that the adoption of digital technologies increased in the EU between 2018 and 2020, and roughly half of firms surveyed in Germany in February 2021 reported having invested in some form of digital technology during the pandemic, while a third considered the pandemic to have accelerated digitalisation (Chart 4). There is, however, considerable variation across firms and sectors: large firms in the EU were more likely to have invested in digital technologies, while small and medium-sized firms had encountered more financial or logistical barriers than others. Across sectors, while digitalisation in the manufacturing sector was high but had not advanced significantly during the pandemic, the services sector had accelerated investment in digital technologies.
Chart 4
The COVID-19 pandemic and the diffusion of digital technologies
a) European Union
(percentages of firms in the respective survey)
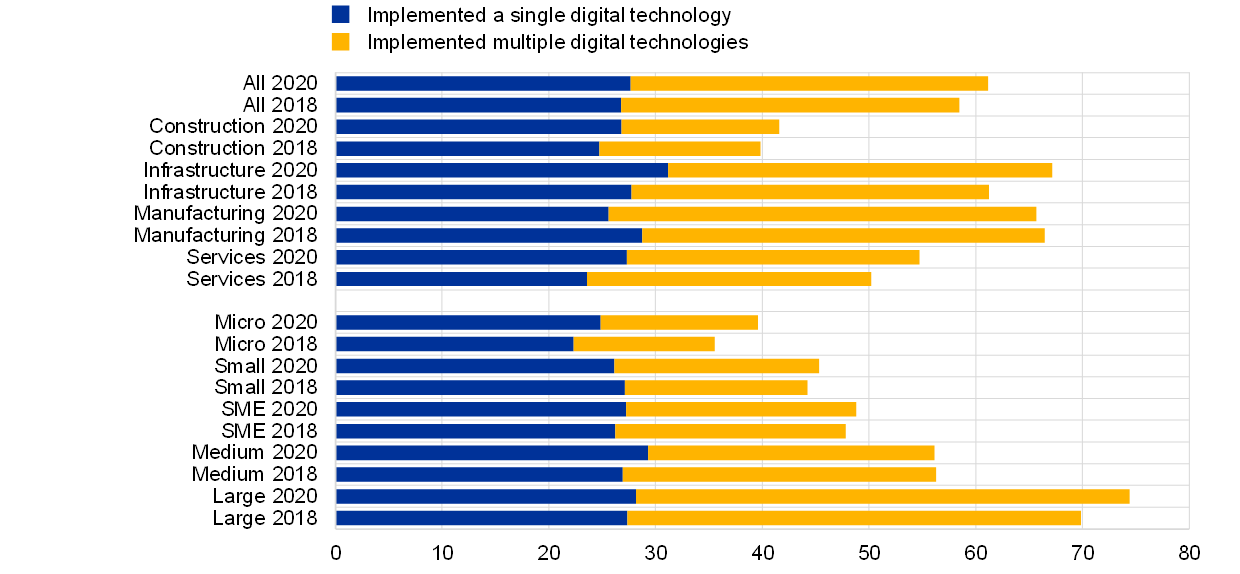
b) Germany
(percentages of firms in the survey)

Sources: panel a): European Investment Bank Investment Survey; panel b): Bellmann et al., “The pandemic has boosted firm investments in digital technologies”, VoxEU, 5 August 2021, and Institute for Employment Research.
Notes: The survey shown in panel a) was conducted in 2018 and 2020. The data in panel b) answer the question “Did the pandemic accelerate the diffusion of digital technologies?” and cover 1,941 German firms, which were surveyed by phone in February 2021. SME stands for “small and medium-sized enterprises”.
Digitalisation and R&D efforts in the euro area are making investment more intangible-intensive. Intangible investment has been rising in the euro area as a share of GDP (Chart 5, panel a), driven by R&D, which covers investment to expand the technology frontier, as well as expenditure on software and databases, which tracks the software component of digital investments. Intangible investment intensity rose from 4.1% of GDP in the euro area in 2019 to 4.4% in 2020, according to preliminary national accounts data for 2020. Intangible intensity can also be tracked through balance sheet data for publicly listed firms incorporated in the euro area, which report R&D expenditure as well as firm-specific intangibles expenditure. The latter is based on a broader definition of intangible investment than national accounts data, including also marketing and human capital investment. Such investment is linked to firms’ ability to bring their products to the market, reaching consumers and gaining and retaining market share. Balance sheet data also show that euro area-based firms have been investing increasingly in intangibles, with aggregated intangible investment exceeding 5% of sales in 2020 (Chart 5, panel b). This confirms the relatively small negative impact of the pandemic on intangible investment (Chart 1, panel b).
Chart 5
Intangible investment intensity of the euro area
a) Intangible intensity: national accounts data
(percentages of GDP)

b) Intangible intensity: firm balance sheet data
(percentages of sales)
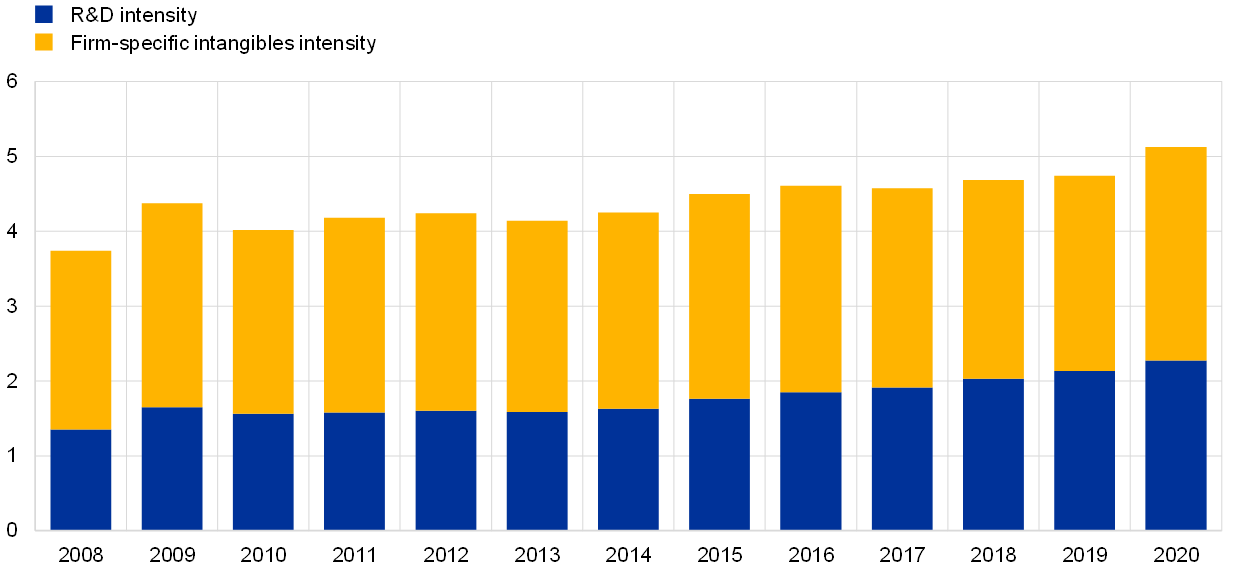
Sources: Eurostat, Standard and Poor’s and ECB calculations.
Notes: National accounts intangible intensity is defined as intangible investment over GDP. Balance sheet intangible intensity (for publicly listed firms incorporated in the euro area) is defined as total intangible investments over total sales. The balance sheet data sample excludes agriculture and finance (NACE codes A and K). “Firm-specific intangibles” is defined as 30% of sales, general and administrative expenses as in Peters and Taylor.[25]
Increasing intangible intensity and digitalisation have a wide-ranging impact on the business environment. For example, digitally intensive firms tend to spur productivity in their sectors, albeit often with some lag before the full productivity-enhancing effects of digital technologies are felt.[26] Digitalisation is also intrinsically linked to tax regimes, which could make the tax-base of increasingly digital and intangible-intensive economies more volatile. If multinationals can easily transfer their intangible assets from one location to another, volatility in investment cycles could also increase.[27] Intangible-intensive firms may face additional funding constraints, as intangible investments may be hard to use as collateral, resulting in uncertainty concerning the ability to raise funding.[28] As a consequence, firms tend to rely on retained earnings rather than bank loans to fund intangible investment.[29] A more intangible-intensive economy could thus respond less sensitively to the credit channel of monetary policy.[30]
The road to digitalisation in Europe is made more difficult by the structural characteristics of the corporate sector. Europe tends to be slow to adopt digital technologies because of its large proportion of small and medium-sized enterprises, which switch to new technologies more slowly than larger firms; a still incomplete single market in services; a preference for debt financing, due to the tax-deductibility of interest payments; and to some extent factors related to regulation and costs.[31]
Greening investment
The need to develop new technologies to mitigate and adapt to climate change-related risks creates investment opportunities.[32] Large firms associate climate change not only with risks but also with business opportunities, particularly if they seek to be transition leaders, or develop clean technologies or IT and consulting services that help others transition, according to recent ECB corporate survey evidence.[33] The survey shows that firms have already increased their investment to mitigate climate-related risks, to ensure compliance with climate policies and to minimise disruptions from possible natural disasters.
Green innovation – measured by patents related to climate change mitigation and adaptation technologies as a share of all patents – has seen a notable increase in some sectors. Green patents accounted for the largest share of all patents registered from 2016 to 2018 in the most polluting sectors, such as basic materials, energy and those producing other industrial goods, indicating that a significant proportion of their R&D spending was devoted to green technologies (Chart 6). The process of diffusion of patented technologies through the wider economy is expected to trigger further green investment.
Chart 6
Cumulative R&D investment and green innovation by sector of main business
(left-hand scale: tonnes of CO2 equivalent/USD millions, right-hand scale: EUR billions)

Sources: European Commission EU Industrial R&D Investment Scoreboard for R&D investment, EC-JRC/OECD COR&DIP© database v.3 for patents, Urgentem for emissions, ECB staff calculations.
Notes: Carbon intensity refers to the ratio of CO2 emissions to revenues; the chart shows 2020 sectoral averages. Cumulative R&D investment is computed as the sum of R&D investment (in nominal terms) of the 500 companies that invested the largest sums in R&D in the 27 EU countries plus the United Kingdom over the period 2011-20. The starting year 2011 is chosen because of a change in that year in the sector definitions in the Industry Classification Benchmark managed by FTSE Russell. The sector of main business is based on the Industry Classification Benchmark. Green patents are defined as those related to climate change mitigation and adaptation. Green innovation refers to the share of green patents registered by the top 462 R&D investors in the years from 2016 to 2018.
Investment in clean energy constitutes the main pillar of the green transition and depends critically on the availability of clean technologies for energy production. Investment in energy transition is increasing for all technologies and reached some €110 billion in the euro area in 2021.[34] This is still a small share of overall investment (Chart 7). While the pace of green investment in EU has accelerated over the pandemic period, additional investment of €90-100 billion per year would be needed in the period to 2050 to reach the EU target of zero net emissions.[35] The investment needs are higher under a policy mix – combining carbon pricing, bans and regulations, and green subsidies – than a policy based on carbon pricing alone.[36] Across sectors, the investment needs of the residential sector exceed the combined investments needed in transport, industry and services. The energy crisis and the war in Ukraine have strengthened the incentives to pursue green energy investment for reasons of energy security. At the same time, the resulting rise in global commodity prices and resurging supply bottlenecks have increased the risk of investment delays in the clean energy sector by driving up production costs for solar modules, wind turbines and battery packs.
Chart 7
Euro area non-construction investment and investment in energy transition by technology
(percentages of GDP)
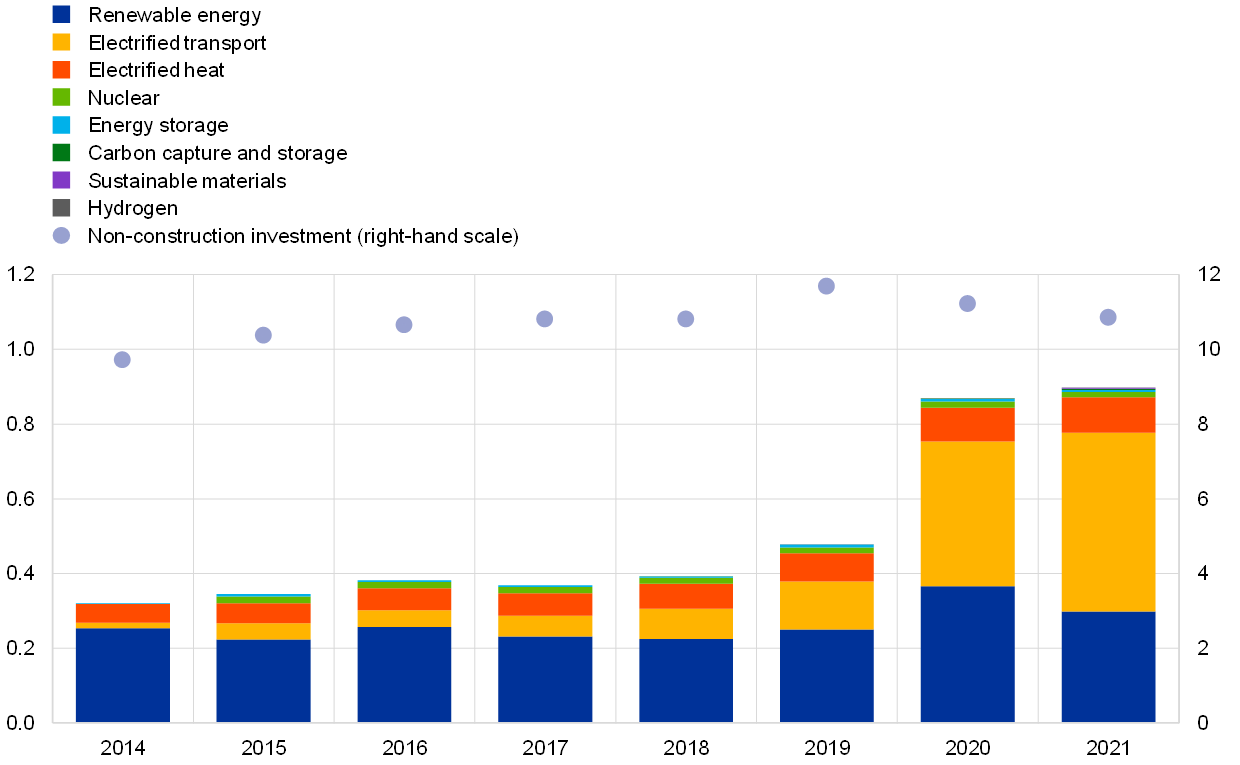
Sources: BloombergNEF and Eurostat.
Note: The series “nuclear”, “carbon capture and storage”, “sustainable materials” and “hydrogen” start in 2015, 2018, 2021 and 2019 respectively.
There are several challenges for green investment, primarily related to available financing, regulation certainty and staffing. Financing from public and private sources to support green investment is crucial.[37] EU funding for private investment in new green technologies is provided through the Next Generation EU instrument (see Box 3), the European Fund for Strategic Investments and European Investment Bank loans.[38] Moreover, the policy mix as well as private returns on such projects need to give the appropriate incentives. To facilitate and incentivise the implementation of the “Fit for 55” package, carbon pricing and regulations in the Green Deal are accompanied by enabling infrastructure, a Just Transition Mechanism and a gradual phasing out of free Emissions Trading System allowances.[39] Nevertheless, many European firms hesitate to invest owing to uncertainty surrounding the regulatory framework, high investment costs, lack of financing, unavailability of skilled staff and uncertainty about new technologies.[40] Even though firms surveyed by the ECB mentioned these challenges in a climate change-related special survey this year, all respondents planned to increase their investment in climate mitigation throughout the transition period as part of their strategy to stay resilient.[41]
4 Conclusions
Euro area business investment plummeted during the pandemic; the rebound has been significant but has varied considerably across countries, firms and types of investment. Nevertheless, the pandemic has accelerated the adoption of digital technologies as a result of the increase in remote working. Green private investment is being spurred by green transition policies and firms’ behavioural changes in response to surging climate risks as well as energy security considerations related to the war in Ukraine. While supported by extraordinary policies, investment has continued to face headwinds over the past two years, which also pose clear risks in the years ahead. The war has intensified risks to the short-term outlook for investment in relation to supply constraints, production costs and uncertainty. Corporate savings have increasingly exceeded investment. It is still uncertain when firms will start spending their accumulated savings on investment.
The continued recovery in euro area investment is heavily dependent on the challenging pursuit of digitalisation and greening of the euro area economy. This twin transformation has created investment opportunities during the pandemic, but investment needs in these areas remain considerable and expenditures are still insufficient. While R&D and new technologies have the potential to boost euro area productivity, particularly given the possible synergies between digital and green investment, challenges remain in terms of financing, regulation and incentives, which require coordinated policies.
Adjusted for the statistical volatility of intangible investment in Ireland (see Box 1).
See the article entitled “Business investment developments in the euro area since the crisis”, Economic Bulletin, Issue 7, ECB, 2016.
See the ECB’s website for information on its response to the pandemic, and Ferrando, A., Popov, A. and Udell, G.F., “Unconventional monetary policy, funding expectations and firm decisions”, Working Paper Series, No 2598, ECB, October 2021.
See the box entitled “The impact of fiscal support measures on the liquidity needs of firms during the pandemic”, Economic Bulletin, Issue 4, ECB, 2021, and Harasztosi, P. et al., “Firm-level policy support during the crisis: So far, so good?”, EIB Working Papers, 2022/01, European Investment Bank, January 2022.
See the article entitled “The initial fiscal policy responses of euro area countries to the COVID-19 crisis”, Economic Bulletin, Issue 1, ECB, 2021, and “Latest EIB survey: The state of EU business investment 2021”, European Investment Bank, 2 December 2021.
Moreover, trend growth has typically also been slightly higher in the United States than in the euro area. Between the trough of the global financial crisis and end-2019, US non-construction investment grew by just over 1.5% per quarter, compared with around 1.4% in the euro area (0.8% excluding Ireland). Following the double-dip recession of 2008-12 in the euro area, US investment increased, on average, by 1.1% quarter on quarter, compared with 1.0% in the euro area excluding Ireland.
See Licchetta, M., Mattozzi, G., Raciborski, R. and Willis, R., “Economic Adjustment in the Euro Area & the United States during the COVID-19 Crisis”, European Economy Discussion Paper, No 160, European Commission, March 2022. See also the box entitled “Economic developments in the euro area and the United States in 2020”, Economic Bulletin, Issue 2, ECB, 2021.
This yardstick may also have been boosted by additional investment amid fears of a no-deal Brexit. See Box 1 in the article entitled “Understanding post-referendum weakness in UK import demand and UK balance of payments risks for the euro area”, Economic Bulletin, Issue 3, ECB, 2021.
See Brussevich, M., Dabla-Norris, E. and Khalid, S., “Who will Bear theBrunt of Lockdown Policies? Evidence from Tele-workability Measures Across Countries ”, IMF Working Paper, No 2020/088, International Monetary Fund, 12 June 2020, and Dingel, J.I. and Neiman, B., “How many jobs can be done at home?”, Journal of Public Economics, Vol. 189, September 2020.
See Boone, L. and Revoltella, D., “Policy change needed to accelerate investment in structural transformation”, VoxEU, 6 December 2019.
See Ruscher, E. and Wolff, G., “Corporate balance-sheet adjustment: New stylised facts and their relevance for the Eurozone”, VoxEU, 5 March 2012.
See Demary, M., Hasenclever, S. and Hüther, M., “Why the COVID-19 Pandemic Could Increase the Corporate Saving Trend in the Long Run”, Intereconomics Review of European Economic Policy, Vol. 56, No 1, pp. 40-44.
See the box entitled “Corporate saving ratios during the pandemic”, Economic Bulletin, Issue 2, ECB, 2022.
See the article entitled “Assessing corporate vulnerabilities in the euro area”, Economic Bulletin, Issue 2, ECB, 2022.
The dynamic investment equations are estimated using a generalised method of moments approach, which controls for biases due to unobserved firm-specific effects and endogenous explanatory variables. The model includes lags of investment, sales growth and cash flow, as well as time, sector and firm-size fixed effects, and a long-run equilibrium investment-capital stock relationship, or error correction term, as in Bond, S., Elston, J.A., Mairesse, J. and Mulkay, B., “Financial factors and investment in Belgium, France, Germany, and the United Kingdom: A comparison using company panel data”, The Review of Economics and Statistics, MIT Press, Vol. 85(1), February 2003, pp. 153-165.
Vulnerable firms are defined as those firms that belong simultaneously to the top tertile for the leverage ratio (financial debt over total assets) and to the bottom tertile for the liquid asset ratio (current assets minus current liabilities over total assets). A firm with high debt but high liquid asset holdings and profits could take on more debt to finance future investment projects, whereas a firm with low liquid assets could find it difficult to take on more debt. See Albuquerque, B., “Corporate debt booms, financial constraints and the investment nexus”, Staff Working Paper, No 935, Bank of England, August 2021.
See e.g. Ottonello, P., Winberry, T., “Financial Heterogeneity and the Investment Channel of Monetary Policy”, Econometrica, Vol. 88, No 6, November 2020, pp. 2473-2502; Jeenas, P., “Firm Balance Sheet Liquidity, Monetary Policy Shocks, and Investment Dynamics”, Working paper, 2019. Lakdawala, A. and Moreland, T., “Monetary Policy and Firm Heterogeneity: The Role of Leverage Since the Financial Crisis”, Working Paper, 2021.
See the article entitled “Next Generation EU: A euro area perspective”, Economic Bulletin, Issue 1, ECB, 2022.
See e.g. Bańkowski, K., Bouabdallah, O., Domingues Semeano, J., Dorrucci, E., Freier, M., Jacquinot, P., Modery, W., Rodríguez-Vives, M., Valenta, V. and Zorell, N., “The economic impact of Next Generation EU: A euro area perspective”, Occasional Paper Series, No 291, ECB, April 2022.
Buiter, W.H., “‘Crowding out’ and the effectiveness of fiscal policy”, Journal of Public Economics, Vol. 7, No 3, June 1977, pp. 309-328.
Aschauer, D.A., “Is public expenditure productive?”, Journal of Monetary Economics. Vol. 23, No 2, March 1989, pp. 177-200.
See also Canova, F. and Pappa, E., “What are the likely macroeconomic effects of the EU Recovery plan?”, Working Paper, 2021; and Albrizio S. and Geli, J.F., “An empirical analysis of the determinants that can boost Next Generation EU´s effectiveness” Economic Bulletin, Issue 4, Banco de España, 2021, pp. 1-9.
See also Pfeiffer, P., Varga, J. and in ‘t Veld, J., “Quantifying Spillovers of Next Generation EU Investment”, European Economy Discussion Paper, No 144, European Commission, July 2021.
See Ficarra, M., Rückert, D., Virginie, A. and Weiss, C., Digitalisation in Europe 2020-2021 – Evidence from the EIB Investment Survey, European Investment Bank, July 2021. See also Anderton, R., Jarvis, V., Labhard, V., Morgan, J., Petroulakis, F. and Lara, V., “Virtually everywhere? Digitalisation and the euro area and EU economies – Degree, effects, and key issues”, Occasional Paper Series, No 244, ECB, June 2020, revised December 2020.
Peters, R.H. and Taylor, L.A., “Intangible capital and the investment-q relation”, Journal of Financial Economics, Vol. 123(2), 2017, pp. 251-272.
For a comprehensive overview, see Haskel, J. and Westlake, S., Capitalism without capital: The Rise of the Intangible Economy, Princeton University Press, 2017, and, for a discussion of the lagged impact of digital investment on firm-level productivity and the broader “productivity paradox”, see Work stream on productivity, innovation and technological progress, “Key factors behind productivity trends in EU countries”, Occasional Paper Series, No 268, ECB, September 2021, revised December 2021.
See Crotti, R., “Does intangible asset intensity increase profit-shifting opportunities of multinationals?” Graduate Institute of International and Development Studies Working Paper, No 02-2021, 2021; Avdijev, S., Everett, M. and Shin, H.S., “Tracking the international footprints of global firms”, BIS Quarterly Review, 11 March 2018; and Montornès, J. and Khder, M.B., “The impact of multinationals’ transfers on Irish GDP”, Eco Notepad, Post No 202, Banque de France, 2 March 2021.
See Coad, A. et al., “Investment expectations by vulnerable European firms – a difference-in-difference approach”, EIB Working Papers, 2022/04, European Investment Bank, March 2022.
See Caggese, A. and Pérez-Orive, A., “How stimulative are low real interest rates for intangible capital?”, European Economic Review, Vol. 142, 103987, February 2022.
See Döttling, R. and Ratnovski, L., “Technological progress reduces the effectiveness of monetary policy”, VoxEU, 19 March 2021.
See the box entitled “Digitalisation and its impact on the economy: insights from a survey of large companies“, Economic Bulletin, ECB, Issue 7, 2018; Anderton, R., Jarvis, V., Labhard, V., Morgan, J., Petroulakis, F. and Vivian, L., “Virtually everywhere? Digitalisation and the euro area and EU economies – Degree, effects, and key issues”, Occasional Paper Series, No 244, ECB, June 2020, revised December 2020; “The Digital Transformation of SMEs” Policy Highlights, OECD, 2021.
Not only the transition to a greener economy but also physical risks, such as natural disasters, affect investment, by destroying capital and triggering new investment (although this is not further discussed here), see Hallegatte, S. and Przyluski, V., “The economics of natural disasters”, CESifo Forum, Vol. 11, No 02, ifo Institute – Leibinitz Institute for Economic Research at the University of Munich, July 2010, pp. 14-24.
See the box entitled “The impact of climate change on activity and prices: insights from a survey of leading firms”, Economic Bulletin, Issue 4, ECB, 2022.
See “Global Investment in Low-Carbon Energy Transition Hit $755 Billion in 2021”, BloombergNEF, 27 January 2022.
See High-level group on post-COVID economic and social challenges, “A New Era for Europe – How the European Union Can Make the Most of its Pandemic Recovery, Pursue Sustainable Growth, and Promote Global Stability”, European Union, Luxembourg, 1 March 2022, p. 22.
See “Impact assessment accompanying the document ‘Communication from the Commission to the European Parliament, the Council, the European Economic and Social Committee and the Committee of the Regions: Stepping up Europe’s 2030 climate ambition – investing in a climate-neutral future for the benefit of our people’”, Commission Staff Working Document, SWD(2020) 176 final, European Commission, Brussels, 17 September 2020.
See Economics Department (EIB), “Investment Report 2020/2021: Building a smart and green Europe in the Covid-19 era”, European Investment Bank, 2021, p 149, and Spinaci, S., “Green and sustainable finance”, Briefing, European Parliamentary Research Service, European Parliament, February 2021.
The European Investment Bank plans to support €1 trillion worth of investments in climate action and environmental sustainability in the period 2021-30. It stopped financing fossil fuel energy projects in 2021 and will gradually increase the share of its financing dedicated to climate action and environmental sustainability to reach half of its operations in 2025.
The European Green Deal Investment Plan is intended to i) increase funding and mobilise at least €1 trillion in sustainable investments over the next decade, particularly via the InvestEU programme; ii) create an enabling framework for private and public investors; and iii) provide support for identifying, structuring and executing sustainable projects. As part of the European Green Deal, the EU is revising its climate, energy and transport-related legislation under the “Fit for 55 package” to align current laws with its goals for 2030 and 2050.
See Delanote, J. and Rückert, D., “How to foster climate innovation in the European Union: Insights from the EIB Online Survey on Climate Innovation”, EIB Working Papers, 2022/02, European Investment Bank, February 2022.
See the box entitled “The impact of climate change on activity and prices – insights from a survey of leading firms”, Economic Bulletin, Issue 4, ECB, 2022.